Archives par mot-clé : Gobal Temperature

New Study: Human Emissions ‘Irrelevant’ In Determining Changes In Atmospheric CO2 Since 1959

by K. Richard, Sept 2, 2027 in NoTricksZone


“The main factor governing the annual increase in atmospheric CO2 concentration is the SST [sea surface temperature] rather than human emissions.” – Ato, 2024

Another day, another new scientific paper has been published reporting efforts to curb anthropogenic CO2 emissions are “meaningless.”

In this study multiple linear regression analysis was performed comparing SST versus anthropogenic CO2 emissions as explanatory factors and the annual changes in atmospheric CO2 as the objective variable over the period 1959-2022.

The model using the SSTs (NASA, NOAA, UAH) best explained the annual CO2 change (regression coefficient B = 2.406, P = <0.0002), whereas human emissions were not shown to be an explanatory factor at all in annual CO2 changes (regression coefficient B = 0.0027, P = 0.863).

Most impressively, the predicted atmospheric CO2 concentration using the regression equation derived from 1960-2022 SSTs had an extremely high correlation coefficient of r = 0.9995.

Thus, not only is the paradigm that says humans drive atmospheric CO2 changes wrong, but “the theory that global warming and climate change are caused by human-emitted CO2 is also wrong.”

“SST has been the determinant of the annual changes in atmospheric CO2 concentrations and […] anthropogenic emissions have been irrelevant in this process, by head-to-head comparison.”

New Study: ‘Atmospheric CO2 Is Not The Cause Of Climate Change’ … The Next Glaciation Has Begun

by K. Richard, Sep 28, 2023 in NoTricksZone


New research published in the MDPI journal atmosphere by Dr. Stuart A. Harris asserts past and modern climate changes are natural and not driven by variations in atmospheric CO2 concentrations.

Some key points from the paper include:

• Past and modern climate change is driven by solar cycle (Milankovitch) variations and their affect on ocean circulation and heat transport.

• Throughout the last hundreds of thousands of years, temperature changes precede the lagging changes in CO2.

• The UN IPCC position that atmospheric CO2 is the cause of the warming since the onset of the Industrial Revolution is only an assumption that is “not consistent with studies involving changes in temperature in rural areas of the northern [NH] hemisphere.”

• The natural 23 thousand year (23 ka) Milankovitch cycle has begun to reduce insolation in the NH “starting in 2020,” and this “heralds the start of the next glaciation.”

• CO2 is essential for life on Earth (photosynthesis), and a reduction in CO2 would be harmful to the biosphere. On the other hand, there “seems to be no connection between carbon dioxide and the temperature of the Earth.”

Think We Can Model the Climate? Clouds Get in the Way

by R. Barmby, 9 Apt 2023 in CO2Coalition


I’ve looked at climate change from both sides now, and I have found common ground between proponents and skeptics of the belief that climate change is largely caused by humans. When it comes to forecasting global temperatures, distinguished experts in both camps agree a dominant variable cannot be simulated in computer models because clouds get in the way.

Among the proponents is Dr. Bjorn Stevens, a contributing author to the Intergovernmental Panel on Climate Change (IPCC) Assessment Report 5 (2014). Dr. Stevens is also director at the Max Planck Institute for Meteorology, Hamburg, Germany, and a cloud expert. In a recent interview he acknowledged the contribution of clouds to global warming is overestimated in the IPCC’s “Climate Change 2021: The Physical Science Basis.”

“Clouds are tricksters,” he said, referring to their complexity. However, he said, many scientists use oversimplified representations of clouds in modeling “as a guide because they are easier to simulate. This makes the climate models less accurate.”

On the skeptic side is Dr. Richard S. Lindzen, a former lead author for IPCC Assessment Report 3 and now a vocal critic of the IPCC. In a recent podcast the interviewer noted that Lindzen had published sufficient research papers to earn 80 PhDs. (Lindzen humbly declined the praise.)

Lindzen, professor emeritus of Atmospheric Sciences at the Massachusetts Institute of Technology,  points out that IPCC models rely on the assumption that water vapor and clouds amplify the greenhouse gas effects of CO2 in order to achieve forecasts of catastrophic global warming. The IPCC theory is that a warmer atmosphere will have a higher content of water vapor – itself is a greenhouse gas – that adds to the warming caused by CO2. Without this amplifying “positive feedback” effect, the models are still wrong for many reasons, but they no longer project “catastrophic” warming.

Dr. Stevens, who is on record stating that global warming is a “huge problem,” agrees that increased clouds do not amplify global warming: “Water-rich low clouds over the tropical ocean have the greatest cooling effect and low-water ice clouds at high altitudes have the strongest warming effect. Overall, the cooling effect is greater.” That’s called “negative feedback.”

Dr. Lindzen argues that global average temperature is controlled by the polar regions. The temperature at the tropics remains relatively constant over long periods of time while the polar regions have significant variations. In other words, a small change in global average temperature is the result of a big change in polar temperatures. The stability of tropical temperatures indicates that increased clouds provide negative feedback in times of global warming. Rather than exacerbating the global warming effect of CO2, clouds reduce it.

Lindzen proposes the mechanism by which greater negative feedback is produced: High altitude cirrus clouds (Dr. Stevens’ low-water high altitude ice clouds that cause warming) control heat emissions to space. As the air below these clouds warms, the cirrus clouds dissipate and allow more energy to radiate into space. He calls this the Iris Effect.

Mauna Loa Observatory

by Climate Auditor, January 2023


Atmospheric CO2 concentration

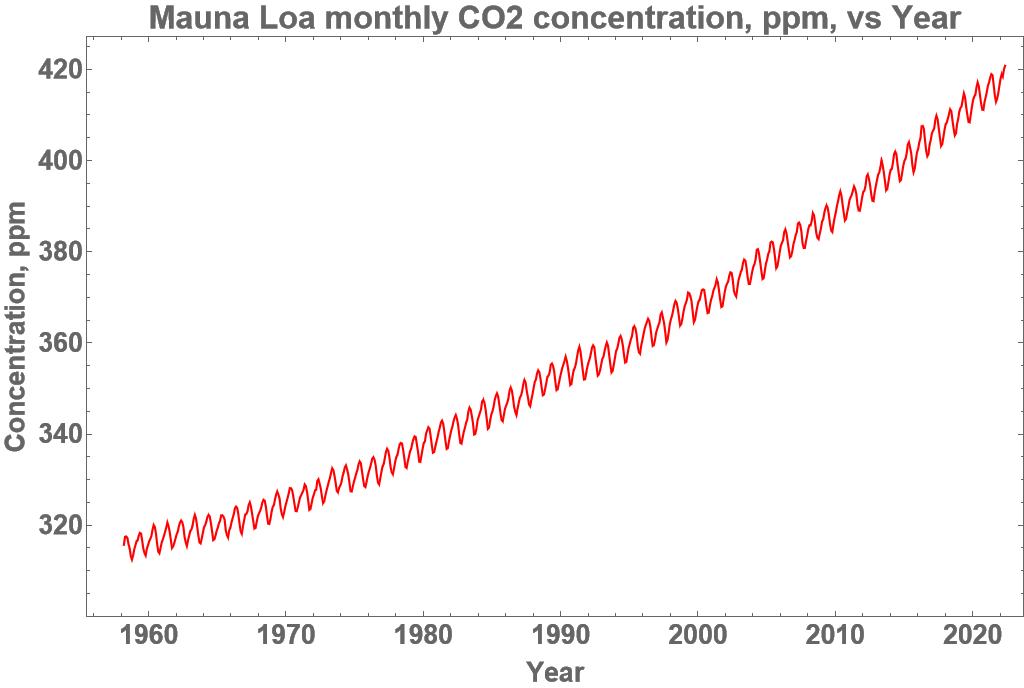
Here in Figure 1 is the monthly atmospheric CO2 concentration measured at the Mauna Loa Observatory, Hawaii, Latitude19.5̊ N, Longitude 155̊ W, elevation 3397m, for the 64 year period from March 1958 to May 2022.

Figure 1. Monthly atmospheric CO2 concentration, Mauna Loa Observatory, Source:[ Ref. 2]

The source file, Ref. 2, lists the data in 10 columns. The columns used here were columns 3 and 4, the date in Excel and decimal format, column 9 being the measured CO2 concentration with missing values in-filled from a smoothed fit to the data and column 10 being the seasonally adjusted measurements again with missing values in-filled.

The monthly CO2 concentration had an average rate of increase over the 64 year period from March 1958 to May 2022 of 1.60 ppm pa. For the 5 year period March 1958 to March 1963 the rate was 0.68 ppm pa and for the 5 year period May 2017 to May 2022 the rate was 2.50 ppm pa, that is, the rate of increase has steadily accelerated over time to be 3.7 times greater than it was 59 years earlier. The range was from a minimum of 312.43 ppm to a maximum of 420.78 ppm.

The amplitude of the seasonal variation was estimated to range from 5.25 ppm to 8.03 ppm, increasing in amplitude over time, in an irregular fashion. The maxima occurred, on average, in early May, which is the beginning of Summer, and the minima in late September, at the end of Summer. The greatest seasonal variation took place between September 2015 and April 2016. This means that the CO2 concentration rose during the cool of Winter and fell during the heat of Summer, which is out of phase with the UN IPCC claim that increased CO2 concentration causes an increase in temperature. Nor does the UN IPCC hypothesis provide an explanation for the steady increase in the rate of increase of the CO2 concentration.

Temperature and CO2 concentration

Here is 522 months of empirical data, showing a distinct lack of a relationship between the Tropics satellite lower troposphere temperature [ Ref.1] and the seasonally adjusted atmospheric CO2 concentration at the Mauna Loa Observatory.


Figure 2. Mauna Loa Observatory, Source: [ Ref. 1] and [ Ref. 2]

Figure 2 shows the monthly satellite lower troposphere temperature for the Tropics zone, 20̊ South to 20̊ North, in blue, and the relevant monthly CO2 concentration in red after removal of the seasonal variation so as to match the residual temperature series. The range for the monthly CO2 concentration is from 335.77 ppm to 418.2 ppm. The range for the Tropics temperature is from -0.99̊ Celsius to +1.15̊ Celsius with respect to a 30 year average base value. The clear and obvious difference between the two raises the possibility that there may be no common causal factor whereby the CO2 concentration drives the temperature as claimed by the UN IPCC.

Calculation of the Ordinary Linear Regression between the two time series gave a Pearson correlation coefficient of 0.462 from the 522 monthly data pairs. This is a measure of the relationship between the background linear trend of each of the time series as shown by an almost identical correlation of 0.463 between the temperature and the time. The correlation between the CO2 concentration and the time was 0.995, that is, the seasonal adjusted CO2 concentration time series was practically a linear trend with respect to time. Any pair of linear trends, no matter what their source, will have a high correlation coefficient of about 1.0 which is necessarily of no causal significance as a background linear trend with respect to time can be calculated for any time series.

UAH GLOBAL TEMPERATURE DROPS BELOW 30-YEAR BASELINE — EARTH IS COOLING

by Cap Allon, April 5, 2021 in Electroverse


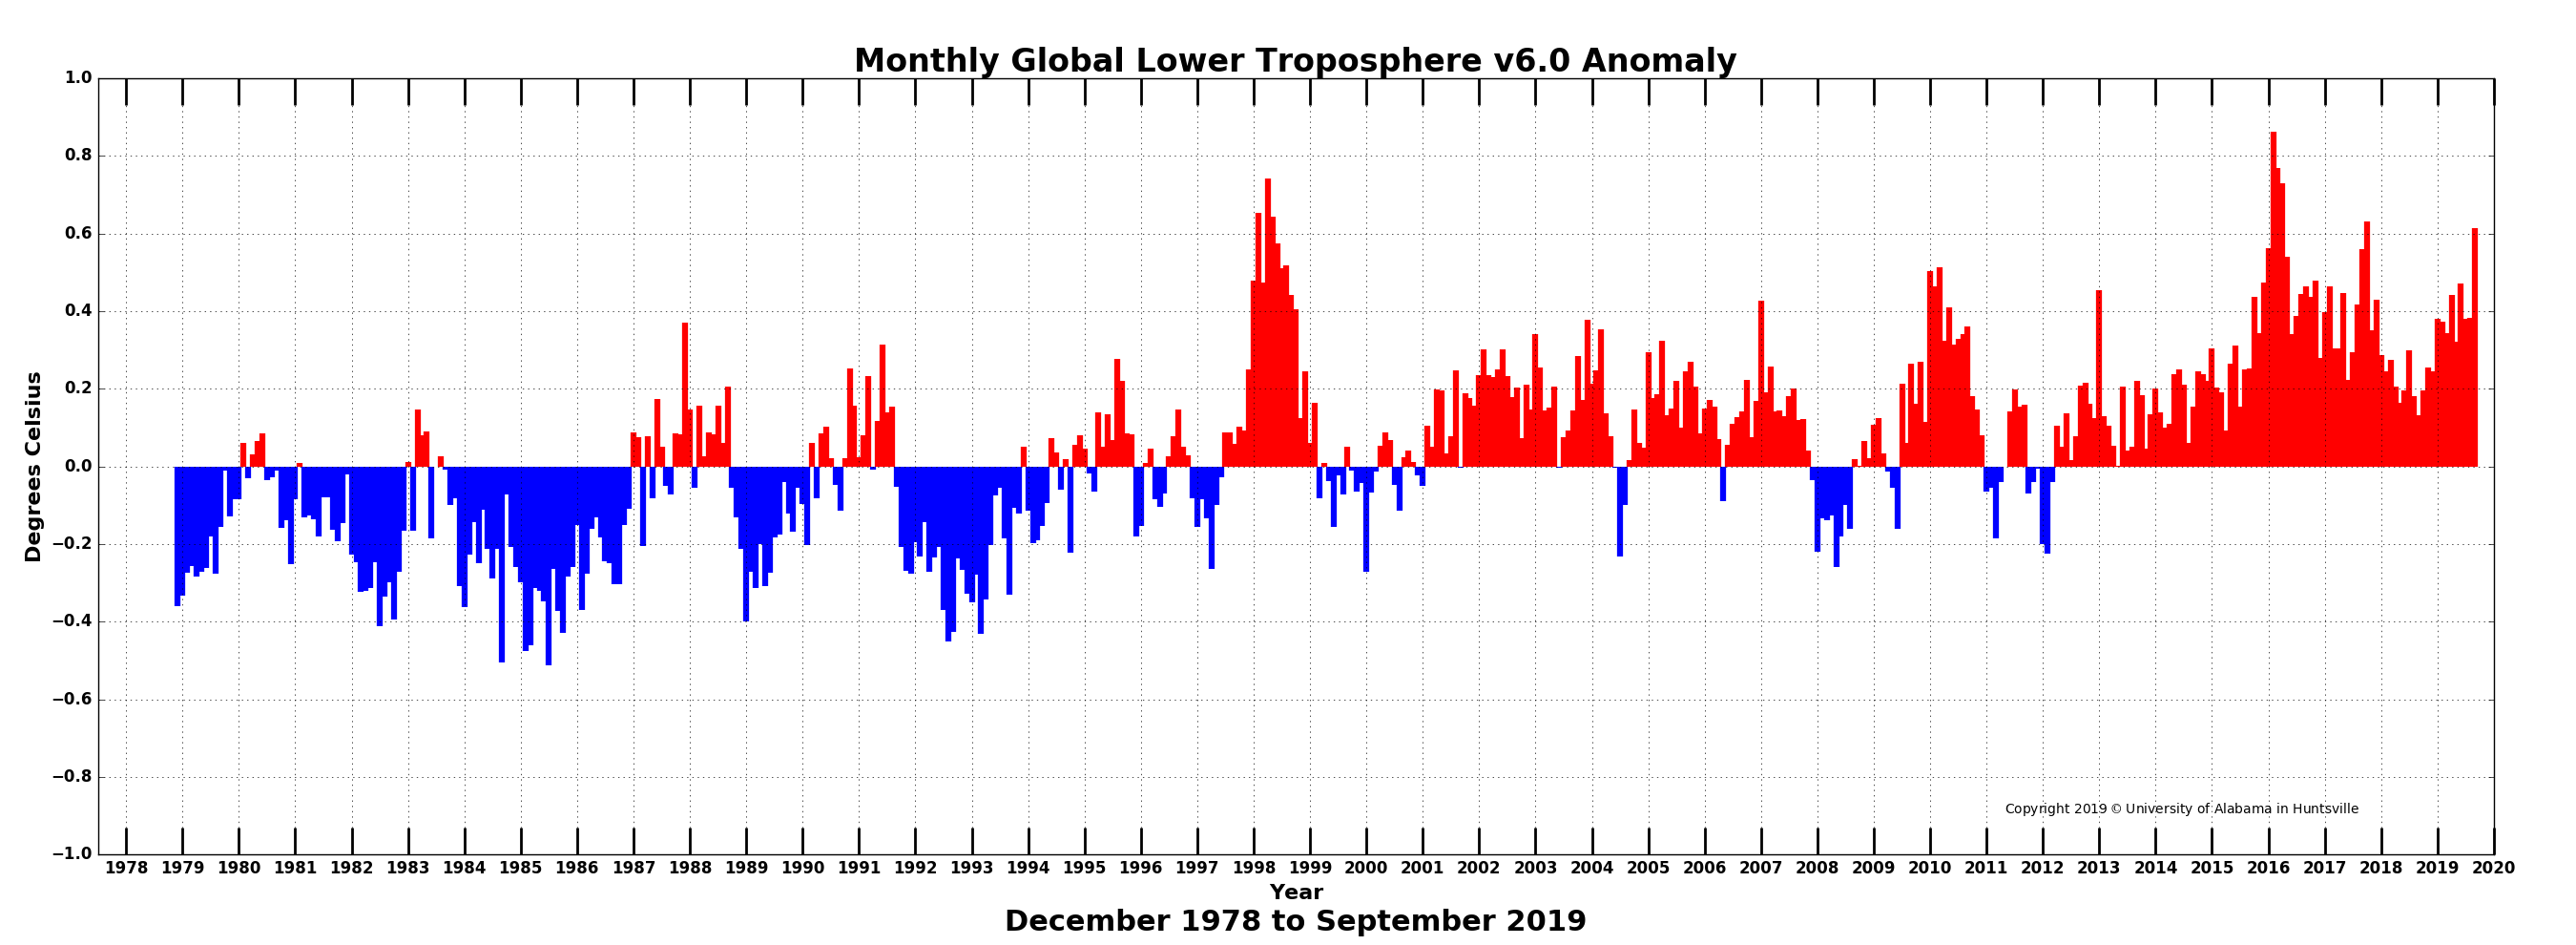
The Version 6.0 global average lower tropospheric temperature (LT) anomaly for March, 2021 has come in at -0.01 deg. C below the 30-year baseline, down from the February, 2021 value of +0.20 deg. C, and down substantially (approx. 0.6C deg. C) from where we were around a year ago.

A continuation of this downward plunge is highly probable over the coming months (with the odd bump along the way–climate is cyclic after all) as low solar activity and La Nina conditions persist.

According to the 15x NASA/NOAA AMSU satellites that measure every square inch of the lower troposphere (where us humans reside), planet Earth was actually warmer back in 1983:

REMINDER: We have changed the 30-year averaging period from which we compute anomalies to 1991-2020, from the old period 1981-2010. This change does not affect the temperature trends.
[www.drroyspencer.com]

In addition, the global average oceanic tropospheric temperature anomaly is -0.07 deg. C–the lowest since November 2013. Also, the tropical (20N-20S) departure from average is -0.29 deg. C–the coolest since June of 2012. While Australia, at -0.79 deg. C, is the coolest reading since August 2014.

Bottom line, the Grand Solar Minimum is intensifying — and fast.

Sunspots (a great barometer for solar activity) have remained sparse in 2021, even at a time when the next the next solar cycle (25) should be firing-up.

The Solar Minimum of cycle 24 began bottoming-out way back in late-2017, and went on to develop into the deepest minimum of the past 100+ years — and it is still proving reluctant to release its grip:

Global Temperature Report: September 2019

by Anthony Watts, October 3, 2019 in WUWT


Global climate trend since Dec. 1 1978: +0.13 C per decade

September Temperatures (preliminary)

Global composite temp.: +0.61 C (+1.10 °F) above seasonal average

Northern Hemisphere.: +0.64 C (+1.15 °F) above seasonal average

Southern Hemisphere.: +0.58 C (+1.00°F) above seasonal average

Tropics.: +0.60 C (+1.08°F) above seasonal average

August Temperatures (final)

Global composite temp.: +0.38 C (+0.68 °F) above seasonal average

Northern Hemisphere.: +0.33 C (+0.59 °F) above seasonal average

Southern Hemisphere.: +0.44 C (+0.79°F) above seasonal average

Tropics.: +0.45 C (+0.81 °F) above seasonal average

Notes on data released October 3, 2019 (v6.0)

September’s globally-averaged, bulk-layer atmospheric temperature anomaly of +0.61°C (+1.10°F) represented the warmest September reading of the past 41 Septembers in our satellite record. The jump from August was substantial (+0.23°C) and ranks among the largest month-to-month changes. (Several previous jumps were greater than 0.3°C however.) The warmth was global in extent with warmest September temperatures posted for both hemispheres and the tropical belt. This month-to-month heating is possibly related, at least in part, to the tropical Pacific Ocean’s loss of heat energy to the atmosphere in the recent months as El Niño conditions declined.

Global Temperature Drops By 0.4°C In Three Years

by P. Homewood, November 30, 2018 in NotaLotofPeopleKnowThat


I wholeheartedly agree with David’s comments, in particular the need to show graphs.

I am sometimes accused of cherry picking or coming to different conclusions to others. But what I always try to do is actually show the graph, so readers can form their own opinions.

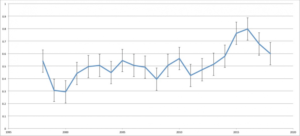
While we are on the topic, I will put up that Woodfortrees graph, which I posted yesterday. According to Woodfortrees, the warming trend since 1950 has been 0.012C/yr, or 1.2C/C.

Yet the BBC report, referred to by Dr Whitehouse, actually states that:

If the trend continues, the WMO says temperatures may rise by 3-5C by 2100.

This claim clearly is not compatible with the historical data

Fig 2 shows the same data with error bars from which it can be seen that 2018 is statistically equivalent to some years before the El Nino event.

See aslo here

Do Doomsters Know How Much Global Surface Temperatures Cycle Annually

by Bob Tisdale, November 5, 2018 in WUWT


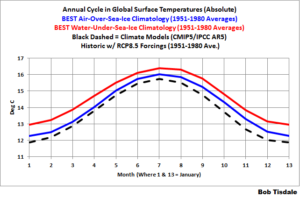
Alternate Title: The Annual Cycle in Global Land+Ocean Surface Temperature IS Far Greater Than 1.5 Deg C, AND Much-Much-MUCH Greater Than 1.5 Deg C Annually for Global Land Air Surface Temperatures

We all were taught early in school that the Earth orbits the Sun…that its path is elliptical…that because of the tilt in Earth’s axis of rotation, we have seasons as the Earth orbits our star annually. Because of the elliptical orbit, and because the ratios of land to ocean are different between the Northern and Southern Hemispheres, we might expect that global average surface temperatures would vary over the course of a year.

Later in life we’ve been brow beaten with alarmism about human-induced global warming and climate change…that the Earth will become a literal—not figurative—hell if global surface temperatures rise—formerly 2-deg C—now 1.5 deg C above pre-industrial levels. But does the average person know much global surface temperatures vary annually as it orbits the Sun? It’s unlikely, because I’ve never before seen graphs that are similar to what’s presented in this post or seen it discussed in any of the global warming literature. Am I expecting most persons to find this information to be of any interest? Nope. I simply find it noteworthy that, as I mentioned before, I’ve never seen it presented anywhere. In fact, I just Googled, in quotes, “How Much Do Global Surface Temperatures Cycle Annually?” and Google replied (their boldface), “No results found for “How Much Do Global Surface Temperatures Cycle Annually?”.

Remarkable, is it not, in these times of global warming interest?

Enough with the preamble and on to the meat of the post: