Archives par mot-clé : Heatwaves

Australian Heatwave Stories Slammed Some More. Part 2.

by G. Sherrington, Feb 6, 2025 in WUWT


There were 10 significant weather station/city sites explored for their heatwave properties in the first article of this series, 5 days ago.

Australian Heatwave Stories Cop Severe Criticism – Watts Up With That?

That first article shows 160 graphs of hottest heatwave temperatures over the years when records have been kept, for Adelaide, Alice Springs,  Brisbane, Cape Leeuwin, Darwin, Hobart, Longreach, Melbourne, Sydney and Perth. This second article deals with some patterns of interest.

I wrote the articles because many Establishment sources make claims like this one from the Climate Council of Australia, 2014:

“Climate change is already increasing the intensity and frequency of heatwaves in Australia. Heatwaves are becoming hotter, lasting longer and occurring more often.”

HEATWAVES: HOTTER, LONGER, MORE OFTEN

An Internet search using “heatwaves longer hotter more often” returns these 6 hits and more.

Climate change study: Australia is in the crucible of slower, longer heatwaves | SBS News

Heatwaves: hotter, longer, more often – Macquarie University

Heatwaves: hotter, longer, more often – Environmental Health Australia (Western Australia) Inc

Australian heatwaves more frequent, hotter and longer: Climate Council report – ABC News

nationalacademies.org/based-on-science/global-warming-makes-heat-waves-hotter-longer-and-more-common

Heatwaves to be hotter, longer and more frequent, climate change report says – ABC News

HOTTER?

Using practically all years of data recorded, I examined each of 4 heatwave durations of 1, 3, 5 and 10 days. The raw data are from the Climate Data Online CDO source by the Bureau of Meteorology.

The first half of the heatwave numbers is compared to the last half. The first half numbers are subtracted from the second half numbers. If there is warming, the difference is positive. If there is cooling, the difference is negative.

This example summarises the method by a graph.

Australian Heatwave Stories Cop Severe Criticism

by G. Sherrigton, Jan 29, 2025 in WUWT


The daily temperature observations from many Australian weather stations have now been routinely updated by the Bureau of Meteorology, BOM, to the end of year 2024.

Year 2024 has been publicized GLOBALLY as the “hottest year evah!” so it is time to examine how Australia fared. Here, heatwaves are the medium used.

The frequent, accepted chant is that globally, heatwaves are becoming “hotter, longer and more frequent”. This chant is not supported by the following heatwave analysis which examines 10 Australian weather stations with lengthy historic observations. This study has generated 160 graphs that are linked by weather station/city that is the main part of this article for readers to examine.

Here is a snapshot of Adelaide, using only 3-day heatwave examples, 4 graphs out of a possible 16 for Adelaide.

Some essential points:

  1. A day of missing data can lead to large damage to the calculations, because that 1 day affects 9 other days in the 10-DAY analysis. Therefore, all missing values were infilled, either by a subjective guess in the ballpark of surrounding values, or with the overall average Tmax value for the station. The shortest duration station, Brisbane, has some 50,400 days analyzed, with a few hundred missing values, so the odds of induced error are small. They can be traced.
  2. I have made the Excel commands as simple as possible. No knowledge of macros, programming or even Pivot tables is needed. The invitation is open for you to replicate the methodology for your own locations.
  3. I have not cherry picked the weather stations. Together, these 10 cities/locations house more than 70% of Australian population. This has meaning when planning for heatwaves, such as where to build hospitals and how large to make them.
  4. The chosen cities probably suffer from the temperature distortion of Urban Heat Island effect. There have been transect studies showing UHI in excess of a couple of degrees at times in both Sydney and Melbourne. I have now included two stations unlikely to have been affected by UHI, Cape Leeuwin and Longreach.

The Climate Sciences Use Of The Urban Heat Island Effect Is Pathetic And Misleading – Watts Up With That?

  1. Rebuttal of the misunderstanding that heatwaves are becoming “hotter, longer and more frequent” lacks credibility if actual data are used such s here, for 10 stations in far off Australia. It is hard to maintain that misunderstanding when simple graphs of real data are shown to those who make such claims. I am writing a more detailed analysis of these 160 graphs, should WUWT accept it.
  2. You are encouraged to make similar graphs for regions elsewhere. For heatwaves, they are hard to refute, in contrast with official/IPCC type studies, which usually commence after 1950 and which rely upon arcane definitions of heatwave to arrive at conclusions.

Unexplained heat-wave ‘hotspots’ are popping up across the globe

by Columbia Climate School, Nov 26, 2024 in ScienceDaily


Summary :  A striking new phenomenon is emerging: distinct regions are seeing repeated heat waves that are so extreme, they fall far beyond what any model of global warming can predict or explain. A new study provides the first worldwide map of such regions, which show up on every continent except Antarctica like giant, angry skin blotches.

Earth’s hottest recorded year was 2023, at 2.12 degrees F above the 20th-century average. This surpassed the previous record set in 2016. So far, the 10 hottest yearly average temperatures have occurred in the past decade. And, with the hottest summer and hottest single day, 2024 is on track to set yet another record.

All this may not be breaking news to everyone, but amid this upward march in average temperatures, a striking new phenomenon is emerging: distinct regions are seeing repeated heat waves that are so extreme, they fall far beyond what any model of global warming can predict or explain. A new study provides the first worldwide map of such regions, which show up on every continent except Antarctica like giant, angry skin blotches. In recent years these heat waves have killed tens of thousands of people, withered crops and forests, and sparked devastating wildfires.

“The large and unexpected margins by which recent regional-scale extremes have broken earlier records have raised questions about the degree to which climate models can provide adequate estimates of relations between global mean temperature changes and regional climate risks,” says the study.

“This is about extreme trends that are the outcome of physical interactions we might not completely understand,” said lead author Kai Kornhuber, an adjunct scientist at the Columbia Climate School’s Lamont-Doherty Earth Observatory. “These regions become temporary hothouses.” Kornhuber is also a senior research scholar at the International Institute for Applied Systems Analysis in Austria.

The study was just published in the journal Proceedings of the National Academy of Sciences.

Climbing overall temperatures make heat waves more likely in many cases, but the causes of the extreme heat outbreaks are not entirely clear. In Europe and Russia, an earlier study led by Kornhuber blamed heat waves and droughts on wobbles in the jet stream, a fast-moving river of air that continuously circles the northern hemisphere.

Also here

El Nino Fueled ‘Unprecedented’ West African Heatwave, Not Climate Change

by L. Lueken, Apr 19, 2024 in ClimateChangeDispatch


Multiple media outlets, including the BBC and Reuters, claim that a recent West African heatwave would be “impossible” without global warming. This claim is misleading and not supported by real-world data. [emphasis, links added]

The study cited in both articles is merely an attribution modeling study, which is not proof of the influence of climate change.

In their article on a recent heatwave in West Africa and the Sahel, Reuters reports“[t]emperatures soared so high in Mali and Burkina Faso they equated to a once in 200-year event, according to the report on the Sahel region by World Weather Attribution (WWA).”

Reuters continues: “The severity of the heatwave led WWA’s team of climate scientists to conduct a rapid analysis, which concluded the temperatures would not have been reached if industry had not warmed the planet by burning fossil fuels and other activities.

One of World Weather Attribution’s statisticians even went so far as to say that heatwaves of that intensity wouldn’t happen at all in the region in a “preindustrial climate.”

This claim is utterly unfounded, as those parts of Africa are known for being at least semi-arid, subtropical, and prone to drought and heatwaves.

While temperature records are not very lengthy or complete for many parts of Africa, April is known to be the hottest month of the year for Burkina Faso in particular, and many parts of the Sahel region in general, where temperature maximums on average are above 40°C – which is what the recent heatwave brought, meaning there is no justification for claiming the recent heatwave is historically unprecedented.

Climate Realism has frequently noted that WWA’s “rapid attribution” studies are more in the realm of fantasy than fact, as they depend on virtual models of climate conditions that do not actually exist in real life.

The model of the climate that an event like the recent Sahel heatwave is compared to represents how scientists guess things would have been had it not been for the burning of fossil fuels.

During Burkina Faso’s dry season, fishermen abandon their canoes on site while waiting for the waters to arrive. Photo by YODA Adaman on Unsplash

They Never Used To Have Heatwaves in Mali!

by P. Homewood, Apr 18, 2024 in NotALotOfPeopleKnowThat


A deadly heatwave in West Africa and the Sahel was “impossible” without human-induced climate change, scientists say.

Temperatures soared above 48C in Mali last month with one hospital linking hundreds of deaths to the extreme heat.

Researchers say human activities like burning fossil fuels made temperatures up to 1.4C hotter than normal.

A number of countries in the Sahel region and across West Africa were hit by a strong heatwave that struck at the end of March and lasted into early April.

The heat was most strongly felt in the southern regions of Mali and Burkina Faso.

In Bamako, the capital of Mali, the Gabriel Toure Hospital said it recorded 102 deaths in the first days of April.

Around half the people who died were over 60 years of age, and the hospital said that heat played a role in many of these casualties.

Researchers believe that global climate change had a key role in this five-day heatwave.

A new analysis from scientists involved with the World Weather Attribution group suggests the high day time and night time temperatures would not have been possible without the world’s long term use of coal, oil and gas as well as other activities such as deforestation.

What Heatwave?

by P. Homewood, Apr 14, 2024 in NotaLotOfPeopleKnowThat


I hope you did not blink, otherwise you may have missed it!

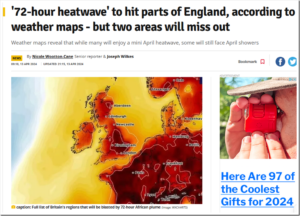
Brits are set to bask in a ’72 hour’ heatwave, according to some forecasters, but not everyone will be feeling the heat as two parts of England are expected to miss out on the sizzling temperatures.

Weather maps reveal that while many will enjoy a mini April heatwave, some will still face April showers. According to WX Charts, which uses Met Desk data for its predictions, temperatures could soar to a balmy 21C at times this month.

The charts indicate that Londoners can expect to enjoy highs of 20C from today until Saturday, with East Anglia and the East Midlands not far behind at 19C. Cities like Birmingham, Nottingham, Manchester, and Sheffield are also set to experience a warm 18C.

https://www.manchestereveningnews.co.uk/news/uk-news/72-hour-heatwave-hit-parts-28989573

Sure enough temperatures reached 21C in Essex, but I don’t know anyone who would actually describe this as a heatwave:

New Paper Claims Antarctica Had The ‘Most Intense Heat Wave Ever Recorded’. It Didn’t

by P. Gosselin, Sep 27, 2023 in ClimatChangeDispatch


On September 24th, 2023, Kasha Patel, a writer for The Washington Post (WaPo) created a story that is likely in the top 10 most false and egregious climate scare stories ever published.

Titled, “Scientists found the most intense heat wave ever recorded — in Antarctica,” the story isn’t just false, it is doubly so because the research paper it is based on is also seriously flawed. [emphasis, links added]

In this case, peer review at Geophysical Research Letters (GRL) failed to catch and correct the most basic abuse of the definition of a “heat wave.”

The leading paragraph of the WaPo story said:

In March 2022, temperatures near the eastern coast of Antarctica spiked 70 degrees Fahrenheit (39 degrees Celsius) above normal — making it the most intense recorded heat wave to occur anywhere on Earth, according to a recent study.

At the time, researchers on-site were wearing shorts and some even removed their shirts to bask in the (relative) warmth. Scientists elsewhere said such a high in that region of the world was unthinkable.

WaPo also provided a normal temperature, for reference with some “unbelievability” from the lead author of the paper.

Temperatures in March, marking a change into autumn on the continent, are typically around minus -54 degrees Celsius on the east coast near…Dome C. On March 18, 2022, temperatures peaked to minus -10 degrees Celsius. That’s warmer than even the hottest temperature recorded during the summer months in that region — “that in itself is pretty unbelievable,” said Blanchard-Wrigglesworth, an atmospheric scientist at the University of Washington.

First, it is important to point out that the so-called “heat wave” really wasn’t warm at all; the shorts and shirt removal were completely for show, rather than science.

Since most people in the United States use the Fahrenheit temperature scale, which isn’t mentioned at all in the WaPo article citing the actual high temperature recorded, it was easy for reporter Kasha Patel to sneak by the idea that it was actually warm at the time.

-10 Celsius is actually 14 degrees Fahrenheit – which isn’t warm, much less a “heat wave” by any definition. Patel can’t be forgiven for not mentioning this in the article because anyone can get the conversion simply by typing it into Google, like this example.

But that isn’t the worst journalistic violation Patel makes.

State of the climate – summer 2023

by J. Curry, Aug 15, 2023 in WUWT


A deep dive into the causes of the unusual weather/climate during 2023.  People are blaming fossil-fueled warming and El Nino, and now the Hunga-Tonga eruption and the change in ship fuels.  But the real story is more complicated.

Observations

Starting in June, the global temperatures are outpacing the record year 2016 (Figure 1).

Figure 1.  From Copernicus ECMWF

Here is the time series of the monthly surface temperature anomalies from the ERA5 reanalysis (Figure 2).  The July 2023 spike was of comparable magnitude to the winter 2016 anomaly which occurred in late winter.

Figure 2.

Here is the time series of the monthly lower atmospheric temperature anomalies from the UAH satellite-based analysis.  The July 2023 temperature anomaly remains slightly below the peak 2016 temperature anomalies and comparable to the peak 1998 temperature anomaly.

Figure 3. Plot from Roy Spencer

The spatial variation of July temperature anomalies is shown below (Figure 4). The ERA5 is the long-standing standard for global reanalyses; the JMA-Q3 (Japan) is a new product that uses a more sophisticated data assimilation process, and I expect it to be at least as good as the ERA5.  Superficially, the spatial variability looks pretty much the same, but it is informative to compare the regional amounts of warming which differ significantly between the two reanalyses. Warming is greatest in the Antarctic, and lowest in the Arctic. The warming is also very strong over the NH midlatitude oceans.

The polar regions are of particular interest. The Arctic sea ice is healthy – Arctic sea ice extent for July was only the twelfth lowest in the satellite record.  Greenland mass balance (snow accumulation minus melt) for July is above average relative to 1980-2010.  The Antarctic is a different story.  Antarctic winter sea ice is extremely low, much lower than any wintertime observations since the beginning of the satellite record in 1980.  The warm anomaly near Antarctica is an effect the reduced sea ice extent, not a direct cause. The Antarctic ozone hole is opening very early.

No, July Wasn’t The Warmest Month In Human History

by Dr M. Wielicki, Aug 14, 2023 in ClimateChangeDispatch


What’s going on?

During the last month, we were bombarded with headlines such as:

This month is the planet’s hottest on record by far – and hottest in around 120,000 years, scientists sayCNN, July 27, 2023

July 2023 ‘Virtually Certain’ To Be Hottest Month In Human HistoryForbes, July 27, 2023

So is there any validity to these claims… Was July the hottest month in human history? [emphasis, links added]

…snip…

Our civilization’s trajectory, from its humble beginnings in the wild to its current digital sophistication, serves as a testament to humanity’s relentless drive for advancement and ability to adapt.

The African Humid Period (AHP) and the rise of the Egyptian civilization…

The African Humid Period (AHP) is a climatic phase during the Holocene epoch characterized by much wetter conditions in large parts of Africa, especially the Sahara region, compared to the present day.

This significant shift in precipitation patterns had profound impacts on both the environment and early human societies of the continent.

The AHP roughly spanned from about 15,000 to 5,000 years ago, though exact timings can vary based on specific regions within Africa. It began at the end of the Last Glacial Maximum when ice sheets started retreating in the Northern Hemisphere.

One of the most dramatic manifestations of the AHP was the transformation of the Sahara desert. Today’s vast desert expanse was once a mosaic of grasslands, lakes, and rivers.

This “Green Sahara” supported a variety of wildlife, from large mammals like elephants and giraffes to a variety of fish in its waterways.

The wet conditions of the AHP supported a much denser human population in regions that are now desert. Archaeological evidence shows that these ancient Saharan communities engaged in fishing, hunting, cattle herding, and even agriculture.

The abundance of water and food allowed for relatively settled lifestyles compared to the more nomadic existences necessitated by the arid conditions that followed.

The primary driver behind the AHP is believed to be warmer summer temperatures and changes in the monsoon systems, which brought more rain to the African continent.

As these parameters shifted over millennia, the monsoons weakened, leading to the aridification of vast regions.

The African Humid Period serves as a reminder of the profound climatic variability our planet has experienced throughout relatively recent geological history at preindustrial levels of CO2, and the relative insensitivity of surface temperature and/or humidity and the concentration of GHG in the atmosphere.

A heatwave isn’t the end of the world

by T. Fazi, July 18, 2023 in UnHerd


As I write this, in my favourite local café in Rome, the temperature outside is close to 40°C. So yes, it’s hot. Yet, thanks to a relatively old invention — air conditioning — I’m able to work in comfort. The 10-minute bike ride back home will be tougher than usual, but it won’t kill me. Like most people here, I consider these temperatures to be a nuisance — but that’s about it.

According to the news, however, I should be terribly concerned — terrified, in fact. Everyone’s running headline stories about the “extreme”, “record-breaking” and “deadly” hot weather sweeping across Asia, the US and, most notably, Europe. Here, the heatwave was unofficially named Cerberus, the multi-headed dog that guards the gates of Hades, before being replaced by Charon, the man who ferries the dead there. Rome is being called the “infernal city”. To be honest, I can think of several much more hellish places around the world at the moment — cities plagued by poverty, terrorism and war. And yet we are told that the current heat waves are a taste of the “hell” that awaits us as a result of climate change.

Contradicting Data, Media Claim Canadian Wildfires And Heat Waves Made Worse By Climate Change

by H.S. Sterling, Jul 5, 2023 in ClimateChangeDispatch


Thus, it can’t be proof of climate change. And, as noted in Climate at a Glance: U.S. Heat Waves:

  • In recent decades in the United States, heat waves have been far less frequent and severe than they were in the 1930s.
  • The all-time high-temperature records set in most states occurred in the first half of the twentieth century.
  • The most accurate nationwide temperature station network, implemented in 2005, shows no sustained increase in daily high temperatures in the United States since at least 2005.

That’s right, neither heat waves nor wildfires, whether in Canada or elsewhere are getting worse.

The fear and actual damage generated by wildfires each year are bad enough without the bought-and-paid-for mainstream media making it worse by encouraging the misdirection of resources from taking actions that address the true causes of wildfires to the battle against climate change.

There is no evidence climate change has or will cause more heatwaves, droughts, or resulting wildfires

Intense, Long-Lasting Heatwaves Unfolding At The Bottom Of The Ocean

by G. Dickie, Mar 16, 2023 in ClimateChangDispatch


Heatwaves unfolding on the bottom of the ocean can be more intense and last longer than those on the sea surface, new research suggests, but such extremes in the deep ocean are often overlooked.

A team of scientists with the U.S. National Oceanic and Atmospheric Administration has conducted the first assessment of marine heatwaves along North America’s continental shelves.

They found that these bottom heatwaves ranged from 0.5 degrees Celsius to 3C warmer than normal temperatures and could last more than six months — much longer than heatwaves at the surface.

“We simply don’t have a ton of instruments on the ocean bottom along continental shelves,” said study co-author Dillon Amaya, an NOAA climate scientist. “The ocean is a powerful thing. It destroys instruments that we have in the water for too long.

Surface heatwaves can be picked up by satellites and can result in huge algal blooms.

No, Met Office–A Dry July Does Not Mean Climate Change.

by P. Homewood, July 30, 2022 in NotaLotofPeopleKnowThat


So far July 2022 has been the driest July in England since 1911. Up to 26 July there has been only 15.8mm of rain averaged across England; this is only 24% of the amount we would expect in an average July.

At this stage in the month we would expect to have seen well over three-quarters of the month’s rain to have already fallen in an average July.

The situation for the UK is a little better. As it stands, July 2022 is still the eighth driest July since 1836. With only 37.7mm of rain having fallen so far it is the driest July since 1984. Scotland has been closer to average in the north and west, but drier conditions have prevailed for south and east Scotland. Overall Scotland (71%), Wales (39%) and Northern Ireland (43%) have been dry, but the most extreme conditions are in East Anglia and southeast England.

Mark McCarthy, Head of the Met Office National Climate Information Centre, said: “It is not just July that has been dry. Since the start of the year, all months apart from February have been drier than average in the UK too. The result of this is that the winter, spring and summer of 2022 have all seen less than the UK average seasonal rainfall. 

“England has seen the lowest levels during these periods and, rainfall totals for the first six months of the year are around 25% below their long-term average, with the driest regions in the east and southeast.

UK heatwave: How do temperatures compare with 1976?

by P. Homewood, July 24, 2022 in NotaLotofPeopleKnowThat


People on social media have been comparing the high temperatures in much of the UK with the heatwave of 1976, suggesting that the severity of the current hot weather is being exaggerated.

So, what does the evidence show?

How hot was the summer of 1976?

The peak that year was 35.9C. That has been beaten by the current temperatures, with 40.3C recorded so far.

The heatwave of 1976 started in June and lasted for two months. There was a lack of rainfall and a significant drought, with the government enforcing water rationing.

The heatwave was rare for that decade. The average maximum temperature in July in the 1970s was 18.7C. In the 2010s, it was more than 20C.

The European Heat Wave and Global Warming

by Guest Blogger, July 21, 2022 in WUWT


From the Cliff Mass Weather Blog

There is a lot of talk about the short-term European heatwave with some suggesting that the record-breaking warmth is the result of climate change/global warming.

Some of the media and climate advocates have been over the top in their claims (see below), stating that this event was the result of human-caused global warming.

Was It Hotter In 1911?

by P. Homewood, July 23, 2022 in NotaLotofPeopleKnowThat


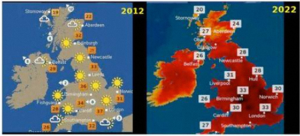
There has inevitably been a lot of apoplectic reporting about this week’s heatwave in Britain. Everybody from the BBC to the Met Office have been blaming it on climate change, with suitably scary colours to ram the message home:

Comparison of TV weather Maps from the BBC in summer 2012, left, and summer 2022 right. Source: BBC

Courtesy of Climate Realism

But so far I have not seen an objective analysis.

So let’s start with a few simple facts:

1) It was extremely hot for a couple of days this week.

2) The heat was the result of an extremely unlikely set of meteorological conditions – a perfect storm, if you like.

We know this because the Met Office told us so. On July 8th, they announced the possibility of a heatwave a week later. The weather model runs produced a wide band of possibilities, with most predicting similar temperatures to the weekend before, and some even forecasting no heatwave at all. At that stage on a couple of models out of the hundreds run predicted 40C temperatures, which were described by the BBC as “a very tiny possibility”.


The heatwave green hysteria is out of control

by P. Homewood, July 18, 2022 in NotaLotofPdeopleKnowThat


If you find yourself wondering over the next few days why it is so swelteringly hot, I have an answer for you. It’s because of rich people. It’s because of those wealthy elites with all their gas-guzzling vehicles and reckless holidaymaking. It’s their fault you’re sweating on the Tube.
This infantile claim really is being made, and by supposedly serious politicians. Labour’s Richard Burgon, over on his Instagram account, is wringing his no doubt sweaty hands over the filthy rich folk who apparently landed us in this weather apocalypse.
‘As we face 40C temperatures and the first ever Red Extreme Heat Warning, remember this climate crisis is driven by the wealthy’, he cries. His stern words are accompanied, naturally, by that Met Office map showing half of Britain coloured dark red – the hellish hue that has been chosen to illustrate how dire our predicament has allegedly become.
Is anyone else tiring of all this green hysteria over the heatwave? There is something medieval about it. There is something creepily pre-modern in the idea that sinful mankind has brought heat and fire and floods upon himself with his wicked, hubristic behaviour. What next – plagues of locusts as a punishment for our failure to recycle?

Think it’s hot now? How Britain roasted in TEN-WEEK heatwave during summer of ’76

by P. Homewood, Jul 15, 2022 in NotaLotofPeopleKnowThat


Wildfires have raged, speed restrictions have been imposed on some railway lines and hospitals have already declared ‘critical incidents’.

The hot weather in Britain this summer is set to peak next week, when the mercury could top 39C (102F) in London.

The current non-stop sunshine has evoked memories of the summer of 1976, when there were 15 consecutive days that saw temperatures of 89.6F (32C) somewhere in the UK.

Overall, there were ten weeks of blazing heat that saw widespread drought, mass standpipe use, and even the pausing of the murder trial of the notorious ‘Black Panther’, after a woman suffering from ‘heat exhaustion’ collapsed.

During a First Division football match between Manchester City and Aston Villa, City player collectively lost four stone in weight, prompting the team’s captain to call for an end to ‘summer soccer’.

At that year’s Wimbledon tennis championships, umpires were allowed to remove their jackets for the first time in living memory, whilst major roads were littered with broken-down cars that had overheated.

The extreme weather also caused an increase in the number of 999 callouts to domestic disturbances, as tempers buckled due to the heat.

The summer of 1976 was caused in part by very hot air that had originated in the Mediterranean. The warm weather and lack of rain began on June 23 and did not abate for more than a month.

The highest temperature recorded in the summer was on July 3, when the mercury hit 96.6F (35.9C) in Cheltenham. The average maximum daily temperature was 67.8F (19.9C).

What the media won’t tell you about U.S. heat waves

by R. Pielke Jr, June 16, 2022 in TheHonestBroker


It’s hot. Real hot. Heat waves in the United States surely must be the most visible and impactful sign of human caused climate change, right? Well, actually no. Let’s take a look at what the U.S. National Climate Assessment and the Intergovernmental Panel on Climate Change say about heat waves in the United States. What they say may surprise you.

Before proceeding, let me emphasize that human-caused climate change is real and significant. Aggressive policies focused on both adaptation and mitigation make very good sense. So too does being accurate about current scientific understandings. The importance of climate change does not mean that we can ignore scientific integrity — actually the opposite, it makes it all the more important. So let’s take a close look at recent assessment reports and what they say about U.S. heat waves.

The figure below comes out of the most recent U.S. National Climate Assessment(NCA). It shows the frequency (top) and intensity (bottom) of heat waves in the U.S. since 1900. The bottom figure is actually based on a paper that I co-authored in 1999, which serves as the basis for an official indicator of climate change used by the Environmental Protection Agency.

..

The Truth About Heat Waves

by Jime Steele, July 12, 2021 in WUWT


For those who truly want to be guided by science, put aside the climate crisis hysteria. We can explain the natural dynamics of all heat waves by simply knowing 1) how heat is transported along the earth’s surface; 2) how heat is transported vertically; 3) how solar heating changes; and 4) how the greenhouse effect varies.

Below is a map of global temperature anomalies for the year 2014 that illustrates natural climate dynamics. There is no uniform warming that might be expected from a global blanket of greenhouse gases. Across the globe, surface temperatures alternate between regions of above average warmth (red) with regions of below average (blue). (Gray regions lack sufficient data). Indeed, the observed cooler eastern USA is dubbed a “warming hole” by climate scientists because its cooling trend contradicts global warming theory. It requires a natural climate dynamic explanation.

The temperature pattern is associated with regions where warmer air from the south more frequently intruded northward, while simultaneously, cold air from the north intruded southward. This pattern is due to a naturally wavy jet stream and associated pressure systems. The warm red regions indicate regions where high‑pressure systems dominate. In the northern hemisphere, high pressure systems cause clockwise atmospheric circulation that pulls warm air northward on its western side, and cold air southward on its eastern side.  Low pressure systems circulate counter-clockwise, conversely pulling cold air southward on its western side. These combined circulation patterns partly explain both the extreme cold that dropped Texas temperatures as much as 50° F below average in February 2021, as well as extreme heating that raised USA’s northwest temperatures 30°- 40° F above normal the following June. Similarly in 2019, northward transport of heated air from the Sahara desert caused heat waves over Europe and Greenland. Such natural heat transport can also cause coastal Alaska to be warmer than Florida.

USA Heatwave reality check: Global temps below 30-year avg & ‘75% of the states recorded their hottest temperature prior to 1955’ – Worst U.S. heat waves happened in 1930s

by M. Morano, July 8, 2021 in CO2Coalition


Here we go again! Climate change: US-Canada heatwave ‘virtually impossible’ without warming according to climate model simulations

Model Based Study: Northwest heat wave impossible without climate change: “They logged observations of what happened and fed them into 21 computer models and ran numerous simulations. They then simulated a world without greenhouse gases from the burning of coal, oil and natural gas. The difference between the two scenarios is the climate change portion.”

Climate Depot’s Marc Morano & author of Green Fraud:

“Here we go again. Any heatwave, hurricane, tornado outbreak, etc. are always used by the media and other climate activists as some kind of ‘proof” of a climate emergency.  At least these claims are more plausible than claims that building collapses or illegal immigration are caused by “climate change.”

But currently, the global satellite temperature for June 2021 is below the 30-year average. And despite the U.S. heatwave, there are plenty of record cold outbreaks happening around the globe, (See: Unusually strong cold weather outbreak spreads from Antarctica into central South America, bringing early winter temperature records and first snowfall after decades)

The media gaslights anyone who mocks ‘global warming’ on a record cold or snowy day but has no problem doing the exact same thing whenever it’s hot. As University of Alabama climate scientist John Christy’s research has found: “About 75% of the states recorded their hottest temperature prior to 1955, and over 50 percent of the states experienced their record cold temperatures after 1940.”

In addition, the EPA’s own data has shown that the 1930s U.S. heatwaves were far more severe than current temperatures. (2021 Update: EPA puts inconvenient data on 1930s drought and heat wave down the memory hole)

In short, it is unscientific and nothing short of political lobbying to jump on a heatwave to claim ‘proof’ of man-made global warming. Climate activists’ new motto should be: Never let an opportunity go to waste to blame a heatwave or a flood or hurricane or building collapse or immigration — on ‘climate change.’

Was Global Warming The Cause of the Great Northwest Heatwave? Science Says No.

by C. Rotter, July 6, 2021 in WUWT


Reposted from The Cliff Mass Weather Blog

During the past week, the Pacific Northwest experienced the most severe heat event of the past century.

All-time high-temperature records were broken throughout the region, often by large margins. Many in the media, several local and national politicians, and some activist environmental scientists have claimed that this event was “driven by” or predominantly forced by human-inspired global warming (usually referred to as “climate change”).But such global warming claims are not supported by the facts and our best scientific understanding.  

Truth and Rigorous Science About Climate Change is Necessary for Wise Decisions
In this blog, I will use observations, modeling, climatological data, and the peer-reviewed scientific literature to demonstrate that human-caused global warming played a very small role in the extreme heat event that we just experienced here in the Pacific Northwest.I will describe the origins of a meteorological black swan eventand how the atmosphere is capable of attaining extreme, unusual conditions without any aid from our species.As you read this, consider that I have actively pursued research on Northwest heatwaves, published several papers in the peer-reviewed literature on this specific topic, and have run both weather prediction and climate models that simulate such events.  This subject is in my wheelhouse.

I also discuss the seriousness of misinformation.   You and others can not make wise decisions when the information provided to you is not based on truth and science.

Heatwave Reporting Shows How Science Has Been Corrupted By Climate Groupthinktch

by A. Watts, July 1, 2021 in ClimateChangeDispatch


The headline in E&E News, WOWT-TV, Scientific American, WorldNewsNetwork, and other media outlets this week, “Unprecedented Heat Wave in Pacific Northwest Driven by Climate Change” couldn’t possibly be more unscientific.

With absolutely no analysis, no historical context, and nothing but conjecture, author Anne. C. Mulkern eschewed science for advocacy in her reporting of the brief Pacific Northwest (PNW) heatwave this week.

Yes, the heatwave set all-time high-temperature records in Washington, Oregon, and Canada. But consider this: At best, we have about 150 years of reliable weather records for the PNW, so a “black swan” outlier eventlike this isn’t surprising.

It’s happened before, most certainly. We just weren’t around to observe it. After all, Native Americans did not keep written weather records.

High- (and low-) temperature records are nothing new. But it is important to look at the past because data shows us that more high-temperature records were set during the first half of the twentieth century than during the past 50 years.

Even the Environmental Protection Agency (EPA) confirms this.

Climate Change, Lies And The Lancet

by P. Homewood, January 7, 2020 in ClimateChangeDispatch


The Lancet has published its latest annual report on health and climate change, which inevitably orders us to stop using fossil fuels or the kids will get it!

It is the usual load of overhyped rubbish of the sort we have seen in previous years.

The executive summary contains a number of questionable claims and statements which seriously undermine the report’s integrity and reliability.

For a start, it claims that ‘a child born today will experience a world that is more than four degrees warmer than the pre-industrial average.’

Really? A temperature rise of three degrees in 50 years or so? Even the highly discredited climate models don’t regard this as realistic. For the Lancet to state this as a bald-faced fact calls into question the objectivity of its contents.

It then proceeds to list all sorts of ways in which health is already being impacted by climate change, including disease transmission, air pollution, extreme weather (which apparently will affect women more – yes, that’s got me and all!), wildfires, heatwaves and goodness knows what else.

Yet, tucked away in Figure 5 is the dirty little secret that mortality rates from climate-related causes have been plummeting since 1990.