
by J. Vinos, Dec 31, 2025 in Clintel
We have been fortunate to witness the largest climate event to occur on the planet since the advent of global satellite records, and possibly the largest event since the eruption of Mount Tambora in 1815. It is clearly a naturally occurring, externally forced climate event. However, mainstream climate scientists are not treating it appropriately. This is because climate science does not function like other sciences and is subject to strong confirmation bias. The first step to learning from the 2023 event is accepting its exceptional nature, which many fail to do.
- An externally forced extraordinary event
If you are still not convinced of the extremely anomalous nature of the climatic event of 2023, let’s review some of the events of 2023-24. Taken together, they make it clear. The following list is incomplete and comes from my notes:
- Extraordinary ocean warming that models can’t explain. [1]
- Record-low Antarctic sea ice. [2]
- A record-breaking Amazon drought in 2023. [3]
- 31 atmospheric river events in the western US from November 2022 to March 2023. Nine made landfall in California marking the record in the 70-year database. [4]
- The snowiest season in 71 years occurred in California after a 1-in-54-year event. [5]
- NYC had the least snowy season on record, breaking a 50-year record on latest first snow. [6]
- Cyclone Freddy in the Indian Ocean was the longest-lasting tropical cyclone ever. [7]
- ITCZ displacement and unusual rains in the Sahara in 2024. [8]
- The first half of the 2024 hurricane season was surprisingly quiet, and models can’t explain it. [9]
- In 2023, 42% of the globe experienced heat exceeding two standard deviations. Louisiana, for example, had its hottest summer in 129 years of records. [10]
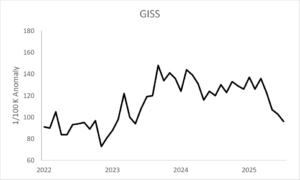
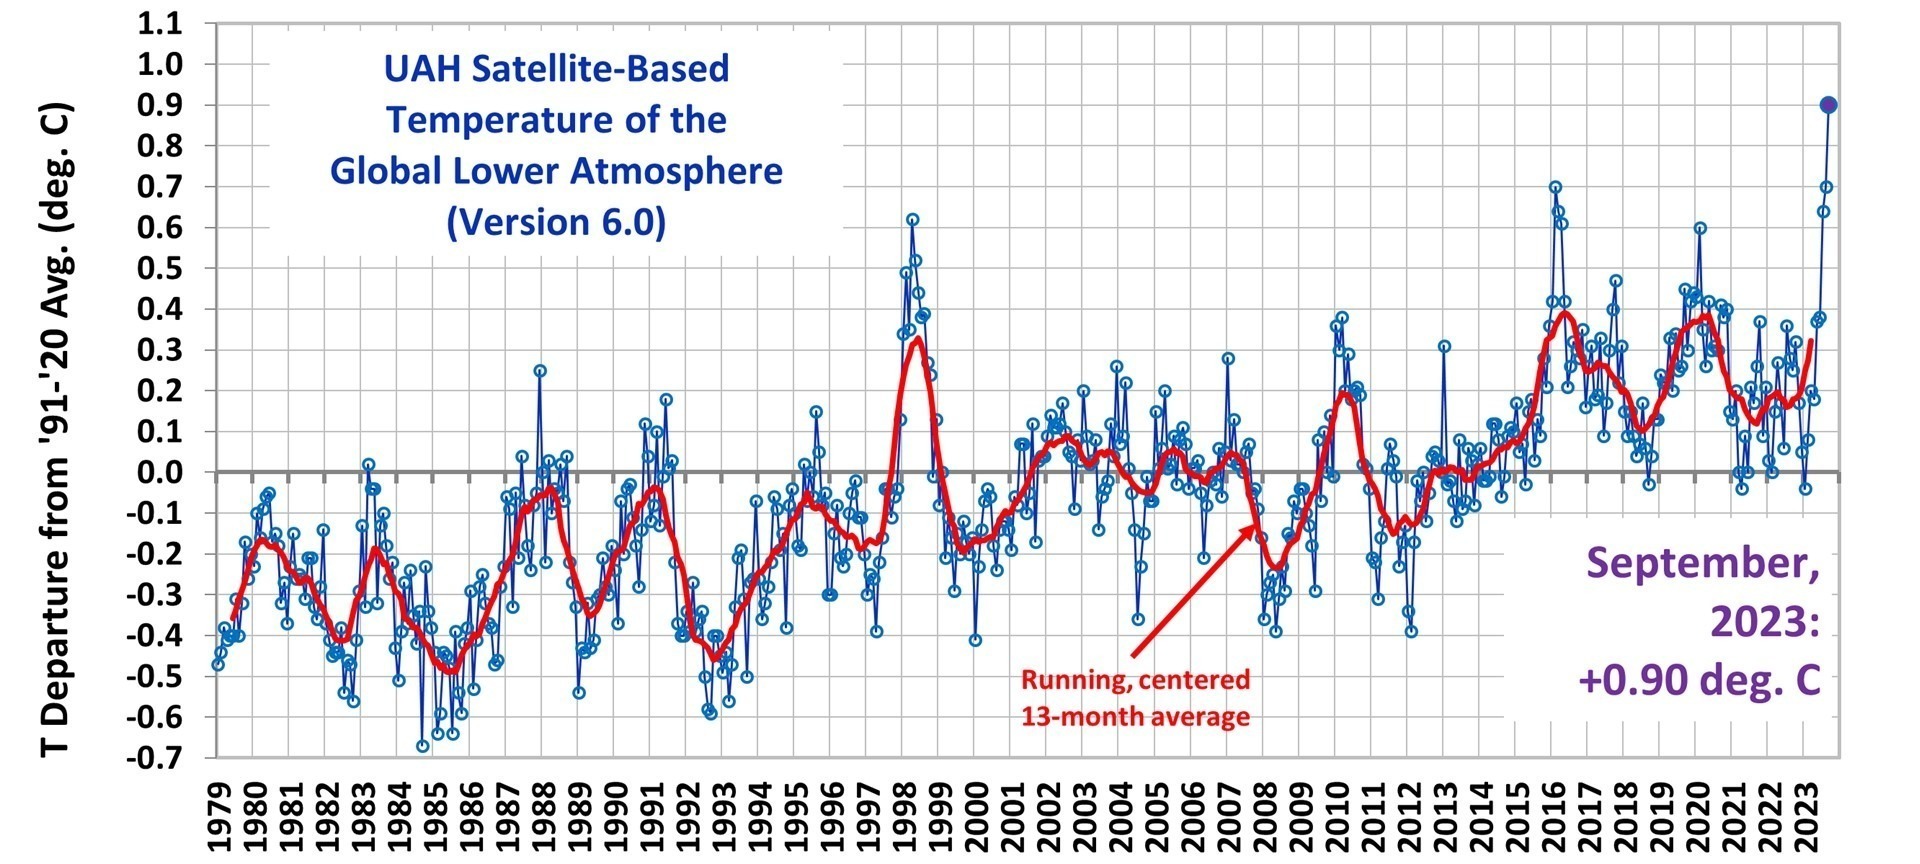
- 2023 was the warmest year on record, and 2024 was even warmer.
- In October 2024, the North Polar Vortex was the weakest in 40 years. The three sudden stratospheric warming events that occurred in the same season are a one-in-250-year event according to models. [11]
- The biggest global low cloud cover anomaly ever recorded occurred in 2023. [12]
…
…


