by P. Homewood, October 10, 2018 in NotaLotofPeopleKnowThat
Contrary to recent press reports that the oceans hold the still-undetected global atmospheric warming predicted by climate models, ocean warming occurs in 100-year cycles, independent of both radiative and human influences.
At a press conference in Washington, D.C., on March 24, 2000, Dr. James Baker, Administrator of the U.S. National Oceanic and Atmospheric Administration (NOAA), announced that since the late 1940s, there “has been warming to a depth of nearly 10,000 feet in the Atlantic, Pacific, and Indian Oceans.” “In each ocean basin, substantial temperature changes are occurring at much deeper depths than we previously thought,” Dr. Baker said, as indicated by research conducted at NOAA’s Ocean Climate Laboratory. He was referring to a paper published in Science magazine that day, prepared by Sydney Levitus, John Antonov, Timothy Boyer, and Cathy Stephens, of the NOAA Center.
For 15 years, modellers have tried to explain their lack of success in predicting global warming. The climate models had predicted a global temperature increase of 1.5°C by the year 2000, six times more than that which has taken place. Not discouraged, the modellers argue that the heat generated by their claimed “greenhouse warming effect” is being stored in the deep oceans, and that it will eventually come back to haunt us. They’ve needed such a boost to prop up the man-induced greenhouse warming theory, but have had no observational evidence to support it. The Levitus, et al. article is now cited as the needed support.
Silica is needed by a group of marine algae (the microscopic plants of the oceans) called diatoms, who use it to build their glassy cell walls (known as frustules).
These plankton take up globally significant amounts of carbon — they remove carbon dioxide from the atmosphere via photosynthesis, and act as a natural carbon sink when they die and fall to the bottom of the ocean — and form the base of the marine food chain.
…
The researchers are also planning to use more complex and realistic computer models to delve deeper into the potential changes in the global silica cycle since the last glacial maximum. These might include more accurate representations of ocean currents, recycling of silica in the water column, and potential changes to the marine algal community.
But while Scripps is trying to tie the record-high ocean reading to the broader wave of media coverage on global heat waves, there are a few caveats to note about what the scientists found.
First, these measurements are taken from a pier that’s near the shoreline, which would not necessarily make it representative of the entire Pacific Ocean, and therefore easily influenced by local weather events.
The “anomalously warm temperatures for the past week” that Scripps researchers observed at their pier somewhat mirror the temperature pattern in 1931, and indeed, the daily records broken in the past week have been very close to readings from 87 years ago.
There is an upward trend in temperature readings from Scripps’ pier, but the trend seems to also broadly coincide with the flipping of a natural ocean cycle, the Pacific Decadal Oscillation, to its warm phase. That flip occurred around 1976.
The temperature of the last 100 years was also the topic of a new publication by Folland et al. 2018. The authors are very much at home in the camp of the IPCC and had to admit that there have been phases of cooling, stagnating or even slow warming: 1896 – 1910, 1941 – 1975, and 1998 – 2013.
Climate models struggle with this because CO2 is climbing steadily. So why does climate warming stall under these conditions? Folland and his colleagues examined the models and are convinced that despite the small problems, the models function perfectly well and thus no other climate factors need to be accounted for.
In 1940s it was a bit too warm and the models were unable to reproduce this. Given, the authors say. Greenhouse gases have been responsible for almost all the warming of the last 125 years.
…
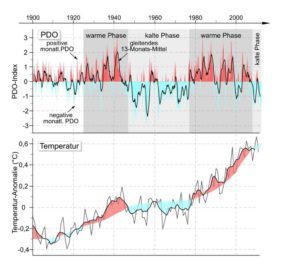
Now isn’t it a bit odd that the authors made absolutely no mention of the ocean cycles in the abstract? As our regular readers know, the ocean cycles run surprisingly synchronous with the fluctuations in global temperatures, i.e. the key factors here are the AMO and PDO.
PDO ocean cycle and its fluctuations in the global temperature development. Source: Book ‘Die kalte Sonne‘.
Deep in the ocean’s twilight zone, swarms of ravenous single-celled organisms may be altering Earth’s carbon cycle in ways scientists never expected, according to a new study from Florida State University researchers.
In the area 100 to 1,000 meters below the ocean’s surface — dubbed the twilight zone because of its largely impenetrable darkness — scientists found that tiny organisms called phaeodarians are consuming sinking, carbon-rich particles before they settle on the seabed, where they would otherwise be stored and sequestered from the atmosphere for millennia.
This discovery, researchers suggest, could indicate the need for a re-evaluation of how carbon circulates throughout the ocean, and a new appraisal of the role these microorganisms might play in Earth’s shifting climate.
The findings were published in the journal Limnology and Oceanography.
Sometimes a chance comment sets off a whole chain of investigation. Somewhere recently, in passing I noted the idea of the slope of the temperature gradient across the Pacific along the Equator. So I decided to take a look at it. Here is the area that I examined.
…
I’ve written about this temperature gradient before, in a post called The Tao of El Nino. If you take time to read that post, this one will make more sense. …
Hurricane threat to East Coast due to natural factors
First at his most recent Saturday Summary, the 40-year meteorologist first warns that in-close developing hurricanes of the sort seen in the 1930s are a risk to the US East Coast this year, due the current Atlantic temperature pattern. The reason has nothing to do with CO2 in the atmosphere, but because of natural sea surface temperature cycles.
Sea surface temperatures see “pretty dramatic turnaround”
A University of Aizu team has identified two distinct Indo-Pacific processes shaping the unique features and extraordinary ferocity of super El Ninos. A systematic analysis of these processes and their interactions will improve forecasts of the elusive super El Ninos, the researchers claim.
…
Extremely warm sea surface temperatures are a notable feature of the super El Ninos that occurred in 1972, 1982, and 1997. The fact that Pacific Ocean processes responsible for generating regular El Ninos could not explain this key signature of super El Ninos came as a big shock,” says Dachao Jin, co-author of the study.
How have we measured the temperature of the ocean’s upper layer in the last 150 years? How does understanding physical processes and observational errors help to standardise climate data and understand climate change?
Sea surface temperature (SST) is also one of the climate indices with the longest histories of direct measurements. Because ocean makes up about 70% of the total Earth’s surface, changes in the temperature of its surface are a key factor for determining the global temperature of the planet’s surface.
* Most of the plastic waste comes from just a few countries, mostly in Asia and Africa.
* 25% is “leakage” from Asian waste management processes — the rest is waste that has never been collected, but is simply thrown into rivers.
* But European countries ship inject huge quantities of waste into Asian waste management streams, ostensibly for recycling. As much as 20% — millions of tons every year — ends up in the oceans and will continue to do so.
* Since the Chinese banned waste imports at the start of the year, shipments have been diverted to other Asian countries with even weaker environmental controls (Figure 1).
* EU recycling is therefore a major contributor to marine waste and increasing recycling will therefore simply increase marine litter.
Some of the earliest complex organisms on Earth — possibly some of the earliest animals to exist — got big not to compete for food, but to spread their offspring as far as possible.
The research, led by the University of Cambridge, found that the most successful organisms living in the oceans more than half a billion years ago were the ones that were able to ‘throw’ their offspring the farthest, thereby colonising their surroundings. The results are reported in the journal Nature Ecology and Evolution.
Prior to the Ediacaran period, between 635 and 541 million years ago, life forms were microscopic in size, but during the Ediacaran, large, complex organisms first appeared, some of which — such as a type of organism known as rangeomorphs — grew as tall as two metres.
Now it matters to do a better job understanding the ocean,” Resplandy said. “Our main point is that carbon gets re-distributed because it was wrongly allocated. A lot of people had different pieces, but all the pieces weren’t quite fitting together.”
Global climate change, fueled by skyrocketing levels of atmospheric carbon dioxide, is siphoning oxygen from today’s oceans at an alarming pace — so fast that scientists aren’t entirely sure how the planet will respond.
(…)
Millions of years ago, scientists discovered, powerful volcanoes pumped Earth’s atmosphere full of carbon dioxide, draining the oceans of oxygen and driving a mass extinction of marine organisms.
We have mentioned countless times on this blog that the warming oceans are evidence that CO2 is not the cause of global warming. To understand the climate you must first understand the oceans. The oceans control the global climate. As the oceans warm, they warm and alter the humidity of the atmosphere above them. The problem is, as we have pointed out countless times, CO2’s only defined mechanism by which to affect climate change is through the thermalization of LWIR between 13 and 18µ.
LWIR between 13 and 18µ doesn’t penetrate or warm the oceans. Visible radiation, mainly from the high energy blue end of the spectrum does. CO2 is transparent to incoming visible radiation. The energy stored in the atmosphere and land is insignificant when compared to the oceans. The oceans contain 2,000x the energy of the atmosphere, so small changes to the oceans can mean big changes in the atmospheric temperature. The oceans also produce vast amounts of CO2 (20 x the amount man produces), and the most abundant and potent greenhouse gas, water vapor.
Presently sea surface temperatures (SST) are the best available indicator of heat content gained or lost from earth’s climate system. Enthalpy is the thermodynamic term for total heat content in a system, and humidity differences in air parcels affect enthalpy. Measuring water temperature directly avoids distorted impressions from air measurements. In addition, ocean covers 71% of the planet surface and thus dominates surface temperature estimates. Eventually we will likely have reliable means of recording water temperatures at depth.
Recently, Dr. Ole Humlum reported from his research that air temperatures lag 2-3 months behind changes in SST. He also observed that changes in CO2 atmospheric concentrations lag behind SST by 11-12 months. This latter point is addressed in a previous post Who to Blame for Rising CO2?
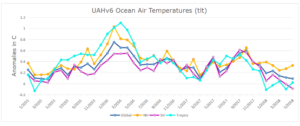
The May update to HadSST3 will appear later this month, but in the meantime we can look at lower troposphere temperatures (TLT) from UAHv6 which are already posted for May. The temperature record is derived from microwave sounding units (MSU) on board satellites like the one pictured above… (…)
The research, published in Science Advances, suggests that early animals diversified within a climate similar to that in which the dinosaurs lived.
This interval in time is known for the ‘Cambrian explosion’, the time during which representatives of most of the major animal groups first appear in the fossil record. These include the first animals to produce shells, and it is these shelly fossils that the scientists used.
Data from the tiny fossil shells, and data from new climate model runs, show that high latitude (~65 °S) sea temperatures were in excess of 20 °C. This seems very hot, but it is similar to more recent, better understood, greenhouse climates like that of the Late Cretaceous Period.
Years ago, Dr. Roger Pielke Sr. explained why sea surface temperatures (SST) were the best indicator of heat content gained or lost from earth’s climate system. Enthalpy is the thermodynamic term for total heat content in a system, and humidity differences in air parcels affect enthalpy. Measuring water temperature directly avoids distorted impressions from air measurements. In addition, ocean covers 71% of the planet surface and thus dominates surface temperature estimates.
More recently, Dr. Ole Humlum reported from his research that air temperatures lag 2-3 months behind changes in SST. He also observed that changes in CO2 atmospheric concentrations lag behind SST by 11-12 months. This latter point is addressed in a previous post Who to Blame for Rising CO2?
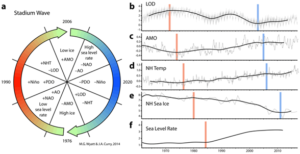
It is a well-known feature of climate change that since 1850 multiple climate datasets present a ~ 60-year oscillation. I recently wrote about it in the 7th chapter of my Nature Unbound series. This oscillation is present in the Atlantic Multidecadal Oscillation (AMO), Arctic Oscillation (AO), North Atlantic Oscillation (NAO), Pacific Decadal Oscillation (PDO), Length of Day (LOD), and Global (GST) and Northern Hemisphere (NHT) temperatures, with different lags.
To me this oscillation is not a cycle because prior to 1850 it had a more variable period and it is not well identified in LIA records. Since the origin of this oscillation is unknown, models have a hard time reproducing it and it is all but ignored by the IPCC. It is a big oscillation with an amplitude of ± 0.3 °C in NHT (0.1-0.2°C in GST; figure 2). While the long-term temperature trend is unaffected by it, there is a large effect on the 30-year trends. If this oscillation is considered, most of the climate alarmism vaporizes.
Yesterday’s “The Day After Tomorrow” climate explainer’s excuse for cold winters is back – research suggests that the North Atlantic current is weaker than anytime for the last 1000 years (…)
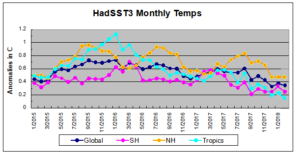
The best context for understanding decadal temperature changes comes from the world’s sea surface temperatures (SST), for several reasons:
The ocean covers 71% of the globe and drives average temperatures;
SSTs have a constant water content, (unlike air temperatures), so give a better reading of heat content variations;
A major El Nino was the dominant climate feature in recent years.
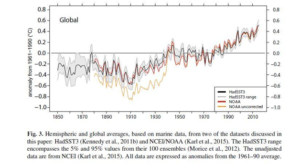
HadSST is generally regarded as the best of the global SST data sets, and so the temperature story here comes from that source, the latest version being HadSST3. More on what distinguishes HadSST3 from other SST products at the end.
by Tony Heller, March 27, 2018 in CimateChangeDispatch
…
The key to understanding this can be found in the 2004 Smithsonian article. The Tuvalu story (like everything else with global warming) has always been about left-wing politics and money, not science.
But not all scientists agree that Tuvalu’s future is underwater. Some critics have branded island leaders as opportunists angling for foreign handouts and special recognition for would-be “environmental refugees” who, they say, are exploiting the crisis to gain entry to New Zealand and Australia. Others have even said that people and organizations sympathetic to Tuvalu are “eco-imperialists” intent on imposing their alarmist environmental views on the rest of the world.
And of course the same fake story in the Maldives, which were supposed to be underwater by 2018.
Firstly let me say that I am not one of the most technical writers you will see here. I regard myself pretty much as a layman despite studying Geology, Mathematics and Computer Science at University.
So you won’t find all the references to papers (well not many), nor exact scientific formulae. I simply write what I have logically deduced. For any who disagree, or have value to add, please use the Comments below.
There is a new way to measure the average temperature of the ocean thanks to researchers at Scripps Institution of Oceanography at the University of California San Diego. In an article published in the Jan. 4, 2018, issue of the journal Nature, geoscientist Jeff Severinghaus and colleagues at Scripps Oceanography and institutions in Switzerland and Japan detailed their ground-breaking approach.
The 2014-2017 El Nino “warm blob” was likely created, maintained, and partially recharged on two separate occasions by massive pulses of super-heated and chemically charged seawater from deep-sea geological features in the western North Pacific Ocean. This strongly supports the theory all El Ninos are naturally occurring and geological in origin. Climate change / global warming had nothing to do with generating, rewarming, intensifying, or increasing the frequency of the 2014-2017 El Nino or any previous El Nino.
If proven correct, this would revolutionize climatology and key aspects of many interrelated sciences such as oceanography, marine biology, glaciology, biogeochemistry, and most importantly meteorology. Information supporting a geological origin of El Ninos is diverse, reliable, and can be placed into five general categories as follows: (…)
Contrary to expectations, climate scientists continue to report that large regions of the Earth have not been warming in recent decades.
According to Dieng et al. (2017), for example, the global oceans underwent a slowdown, a pause, or even a slight cooling trend during 2003 to 2013. This undermines expectations from climate models which presume the increase in radiative forcing from human CO2 emissions should substantially increase ocean temperatures.
The authors indicate that the recent trends in ocean temperatures “may just reflect a 60-year natural cycle“, the AMO (Atlantic Multidecadal Oscillation), and not follow radiative forcing trends.
La géologie, une science plus que passionnante … et diverse