Archives par mot-clé : ENSO

Are ENSO Regime Changes Connected To Major Climate Shifts? Are We Tipping To Cooling?

by P. Gosselin, Apr 19, 2023 in NoTricksZone


We’ve had a La Niña for nearly three years. But now it has officially ended, and ENSO has moved into its neutral phase, the “La Nada”.[1] The La Niña event lasted three winters in a row, something that has only occurred twice before in modern times: 1973–1976 and 1998–2001. Both of these followed in response to a very strong El Niño.

The La Niña that has now ended, on the other hand, came after the more neutral winter of 2019/20.

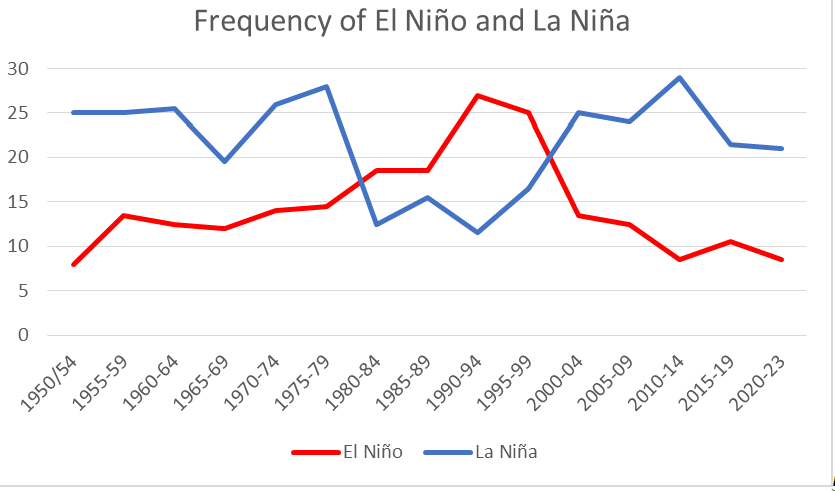
Figure 1. Number of months with each ENSO phase for five-year periods from 1950 – 2023

The number of months that we have had each ENSO phase in the last 74 years is shown in Figure 1. The La Niñas are more frequent than the El Niños. Interestingly, the opposite was true during the rapid warming we had from 1975 – 1999, when El Niños were more common. But then it reverts back again around 1998/99. Is there a pattern here?

It is established in climate science that the climate underwent a profound shift in 1976/77, related to the ocean currents.[2] In IPCC AR4, they write: “The 1976–1977 climate shift in the Pacific, associated with a phase change in the PDO from negative to positive, was associated with significant changes in ENSO evolution.” The Pacific Decadal Oscillation (PDO) shifted from a ‘cold’ to a ‘warm’ phase during these two years.[3] The ENSO also became dominated by the El Niño phase, which is characterized by warmer temperatures.[4] These changes affected the global climate, and a rapid warming began.

But what happened in the years just before 2000? As seen in Figure 1, ENSO reverts to being dominated by the ‘colder’ La Niña at that time.

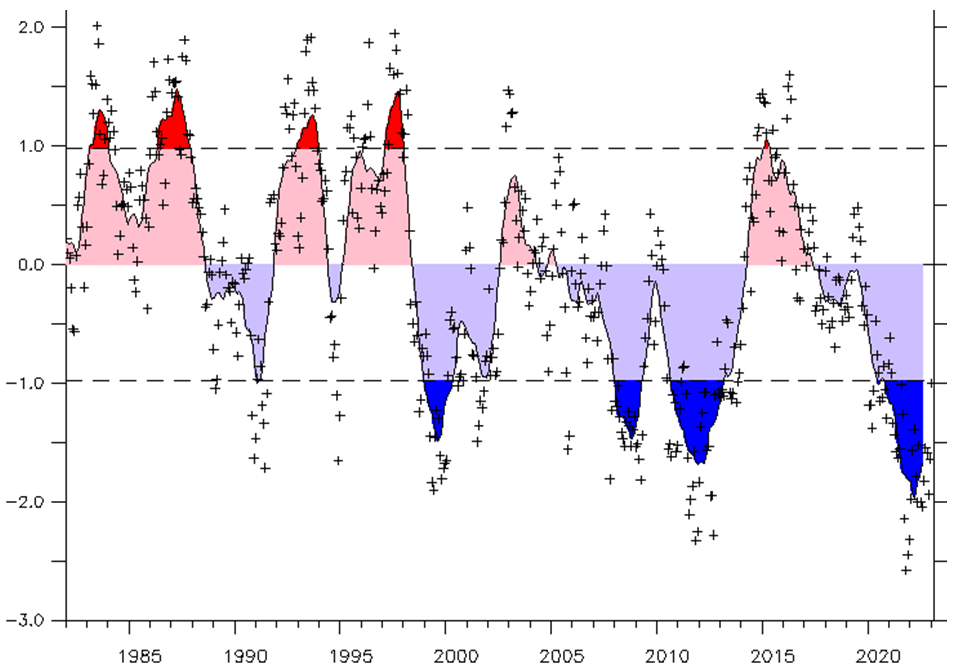
Figure 2. The PDO index according to NOAA/ESRL.

Interestingly, the PDO also reverts to its cold phase in 1998–1999.

Are we seeing a shift to a colder phase in the climate here?

Scientists Warn of a Rare Third Year La Nina

by INSTITUTE OF ATMOSPHERIC PHYSICS, CHINESE ACADEMY OF SCIENCES,  Oct 21, 2022 in WUWT


El Niño–Southern Oscillation (ENSO) is an irregular periodic variation in winds and sea surface temperatures over the tropical eastern Pacific Ocean that affects the climate of much of the tropics and subtropics. This natural phenomenon is important to study because of the socioeconomic impacts it can have on matters such as food security, agricultural production, human health and water resources, to name but a few.

With its strong preference to peak during boreal winter and rapidly decay in spring (known as “phase-locking”), and quasi-periodic oscillations of 2–7 years, historically, ENSO rarely maintains for long in either its cold phase (La Niña) or warm phase (El Niño). However, since the turn of the current century, three instances of so-called “double dip” La Niña events have occurred, in 2007–09, 2010–12 and 2020–22.

This succession of double-dip La Niña events is intriguing enough in itself; but now, based on updated data from several organizations issued in April 2022, it seems that the current event is likely to continue through the boreal summer and fall of 2022, suggesting a strong possibility of a third-year La Niña lasting from 202023.

“This would be the first third-year La Niña since the 1998–2001 event, which was the only such event observed since 1980,” explains Dr Xianghui Fang from Fudan University, China.

See also : Alarmist Scientist Tim Flannery’s Drought Prediction Contradicted… “Heavy Rainfalls” 3 Years In a Row

ENSO Impact on the Declining CO2 Sink Rate

by Roy Spencer, Aug 15, 2022 in WUWT


From Dr. Roy Spencer’s Global Warming Blog

Roy W. Spencer, Ph. D.

SUMMARY: A simple time-dependent CO2 budget model shows that yearly anthropogenic emissions compared to Mauna Loa CO2 measurements gives a declining CO2 sink rate, which if continued would increase atmospheric CO2 concentrations and presumably anthropogenic climate change. But accounting for ENSO (El Nino/La Nina) activity during 1959-2021 removes the decline. This is contrary to multiple previous studies that claimed to account for ENSO. A preprint of my paper (not yet peer reviewed) describing the details is at ENSO Impact on the Declining CO2 Sink Rate | Earth and Space Science Open Archive (essoar.org).

UPDATE: The CO2 model, with inputs and outputs, is in an Excel spreadsheet here: CO2-budget-model-with-EIA-growth-cases.

I decided that the CO2 model I developed a few years ago, and recently reported on here, was worthy of publication, so I started going through the published literature on the subject. This is a necessary first step if you want to publish a paper and not be embarrassed by reinventing the wheel or claiming something others have already “disproved”.

The first thing I found was that my idea that Nature each year removes a set fraction of the difference between the observed CO2 concentration and some baseline value is not new. That idea was first published in 2013 (see my preprint link above for details), and it’s called the “CO2 sink rate”.

The second thing I found was that the sink rate has (reportedly) been declining, by as much as 0.54% (relative) per year, even after accounting for ENSO activity. But I only get -0.33% per year (1959-2021) before accounting for ENSO activity, and — importantly — 0.0% per year after accounting for ENSO.

This last finding will surely be controversial, because it could mean CO2 in the atmosphere will not rise as much as global carbon cycle modelers say it will. So, I am posting the model and the datasets used along with the paper preprint at ENSO Impact on the Declining CO2 Sink Rate | Earth and Space Science Open Archive (essoar.org). The analysis is quite simple and I believe defensible. The 2019 paper that got -0.54% per year decline in the sink rate uses complex statistical gymnastics, with a professional statistician as a primary author. My analysis is much simpler, easier to understand, and (I believe) at least as defensible.

The paper will be submitted to Geophysical Research Letters for peer review in the next couple days. In the meantime, I will be inviting the researchers who live and breathe this stuff to poke holes in my analysis.

2019 Atlantic hurricane forecast

by J. Curry and J. Johnstone, June4, 2019 in ClimateEtc.


CFAN predicts an active North Atlantic hurricane season season.

The Atlantic hurricane has begun.  We are off to an early start with one wimpy subtropical storm that lasted less than a day, and a small system that is trying to spin up in the Bay of Campeche.

Other forecast providers have begun issuing forecasts:

  • NOAA predicts a near normal season with 4-8 hurricanes.
  • Tropical Storm Risk predicts slightly below normal activity, with 6 hurricanes and ACE of 88.
  • Colorado State University predicts near normal season:  6 hurricanes and ACE of 100

Climate Forecast Applications Network (CFAN) is going bold, see below. [link] to forecast report.

CFAN’s seasonal forecast

Table 1. Current (May) 2019 hurricane forecasts of North Atlantic ACE, North Atlantic total hurricanes, U.S. landfalling hurricanes. 

….

Scientists Find No Human Impact On Extreme Rainfall Events In Southeastern Australia…Rather ENSO Related

by P. Gosselin, May 21, 2019 in NoTricksZone


A new study appearing in the Journal of Weather and Climate Extremes titled “Historical extreme rainfall events in southeastern Australia” – led by LindenAshcroft, School of Earth Sciences, University of Melbourne – shows that even more extreme weather in terms of rainfall existed before 1900 in Melbourne, Sydney and Adelaide.

No real trend when examining Sydney, Australia data going back 178 years. Image: Ashcroft et al 2019.

Moreover, the authors found a “moderate and relatively stable relationship between El Niño–Southern Oscillation (ENSO) and annual variations of total rainfall and the number of raindays.”