Archives par mot-clé : Temperature

Autocorrelation in CO2 and Temperature Time Series

by A. May, Nov 14, 2021 in WUWT


In my last post I plotted the NASA CO2 and the HadCRUT5 records from 1850 to 2020 and compared them. This was in response to a plot posted on twitter by Robert Rohde implying they correlated well. The two records appear to correlate because the resulting R2 is 0.87. The least square’s function used made the global temperature anomaly a function of the logarithm to the base 2 of the CO2 concentration (or ‘log2CO2‘). This means the temperature change was assumed to be linear with the doubling of the CO2concentration, a common assumption. The least squares (or ‘LS’) methodology assumes there is no error in the measurements of the CO2 concentration and all error resulting from the correlation (the residuals) resides in the HadCRUT5 global average surface temperature estimates.

In the comments to the previous post, it became clear that some readers understood the computed R2(often called the coefficient of determination), from LS, was artificially inflated because both X (log2CO2) and Y (HadCRUT5) were autocorrelated and increased with time. But a few did not understand this vital point. As most investors, engineers, and geoscientists know, two time series that are both autocorrelated and increase with time will almost always have an inflated R2. This is one type of “spurious correlation.” In other words, the high R2 does not necessarily mean the variables are related to one another. Autocorrelation is a big deal in time series analysis and in climate science, but too frequently ignored. To judge any correlation between CO2 and HadCRUT5 we must look for autocorrelation effects. The most tool used is the Durbin-Watson statistic.

The Durbin-Watson statistic tests the null hypothesis that the residuals from a LS regression are not autocorrelated against the alternative that they are. The statistic is a number between 0 and 4, a value of 2 indicates non-autocorrelation and a value < 2 suggests positive autocorrelation and a value >2 suggests negative autocorrelation. Since the computation of R2 assumes that each observation is independent of the others, we hope that we get a value of 2, that way the R2 is valid. If the regression residuals are autocorrelated and not random—that is normally distributed about the mean—the R2 is invalid and too high. In the statistical program R, this is done—using a linear fit—with only one statement, as shown below:

CO2 and Temperature

by A. May, Nov 9, 2021 in WUWT


I had a very interesting online discussion about CO2 and temperature with Tinus Pulles, a retired Dutch environmental scientist. To read the whole discussion, go to the comments at the end of this post. He presented me with a graphic from Dr. Robert Rohde from twitter that you can find here. It is also plotted below, as Figure 1.

Conclusion

I’m not impressed with Rohde’s display. The coefficient of correlation is decent, but it does not show that warming is controlled by changes in CO2, the temperature reversals are not explained. The reversals strongly suggest that natural forces are playing a significant role in the warming and can reverse the influence of CO2. The plots show that, at most, CO2 explains about 50% of the warming, something else, like solar changes, must be causing the reversals. If they can reverse the CO2-based warming and overwhelm the influence of CO2 they are just as strong.

The climate moaners need to get some perspective from history

by Ian Plimmer, Nov 4, 2021, SpectatorAustralia


Greta Thunberg rejects all ideas of the enlightenment. Despite what she wails, she is now living in the best times ever to be a child on planet Earth. She can actually go to FLOP26, something that few of us would want to do. Would she prefer to live in the worst of times when there was panic, suffering, environmental damage, death and no hope which she claims exists today?  

We now eat better, are less affected by natural disasters and are able to cope with extremes of weather and climate. During the last 4 of at least 20,000 generations of humans, child mortality has decreased and global human longevity increased from 25 to 79 years. The climate moaners need to get some perspective from history. 

The worst years to live since the time of Jesus were 535-550 AD because massive volcanic eruptions, perhaps Kamchatka or Alaska in 535-536 AD and Ilopango in El Salvador from 539-540 AD. The Northern Hemisphere atmosphere with filled with dust and acid sulphate clouds. These volcanic eruptions were coincidental with extraterrestrial impacts in March 536 AD in the Gulf of Carpentaria and elsewhere in August 536 AD. To make matters worse, these were at the time of a Solar Minimum. 

The Sun was dimmed for 18 months, a white sulphuric acid aerosol cloud enveloped Europe, global temperature dropped by 1.5 to 2.5°C producing worldwide crop failures and death by starvation. There was migration (e.g. Slavic speaking people), political turmoil and the collapse of empires (e.g. Sasanian Empire in Persia). Tree rings show almost no growth for a few years.  


Continuer la lecture de The climate moaners need to get some perspective from history

Aussie Met Bureau – making up 13 years of missing temperature data

by D. Mason-Jones, Oct 15, 2021 in WUWT


Upon finding a 13-year gap in its data for an important weather station in Queensland, the Australian Bureau of Meteorology homogenised data from 10 other locations to fill-in the missing years. One of these places was more than 400km away and another almost 2.5 degrees of latitude further South.

Is the resulting data credible? No, is the conclusion reached in a research Report by Australian scientist, Dr. Bill Johnston.

When the US Army Air Force (USAAF) closed its heavy bomber transit base at Charleville at the end of the Second World War the aerodrome reverted to civilian status. The base had been a link in the ferry route delivering aircraft from factories in the US to the war zone.


AR6 and The Paleocene-Eocene Thermal Maximum

by Andy May, Aug 18, 2021 in WUWT


The PETM or Paleocene-Eocene Thermal Maximum was a warm period that began between 56.3 and 55.9 Ma (million years ago). The IPCC AR6 report (actually a draft, not a final edited report), released to the public on August 9, 2021, suggests that this warm period is similar to what is happening today and they expect to happen in the future (IPCC, 2021, pp. 2-82 & 5-14). During the PETM, it was very warm and average global surface temperatures probably peaked between 25.5°C and 26°C briefly, compared to a global surface temperature average of about 14.5°C today, as shown in Figure 1.

….


oday we have tens of thousands of daily temperature measurements around the world and can calculate a fairly accurate global average surface temperature. To construct a global average for the PETM we must rely on proxy temperatures, such as oxygen isotope ratios, Calcium/Magnesium ratios in fossil shells, and fossil membrane lipids that are sensitive to temperature like Tex86. Proxy temperature values are sparsely located and have a temporal resolution, 56 Ma, of thousands to hundreds of thousands of years. Thus, in terms of rate of temperature change, they are not comparable to today’s monthly global averages.

Before diving into the PETM, we will provide some geological perspective. According to Christopher Scotese, the highest global average temperature in the Phanerozoic (the age of complex shelled organisms, or the past 550 million years) was the Triassic hothouse event, following the end of the Karoo Ice Age, around 250-300 Ma. Global average surface temperatures peaked then at about 27.9°C.

 …

Is The Earth Actually Getting Hotter?

by V. Jayaraj, Aug 2, 2021 in ClimateChangeDispatch


Every year, climate-change enthusiasts tell us the earth is getting hotter. Phys.org warned the world, “New ‘hottest year on record’ likely to occur in the next five years.”

C2ES informed readers, “It’s certain: The Earth is getting warmer, and human activity is largely to blame.” Bulletin of the Atomic Scientists’ headline read, “Broken record: The planet is getting hotter. And hotter. And hotter.”

But are we really observing record hot years consecutively?

While global warming is real and has been happening since the end of the Little Ice Age in the 18th century, the claims surrounding unprecedented temperatures are, at best, highly dubious.

Reality and some climate change claims differ as much as day and night. Here are two examples.

Strange Things: Readjusted Data Points

A few official agencies across the globe are widely considered “leaders” or “authoritative” in disseminating climate data.

Among them is the Met Office in the UK and top U.S. state agencies like the National Oceanic and Atmospheric Administration (NOAA) and the National Aeronautics and Space Administration (NASA).

However, these agencies have used their near-invincible status to adjust climate data points as they please, often resulting in an exaggerated warming trend.

NASA has been found to have adjusted past temperature data downward to make the present temperature levels look comparatively warmer.

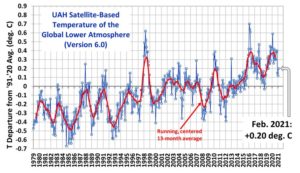
In July 2021, geologist Roger Higgs demonstrated how NASA lowered the 2016 data point for annual global mean temperature.

NASA carried out the supposed downward shifting of data points so that the temperature levels for 2020 (which were about the same as 2016) would now appear more extreme. Higgs revealed the downward shifting on Researchgate.

Why did NASA adjust the 2016 data point to make it appear that 2020 beat it by a larger margin than originally appeared? You decide.

Growth of Glaciers: Greenland Registers Historic Increase in Surface Mass Balance for July 2021

Greenland ice has been a topic of discussion ever since climate change became a headline item in news circles. The reduction of ice mass is often projected as proof of global warming.

New Study: A ‘Profound’ ~1°C Cooling Trend Across East Antarctica Since 1979 Is ‘Likely To Accelerate’

by K. Richard, July 12, 2021 in NoTricksZone


Except for a few pockets of warming along the West Antarctic coast, surface air temperatures have cooled profoundly across East Antarctica – most of the continent, as well as the surrounding Southern Ocean – in the last 40 years (1979-2018). About 30% of the cooling can be explained by Madden-Julian Oscillation forcing.

Atmospheric CO2 concentrations rose from 337 ppm in 1979 to 408 ppm in 2018.

But according to graphical illustrations of surface air temperature (SAT) trends from satellite observations documented in a new study (Hsu et al., 2021), nearly the entire continent of Antarctica and much of the surrounding Southern Ocean have undergone about -0.02°C/year (-0.2°C per decade) SAT cooling during this period.

East Antarctica’s temperatures have fallen by about 1°C in the last 40 years, with approximately -0.4°C cooling from 1999-2018 relative to 1979-1998.

Per the authors, one-third of this 40-year cooling trend can be attributed to Madden-Julian Oscillation (MJO) forcing. The MJO influence is “likely to accelerate” the long-term cooling trend for East Antarctica in the coming decades.

ACCUWEATHER METEOROLOGIST: GLOBAL WARMING NOT TO BLAME FOR NORTHWEST’S HEATWAVE

by Cap Allon, June 30, 2021 in Elecroverse


Record heat has been felt across the the Pacific Northwest this week, which has led the MSM and their placard-brandishing, sandal wearing EOTW groupies to draw the connection to ‘global warming’ aka ‘the climate crisis’ aka ‘terrifying terra firma broiling’.

However, AccuWeather Meteorologist Joe Lundberg is on the record as saying that AGW isn’t to blame here.

Risking a backlash from his bosses, and from those faceless elites on high, Lundberg very reasonably states: “I just think that right now we’re seeing a very unusual pattern across most of the northern hemisphere where there’s a lot of extremes.”

Lunberg sees erratic jet streams as the main culprit here, which, as Electroverse has been saying for years, are weakening due to historically low solar activity — and while Lunberg doesn’t touch on solar output, he does reference a “big upper level trough that’s in the Aleutians”.

Right now, weather patterns across the country are very unusual, explains Lundberg: “Downstream, there’s a massive upper level ridge that’s in the Northwest, that’s why they’re seeing the record heat there.

“And then downstream along the eastern seaboard, we’re also seeing another upper level ridge.

“But not everyone’s getting this heat,” adds Lundberg — far from it, “across the deep south, for example, it’s actually cooler than average and looks like its gonna stay that way for the foreseeable future.”

Latest GFS runs see temperature departures some 16-20C below the seasonal average across vast regions, particularly in New Mexico:

Antarctica wasn’t quite as cold during the last ice age as previously thought

by OREGON STATE UNIVERSITY, June 6, 2021 in WUWT


CORVALLIS, Ore. – A study of two methods for reconstructing ancient temperatures has given climate researchers a better understanding of just how cold it was in Antarctica during the last ice age around 20,000 years ago.

Antarctica, the coldest place on Earth today, was even colder during the last ice age. For decades, the leading science suggested ice age temperatures in Antarctica were on average about 9 degrees Celsius cooler than at present.

An international team of scientists, led by Oregon State University’s Christo Buizert, has found that while parts of Antarctica were as cold as 10 degrees below current temperatures, temperatures over central East Antarctica were only 4 to 5 degrees cooler, about half of the previous estimates.

The findings were published this week in Science.

“This is the first conclusive and consistent answer we have for all of Antarctica,” said Buizert, an Oregon State University climate change specialist. “The surprising finding is that the amount of cooling is very different depending on where you are in Antarctica. This pattern of cooling is likely due to changes in the ice sheet elevation that happened between the ice age and today.”

Understanding the planet’s temperature during the last ice age is critical to understanding the transition from a cold to a warm climate and to modeling what might occur as the planet warms as a result of climate change today, said Ed Brook, a paleoclimatologist at OSU and one of the paper’s co-authors.

 …

Ocean Temperature Limit – Corrections and Part 4

by R. Willoughby, May 29, 2021 in WUWT


(The author appreciates the availability NASA’s Earth Observations satellite data sets used in this analysis.)

Now a four part series that analyses the role of atmospheric water in regulating Earth’s thermal balance.

Part 1 An analysis of the temperature of tropical ocean warm pools and the temperature limiting processes

Part 2 Discusses the mechanism of deep convection concluding with the persistency of clouds over ocean warm pools.

Part 3 Examines the global ocean energy balance over an annual cycle month-by-month to identify the role of atmospheric water in regulating the energy balance.

Part 4:  The Atmospheric Gear Change

Total Precipitable Water & Level of Free Convection


The Greenhouse Effect In A Water World

by B. Irvine, May 17, 2021 in WUWT


A knowledge of Greenhouse gases is fundamental to any understanding of global surface temperatures. The presence of GHGs in our atmosphere has increased the global surface temperature by about 33C.

There are multiple lines of evidence, however, that challenge the strong water vapour feedback to a small initial CO2 forcing.  These strong positive feedbacks are central to the IPCC narrative.

These lines of evidence include.

  • The failure of all models and catastrophic warming projections.
  • The stubborn refusal of atmospheric Precipitable Water Vapour (PWV) concentration to rise in recent years.
  • The strength of convection cells in the tropics that have kept tropical temperatures approximately the same for many millions of years.
  • Irrigation and extra humidity generally coincide with cooler temperatures.
  • The hot spot as a signature of the positive Water Vapour (WV) feedback and its opposite, the negative lapse rate feedback, has not occurred.

INTRODUCTION

Oceanic Warming? Well, sorta.

by W. Eschenbach, May 1, 2021 in WUWT


After my last post about the surface warming of the ocean, entitled “How Global Warming Isn’t“, I got to thinking about the warming of the upper part of the ocean. So I got the data for the ocean heat content (OHC) of the top 700 metres of the ocean from the marvelous site, KNMI. If you look under “Monthly Observations” you’ll find a host of most fascinating datasets. Under “Heat Content” on that page, you’ll find the National Oceanic Data Center (NODC) 0-700 metre depth OHC data. And down at the very bottom of that page is a link that will download a 196 megabyte gridded NetCDF file containing the data that I used. (Big file, click at your own risk.)

And what did I find? Well, I’m a visual kind of guy. I mean, I can do the math, but it only makes sense when it comes up as a picture on the silver screen. So here are my graphics. I’m interested in the changes in the oceanic heat content, so these are two views of those trends.

This is the bottom line. If the world’s creatures, both on land and at sea, were as temperature-sensitive as the alarmists would have us believe, those beings (and we humanoids as well) all would have gone extinct long ago. And near as I can tell, that hasn’t occurred … at least yet.

UAH GLOBAL TEMPERATURE DROPS BELOW 30-YEAR BASELINE — EARTH IS COOLING

by Cap Allon, April 5, 2021 in Electroverse


The Version 6.0 global average lower tropospheric temperature (LT) anomaly for March, 2021 has come in at -0.01 deg. C below the 30-year baseline, down from the February, 2021 value of +0.20 deg. C, and down substantially (approx. 0.6C deg. C) from where we were around a year ago.

A continuation of this downward plunge is highly probable over the coming months (with the odd bump along the way–climate is cyclic after all) as low solar activity and La Nina conditions persist.

According to the 15x NASA/NOAA AMSU satellites that measure every square inch of the lower troposphere (where us humans reside), planet Earth was actually warmer back in 1983:

REMINDER: We have changed the 30-year averaging period from which we compute anomalies to 1991-2020, from the old period 1981-2010. This change does not affect the temperature trends.
[www.drroyspencer.com]

In addition, the global average oceanic tropospheric temperature anomaly is -0.07 deg. C–the lowest since November 2013. Also, the tropical (20N-20S) departure from average is -0.29 deg. C–the coolest since June of 2012. While Australia, at -0.79 deg. C, is the coolest reading since August 2014.

Bottom line, the Grand Solar Minimum is intensifying — and fast.

Sunspots (a great barometer for solar activity) have remained sparse in 2021, even at a time when the next the next solar cycle (25) should be firing-up.

The Solar Minimum of cycle 24 began bottoming-out way back in late-2017, and went on to develop into the deepest minimum of the past 100+ years — and it is still proving reluctant to release its grip:

Michael Mann “Hockey Stick” Update: Now Definitively Established To Be Fraud

by F. Menton, Aug 26, 2021 in ManhattanContrarian


The Michael Mann “Hockey Stick” is suddenly back in the news. It’s been so long since we have heard from it, do you even remember what it is?

The “Hockey Stick” is the graph that took the world of climate science by storm back in 1998. That’s when Mann and co-authors Raymond Bradley and Malcolm Hughes published in Nature their seminal paper “Global-scale temperature patterns and climate forcing over the past six centuries.” A subsequent 1999 update by the same authors, also in Nature (“Northern Hemisphere Temperatures During the Past Millennium: Inferences, Uncertainties, and Limitations”) extended their reconstructions of “temperature patterns and climate forcing” back another 400 years to about the year 1000. The authors claimed (in the first paragraph of the 1998 article) to “take a new statistical approach to reconstructing global patterns of annual temperature . . . , based on the calibration of multiproxy data networks by the dominant patterns of temperature variability in the instrumental record.” The claimed “new statistical approach,” when applied to a group of temperature “proxies” that included tree ring samples and lake bed sediments, yielded a graph — quickly labeled the “Hockey Stick” — that was the perfect icon to sell global warming fear to the public. The graph showed world temperatures essentially flat or slightly declining for 900+ years (the shaft of the hockey stick), and then shooting up dramatically during the 20th century era of human carbon dioxide emissions (the blade of the stick).

UAH Global Temperature Update for February 2021: +0.20 deg. C

by Roy Spencer, March. 3rd, 2021 in Global Warming


The Version 6.0 global average lower tropospheric temperature (LT) anomaly for February, 2021 was +0.20 deg. C, up from the January, 2021 value of +0.12 deg. C.

REMINDER: We have changed the 30-year averaging period from which we compute anomalies to 1991-2020, from the old period 1981-2010. This change does not affect the temperature trends.

The linear warming trend since January, 1979 remains at +0.14 C/decade (+0.12 C/decade over the global-averaged oceans, and +0.18 C/decade over global-averaged land).

Various regional LT departures from the 30-year (1991-2020) average for the last 14 months are:

UK National Temperature record at Cambridge Botanic Garden –An examination of the data.

by C. Rotter, Feb 13, 2021 in WUWT


Guest Post by Tony Brown

Section 1 Introduction

A visit to the Botanical gardens in Cambridge was made by the author of this paper on August 7th 2020 between 10.15AM to 12.25pm.  The purpose was to look at the site of the Stevenson screen there,  following the establishment at this location of the highest ever recorded UK instrumental  temperature, confirmed by the Met Office as 38.7 C ( 101.6 Fahrenheit ) taken at the gardens on 25 July 2019, and to determine the possible effects on this record caused by urbanisation.  From the botanic garden web site we note:

 “Analysis of the Garden’s weather records show that over the last 100 years our average temperature has risen by 1.2 Celsius and the hottest day, highest monthly and yearly average have all occurred within the last 20 years. The highest ever temperature recorded at the Garden before this new record was 36.9 C, recorded on 10 August, 2003.”  * See; “Section 5; Temperature trends.”

Cambridge University Botanic Garden records highest ever UK temperature – Cambridge Botanic Garden

Some context is provided by firstly examining the past and present urbanisation of the gardens, the location of the Stevenson screen and there then follows an examination of various temperature recordings locally to determine what affect if any the urbanisation may have had.

The visit  was  made during one of the hottest spells of the 2020 summer and  in similar conditions to the record, in as much it had been hot in the days running up to the record with  prolonged sunshine and light winds and these were mirrored on the day of the visit. The preceding day, August 6th 2020 was partially cloudy and very warm at 27C, close by at Cambridge Airport.

Study Shows Arctic Sea Ice Reached Lowest Point On Modern Record… In The 1940s, Not Today!

by C. Rotter, Jan 24, 2021 in WUWT


Regular NoTricksZone author Kenneth Richards notes on Twitter

Apparently Arctic sea ice volume was as low in the 1940s as it has been in the 2000s.

And the highest sea ice volume of the last 100 years was about 1979 – the year the Arctic sea ice record begins.


Guillian Van Achter1, Leandro Ponsoni1, François Massonnet1, Thierry Fichefet1, and Vincent Legat2

  • 1Georges Lemaitre Center for Earth and Climate Research, Earth and Life Institute, Université Catholique de Louvain, Louvain-la-Neuve, Belgium
  • 2Institute of Mechanics, Materials and Civil Engineering, Applied Mechanics and Mathematics, Université Catholique de Louvain, Louvain-la-Neuve, Belgium

Correspondence: Guillian Van Achter (guillian.vanachter@uclouvain.be) Received: 04 Dec 2019 – Discussion started: 10 Dec 2019 – Revised: 17 Jul 2020 – Accepted: 09 Sep 2020 – Published: 21 Oct 2020

Abstract

We use model simulations from the CESM1-CAM5-BGC-LE dataset to characterise the Arctic sea ice thickness internal variability both spatially and temporally. These properties, and their stationarity, are investigated in three different contexts: (1) constant pre-industrial, (2) historical and (3) projected conditions. Spatial modes of variability show highly stationary patterns regardless of the forcing and mean state. A temporal analysis reveals two peaks of significant variability, and despite a non-stationarity on short timescales, they remain more or less stable until the first half of the 21st century, where they start to change once summer ice-free events occur, after 2050.

How to cite. Van Achter, G., Ponsoni, L., Massonnet, F., Fichefet, T., and Legat, V.: Brief communication: Arctic sea ice thickness internal variability and its changes under historical and anthropogenic forcing, The Cryosphere, 14, 3479–3486, https://doi.org/10.5194/tc-14-3479-2020, 2020.1

2020 Review: Observational And Modeling Studies Show Temperature Falls As CO2 Rises

by K. Richard, Dec 28, 2020 in NoTricksZone


A 2020 observational study (Zhang et al., 2020) determined “temperatures of atmospheric air with substantially higher CO2 concentration (ranging from 3200 ppm to 16,900 ppm) were lower than that with the lower CO2 concentration (480 ppm)” and a 2020 modeling study (Drotos et al., 2020) assessed that when CO2 goes beyond 4 times preindustrial – 1,120 ppm – “climate sensitivity decreases to nearly zero” because the climate cyclically cools by 10 K.

So the science is settled, right?


….

CO2 Coalition: “The Global Mean Temperature Anomaly Record How it works and why it is misleading”

by D. Middleton,  Dec 8, 2020 in WUWT


Our friends at the CO2 Coalition have published another excellent report.

This white paper by Richard Lindzen and John Christy explores the global mean temperature anomaly record. Their focus isn’t on whether it’s right or wrong; it’s on its significance relative to natural variability and its inherently low signal-to-noise ratio. Here’s the executive summary:

STUDIES AND RESOURCES, WHITE PAPERS AND OTHER PUBLICATIONS

4 DEC, 2020
The Global Mean Temperature Anomaly Record
How it works and why it is misleading

by Richard S. Lindzen and John R. Christy

The CO2 Coalition is honored to present this Climate Issues in Depth paper by two of America’s most respected and prolific atmospheric physicists, MIT professor emeritus Richard Lindzen, who is a longtime member of the Coalition, and University of Alabama in Huntsville professor John Christy.

Professor Lindzen has published over 200 scientific articles and books over a five-decade career. He has held professorships at the University of Chicago, Harvard University and MIT. He is a fellow and award recipient of the American Meteorological Society and the American Geophysical Union. He is also a member of the National Academy of Science and was a lead author of the UN IPCC’s third assessment report’s scientific volume. His research has highlighted the scientific uncertainties about the impact of carbon dioxide emissions on temperature and climate more generally.

Professor Christy, the director of the Earth System Science Center at The University of Alabama in Huntsville, began studying global climate issues in 1987. He has been Alabama’s State Climatologist since 2000 and a fellow of the American Meteorological Society since 2002. He and CO2 Coalition member Dr. Roy W. Spencer developed and have maintained one of the key global temperature data sets relied on by scientists and government bodies, using microwave data observed in the troposphere from satellites since 1979. For this achievement, they were awarded NASA’s Medal for Exceptional Scientific Achievement.

The purpose of this paper is to explain how the data set that is referred to by policy-makers and the media as the global surface temperature record is actually obtained, and where it fits into the popular narrative associated with climate alarm.

Executive Summary
At the center of most discussions of global warming is the record of the global mean surface temperature anomaly—often somewhat misleadingly referred to as the global mean temperature record. This paper addresses two aspects of this record. First, we note that this record is only one link in a fairly long chain of inference leading to the claimed need for worldwide reduction in CO2 emissions. Second, we explore the implications of the way the record is constructed and presented, and show why the record is misleading.

This is because the record is often treated as a kind of single, direct instrumental measurement. However, as the late Stan Grotch of the Laurence Livermore Laboratory pointed out 30 years ago, it is really the average of widely scattered station data, where the actual data points are almost evenly spread between large positive and negative values.

The average is simply the small difference of these positive and negative excursions, with the usual problem associated with small differences of large numbers: at least thus far, the one-degree Celsius increase in the global mean since 1900 is swamped by the normal variations at individual stations, and so bears little relation to what is actually going on at a particular one.

Physicists: A CO2 Rise To 800 ppm Causes ‘Hypothetical’ 10°C Upper Atmosphere Cooling, 1.4°C Surface Warming

by Wijnagaarden & Happer, Nov 26, 2020 in NoTricksZone


At the current concentrations, the forcing power for greenhouse gases like CO2 (~400 ppm) and CH4 (1.8 ppm) are already saturated. Therefore, even doubling the current greenhouse gas concentrations may only increase their forcings “by a few percent” in the parts of the atmosphere where there are no clouds. When clouds are present, the influence of greenhouse gases is even further minimized.

While the “consensus” model view is that doubling CO2 from 280 ppm to 560 ppm results in a surface forcing of 3.7 W/m², Wijngaarden and Happer find doubling CO2 concentrations from 400 to 800 ppm increases climate forcing by 3 W/m². This warms the surface by 1.4 K as it “hypothetically” cools the upper atmosphere by 10 K.

Equilibrium climate sensitivity (when positive feedback with water vapor is included) is identified as 2.2 K, which is within 10% of multiple other analyses.

Perhaps the dumbest article title ever: “The Arctic hasn’t been this warm for 3 million years”… AEUHHH???

by D. Middleton, Nov 6, 2020 in WUWT


The sad thing is that this was apparently written by two geoscience professors.


Figure 1. “The oxygen isotopes in the ice imply that climate was stable during the last interglacial period, with temperatures 5 °C warmer than today.” North Greenland Ice Core Project members, 2004

Claim: The deep sea is slowly warming

by American Geophysical Union, Oct 13, 2020 in WUWT


WASHINGTON–New research reveals temperatures in the deep sea fluctuate more than scientists previously thought and a warming trend is now detectable at the bottom of the ocean.

In a new study in AGU’s journal Geophysical Research Letters, researchers analyzed a decade of hourly temperature recordings from moorings anchored at four depths in the Atlantic Ocean’s Argentine Basin off the coast of Uruguay. The depths represent a range around the average ocean depth of 3,682 meters (12,080 feet), with the shallowest at 1,360 meters (4,460 feet) and the deepest at 4,757 meters (15,600 feet).

They found all sites exhibited a warming trend of 0.02 to 0.04 degrees Celsius per decade between 2009 and 2019 – a significant warming trend in the deep sea where temperature fluctuations are typically measured in thousandths of a degree. According to the study authors, this increase is consistent with warming trends in the shallow ocean associated with anthropogenic climate change, but more research is needed to understand what is driving rising temperatures in the deep ocean.

“In years past, everybody used to assume the deep ocean was quiescent. There was no motion. There were no changes,” said Chris Meinen, an oceanographer at the NOAA Atlantic Oceanographic and Meteorological Laboratory and lead author of the new study. “But each time we go look we find that the ocean is more complex than we thought.”The challenge of measuring the deep

Researchers today are monitoring the top 2,000 meters (6,560 feet) of the ocean more closely than ever before, in large part due to an international program called the Global Ocean Observing System. Devices called Argo floats that sink and rise in the upper ocean, bobbing along in ocean currents, provide a rich trove of continuous data on temperature and salinity.