Years ago, Dr. Roger Pielke Sr. explained why sea surface temperatures (SST) were the best indicator of heat content gained or lost from earth’s climate system. Enthalpy is the thermodynamic term for total heat content in a system, and humidity differences in air parcels affect enthalpy. Measuring water temperature directly avoids distorted impressions from air measurements. In addition, ocean covers 71% of the planet surface and thus dominates surface temperature estimates.
More recently, Dr. Ole Humlum reported from his research that air temperatures lag 2-3 months behind changes in SST. He also observed that changes in CO2 atmospheric concentrations lag behind SST by 11-12 months. This latter point is addressed in a previous post Who to Blame for Rising CO2?
by S. Graham, May 9, 2018 in ClimateChangeDispatch
World fund managers predict a fall in the value of oil companies. According to a survey published last month in the United Kingdom, climate change risks will force a lower valuation of oil company stock prices within the next five years.
But despite many predictions of demise over the last 50 years, global consumption of hydrocarbon energy continues to grow
(…)
We’ve heard this many times before. In his address to the nation on April 18, 1977, President Jimmy Carter stated, “…we could use up all the proven reserves of oil in the world by the end of the next decade.”
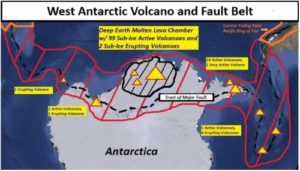
by J.E. Kamis, May 7, 2018 in ClimateChangeDispatch
The inclusion of the here-termed West Antarctic Volcano and Fault Belt into the Pacific Ring of Fire will raise scientific awareness concerning the idea, as per the Plate Climatology Theory, that geologically induced heat flow is the root cause of many anomalous changes in Antarctica’s ecosystems, oceans, climate, and ice masses.
When Earth’s tectonic style transitioned from stagnant lid (single plate) to the modern episode of plate tectonics is important but unresolved, and all lines of evidence should be considered, including the climate record. The transition should have disturbed the oceans and atmosphere by redistributing continents, increasing explosive arc volcanism, stimulating mantle plumes and disrupting climate equilibrium established by the previous balance of silicate‐weathering greenhouse gas feedbacks. Formation of subduction zones would redistribute mass sufficiently to cause true polar wander if the subducted slabs were added in the upper mantle at intermediate to high latitudes. The Neoproterozoic Snowball Earth climate crisis may reflect this transition. The transition to plate tectonics is compatible with nearly all proposed geodynamic and oceanographic triggers for Neoproterozoic Snowball Earth events, and could also have contributed to biological triggers. Only extraterrestrial triggers cannot be reconciled with the hypothesis that the Neoproterozoic climate crisis was caused by a prolonged (200–250 m.y.) transition to plate tectonics.
Energy produced offshore is a major component of global oil and natural gas supply and could provide an increasingly important source of renewable electricity. Resources are enormous, but offshore projects have to prove their worth in a changing market and policy context, amid a variety of pressures on the world’s oceans.
More than a quarter of today’s oil and gas supply is produced offshore, mostly in the Middle East, the North Sea, Brazil, the Gulf of Mexico and the Caspian Sea. While offshore oil production has been relatively stable since 2000, natural gas output from offshore fields has risen by more than 50% over the same period. Offshore electricity generation, mainly from wind, has increased rapidly in recent years, notably in the relatively shallow coastal waters of Europe’s North Sea.
Eurostat estimates that in 2017 carbon dioxide (CO2) emissions from fossil fuel combustion increased by 1.8% in the European Union (EU), compared with the previous year. CO2 emissions are a major contributor to global warming and account for around 80% of all EU greenhouse gas emissions. They are influenced by factors such as climate conditions, economic growth, size of the population, transport and industrial activities.
It should also be noted that imports and exports of energy products have an impact on CO2 emissions in the country where fossil fuels are burned: for example if coal is imported this leads to an increase in emissions, while if electricity is imported, it has no direct effect on emissions in the importing country, as these would be reported in the exporting country where it is produced.
This information on early estimates of CO2 emissions from energy use for 2017 is published by Eurostat, the statistical office of the European Union.
Largest falls in CO2 emissions in Finland and Denmark, highest increases in Malta and Estonia
According to Eurostat estimates, CO2 emissions rose in 2017 in a majority of EU Member States, with the highest increase being recorded in Malta (+12.8%), followed by Estonia (+11.3%), Bulgaria (+8.3%) Spain (+7.4%) andPortugal (+7.3%). Decreases were registered in seven Member States: Finland (-5.9%), Denmark (-5.8%), theUnited Kingdom (-3.2%), Ireland (-2.9%), Belgium (-2.4%), Latvia (-0.7%) and Germany (-0.2%)..
As global oil markets shift their attention from U.S. shale oil production back to a resurgent Saudi Arabia and Russia and geopolitical concerns bearing down on oil prices, Citigroup said last Wednesday that the U.S. is poised to surpass Saudi Arabia next year as the world’s largest exporter of crude and oil products.
The U.S. exported a record 8.3 million barrels per day (bpd) last week of crude oil and petroleum products, the government also said Wednesday. Top crude oil exporter Saudi Arabia’s, for its part, exported 9.3 million bpd in January, while Russia exported 7.4 million bpd, the bank added.
However, it should also be noted that the Citi projection is for both crude and finished (refined) petroleum products, not only crude oil. Saudi Arabia remains the world’s largest exporter of crude, though since January amid the OPEC/non-OPEC production cut agreement that figure has fallen. On April 10, the Saudi oil minister said that the kingdom planned to keep its crude oil shipments in May below 7 million bpd for the 12th consecutive month (…)
Over the last 5000 years, Mount Taranaki volcano, located in the westernmost part of New Zealand’s North Island, produced at least 16 Plinian-scale explosive eruptions, the latest at AD 1655. These eruptions had magnitudes of 4 to 5, eruptive styles, and contrasting basaltic to andesitic chemical compositions comparable to the eruptions of Etna, 122 BC; Vesuvius, AD79; Tarawera, 1886; Pelée, 1902; Colima, 1910; Mount Saint Helens, 1980; Merapi, 2010; and Calbuco, 2015.
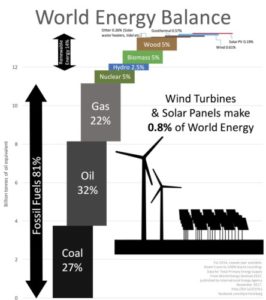
The report (.pdf, 11 pages), by eminent epidemiologist Mikko Paunio, says that international bodies and NGOs are trying to prevent poor countries from expanding their use of conventional fuels, have abandoned the so-called “energy ladder” — the gradual shift to cleaner types of fuel that underpinned the clean up of air quality in industrialised nations.
As Dr Paunio explains, this will have devastating consequences:
“Indoor air pollution from domestic fires kills millions every year. But instead of helping poor people to climb the energy ladder and clean the air in their communities, the poorest people are being given gimmicks like cookstoves, which make little difference to air quality, and solar panels, which are little more than a joke.”
The Republic of the Congo has suffered dearly during the oil collapse; and Congolese President Denis Nguesso has pledged that the country would no longer be sitting on the side lines, suffering the effects of global decision-making in the oil industry without a voice. In an official communiqué announcing the bid for OPEC membership, he stated that he wished to “place our country in the rank of the world’s leaders.”
At nearly 2 billion barrels of crude oil of proven reserves in a vastly underexplored territory, Congo represents a sleeping giant amidst African oil producers. An improved business climate has brought profound benefits to the country’s oil industry. New developments by French oil company Total in Congolese territory are set to expand the country’s oil output from 280,000 barrels per day to 350,000 in 2018.
by Tony Heller, May 2, 2018 in TheDeplorableClimateScience
Measured US temperatures show cooling over the last 90 years. This doesn’t suit the needs of the climate mafia, so NOAA massively alters the data to turn cooling into warming. NOAA cools the past by more than one degree, and warms the present by nearly one degree. Then other climate scientists use this fake data to confirm fake theories about CO2 emissions warming the planet.
A new study by climatologists Nicholas Lewis and Judith Curry concludes that Earth’s “equilibrium climate sensitivity” (ECS) to more atmospheric carbon dioxide is as much as 50% lower than climate alarmists have been claiming. That their paper was published in the Journal of Climate suggests that the asserted “97% consensus” of climate experts may be eroding.
Or as Cornwall Alliance founder Cal Beisner puts it (paraphrasing Winston Churchill) it may not be the beginning of the end of climate alarmism. But it could be the end of the beginning of alarmism as the dominant, ever-victorious tenet of our times.
Indeed, say other noted climatologists, there are good reasons to think ECS and alarmist errors are even greater than 50 percent. For one thing, there is no persuasive reason to assume our planet’s climate system (…)
by P. Homewood, May 2, 2018 in NotaLotofPeopleKnowThat
For several decades now, Antarctica has not been cooperating with the “global” warming narrative, as the continent as a whole has not been warming.
Several scientific papers have been published recently that document the lack of an anthropogenic warming signal for the Antarctic continent or the surrounding ocean, as well as the dominance of natural variability (…)
The metropolitan area of Istanbul with around 15 million inhabitants is considered to be particularly earthquake-prone. In order to be able to assess the risk correctly, researchers must decipher the processes underground. Below the Marmara Sea, an international research team detected earthquakes that were not directly caused by tectonic stresses but by rising natural gas.
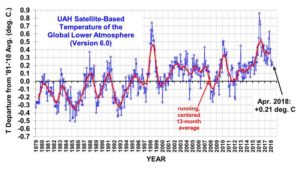
The Version 6.0 global average lower tropospheric temperature (LT) anomaly for April, 2018 was +0.21 deg. C, down a little from the March value of +0.24 deg. C
Global area-averaged lower tropospheric temperature anomalies (departures from 30-year calendar monthly means, 1981-2010). The 13-month centered average is meant to give an indication of the lower frequency variations in the data; the choice of 13 months is somewhat arbitrary… an odd number of months allows centered plotting on months with no time lag between the two plotted time series. The inclusion of two of the same calendar months on the ends of the 13 month averaging period causes no issues with interpretation because the seasonal temperature cycle has been removed, and so has the distinction between calendar months.
by M. Bastach, April 30, 2018 in ClimateChangeDispatch
Roughly 20 years ago, climate scientist Michael Mann published his famous “hockey stick” graph that he says “galvanized climate action” by showing unprecedented global warming.
Mann used the 20-year anniversary of the graph to opine on the “industry-funded” attacks “to discredit the iconic symbol of the human impact on our climate,” which Mann claimed had withstood criticism.
“Yet, in the 20 years since the original hockey stick publication, independent studies, again and again, have overwhelmingly reaffirmed our findings, including the key conclusion: recent warming is unprecedented over at least the past millennium,” Mann wrote in Scientific American on April 20.
However, the two Canadian researchers who found serious flaws in the “hockey stick” study’s data and methodology disputed Mann’s characterization of the graph’s legacy.
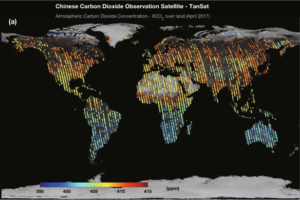
Scientists at the Chinese Academy of Sciences have put together the first global carbon dioxide maps based on data from the Chinese satellite TanSat. The satellite also measures what lead researcher Yang Dongxu calls “carbon dioxide flux,” changes in its behavior on Earth and in the Earth’s atmosphere.
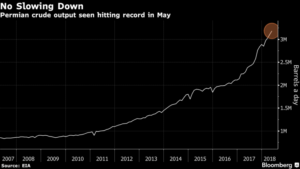
The Permian shale play is all about setting records. Now, the region may even become the world’s largest oil patch over the next decade.
Output in the basin is forecast to reach 3.18 million barrels a day in May, according to the Energy Information Administration. That’s the highest since the agency began compiling records in 2007. By 2023, the basin may produce 4 million barrels a day, according to the International Energy Agency. The Ghawar field in Saudi Arabia is currently the world’s biggest oil field, with capacity of 5.8 million barrels a day, according to a 2017 EIA report.
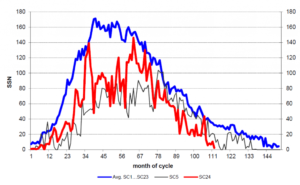
As the current solar cycle nears an end, it will go down as the weakest in close to 200 years. And as inhabitants of the northern hemisphere dig themselves out of an especially icy and snowy winter and Arctic sea ice rebounds, it may all be in part linked to low solar activity as many scientific studies have long suggested.
Figure 1: The current solar cycle no. 24 (red) compared to the mean of the previous 23 recorded solar cycles (blue) and the similar solar cycle no. 5 (black)
IBRA, Oman — In the arid vastness of this corner of the Arabian Peninsula, out where goats and the occasional camel roam, rocks form the backdrop practically every way you look.
But the stark outcrops and craggy ridges are more than just scenery. Some of these rocks are hard at work, naturally reacting with carbon dioxide from the atmosphere and turning it into stone.
Veins of white carbonate minerals run through slabs of dark rock like fat marbling a steak. Carbonate surrounds pebbles and cobbles, turning ordinary gravel into natural mosaics.
Even pooled spring water that has bubbled up through the rocks reacts with CO2 to produce an ice-like crust of carbonate that, if broken, re-forms within days.
Scientists say that if this natural process, called carbon mineralization, could be harnessed, accelerated and applied inexpensively on a huge scale — admittedly some very big “ifs” — it could help fight climate change. Rocks could remove some of the billions of tons of heat-trapping carbon dioxide that humans have pumped into the air since the beginning of the Industrial Age.
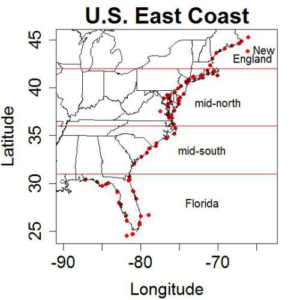
By taking a closer look, scientists find resilience in face of heat stress.
Coral reef bleaching is stark evidence of the damage being inflicted by global climate change on marine ecosystems, but a research team has found some cause for hope. While many corals are dying, others are showing resilience to increased sea surface temperatures, pointing to possible clues to the survival and recovery of these vitally important aquatic habitats (…)
Maldives Environment Minister Thoriq Ibrahim has warned that unless the Maldives gets its climate cash before 2020, the 1.5C global warming limit will be breached.
I’m not sure how the Maldives reconciles their climate concerns with all their fly-in tourism and their aggressive airport and resort building programmes, but no doubt some of that climate cash will help with the reconciliation if it ever arrives.
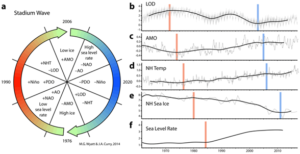
It is a well-known feature of climate change that since 1850 multiple climate datasets present a ~ 60-year oscillation. I recently wrote about it in the 7th chapter of my Nature Unbound series. This oscillation is present in the Atlantic Multidecadal Oscillation (AMO), Arctic Oscillation (AO), North Atlantic Oscillation (NAO), Pacific Decadal Oscillation (PDO), Length of Day (LOD), and Global (GST) and Northern Hemisphere (NHT) temperatures, with different lags.
To me this oscillation is not a cycle because prior to 1850 it had a more variable period and it is not well identified in LIA records. Since the origin of this oscillation is unknown, models have a hard time reproducing it and it is all but ignored by the IPCC. It is a big oscillation with an amplitude of ± 0.3 °C in NHT (0.1-0.2°C in GST; figure 2). While the long-term temperature trend is unaffected by it, there is a large effect on the 30-year trends. If this oscillation is considered, most of the climate alarmism vaporizes.
(…)
La géologie, une science plus que passionnante … et diverse