Volcanic ash may have a bigger impact on the climate than we thought

by University of Colorado at Boulder, Sep 11, 2020 in ScienceDaily


“They saw some large particles floating around in the atmosphere a month after the eruption,” Zhu said. “It looked like ash.”

She explained that scientists have long known that volcanic eruptions can take a toll on the planet’s climate. These events blast huge amounts of sulfur-rich particles high into Earth’s atmosphere where they can block sunlight from reaching the ground.

Researchers haven’t thought, however, that ash could play much of a role in that cooling effect. These chunks of rocky debris, scientists reasoned, are so heavy that most of them likely fall out of volcanic clouds not long after an eruption.

Zhu’s team wanted to find out why that wasn’t the case with Kelut. Drawing on aircraft and satellite observations of the unfolding disaster, the group discovered that the volcano’s plume seemed to be rife with small and lightweight particles of ash — tiny particles that were likely capable of floating in the air for long periods of time, much like dandelion fluff.

Journal Reference:

  1. Yunqian Zhu, Owen B. Toon, Eric J. Jensen, Charles G. Bardeen, Michael J. Mills, Margaret A. Tolbert, Pengfei Yu, Sarah Woods. Persisting volcanic ash particles impact stratospheric SO2 lifetime and aerosol optical properties. Nature Communications, 2020; 11 (1) DOI: 10.1038/s41467-020-18352-5

The Dirty Dozen Tests Of Global Warming Science

by G.H. Sherrington, Sep 11, 2020 in WUWT


Assume for discussion that there has been a change of 1⁰C in the customary global near-surface air temperature, GAST, over the last century. There have been many assertions that this has produced changes. The strength of assertions is greater when a mathematical relation between temperature and the alleged change is established. Here are some relationships to ponder, for the last century or for a significant or available shorter time.

For a 1C change in global temperature –

  1. By how many millimeters does the sea level surface height change?

  2. By how many ppm does atmospheric CO change?

  3. By how many tonnes does the weight of terrestrial vegetation, like forests, change?

  4. By how much does the pH of the oceans change?

  5. By how many sq km does the average area of cloud cover change?

  6. What change is there to the accumulated cyclone index, ACE?

  7. What is the net change to the globalnumber of –

    1. Birds
    1. Land animals
    1. Marine algae
  8. By how many Watt per square metre does the Top of Atmosphere TOA radiation balance change?

  9. By how many tonnes does the weight of ice change –

    1. Over land
    1. Floating on sea
    1. Grounded over sea
  10. By how much does total precipitable rainfall TPW change?

  11. By what number does the number of large bush fires change?


By how many tonnes do yields of major food crops change, expressed as tonnes available per person, for example

….

California Has Always Had Fires, Environmental Alarmism Makes Them Worse Than Necessary

by M. Schellenberger,  Sep 10, 2020 in Forbes


….

“California was a very smoky place historically,” says Malcolm North of the US Forest Survey.“Even though we’re seeing area burned that is off-the-charts, it’s still probably less than what used to be burned before Europeans arrived.”

Many reporters note that more area has burned this year in California than at any other point in “the modern period,” but that period began in 1950. For the last half of the 20th Century, the annual area burned in California was just 250,000 acres a year, whereas the best-available science suggests 4.4 and 12 million acres burned in California annually before the arrival of Europeans.

 …
See alsoCalifornia Has Always Had Fires, Environmentalism Makes Them Worse

European research project aims to understand concrete degradation

by World Nuclear News, Sep 10, 2020


A new research project supported by the European Union aims to clarify, enhance and unify methods of structural integrity assessment of safety-critical concrete infrastructure in support of long-term operation of nuclear power plants. Coordinated by Finland’s VTT Technical Research Centre, the collaborative project seeks to improve the understanding of ageing and deterioration of such concrete.

In September 2018, Belgian utility Electrabel announced that scheduled outages at Tihange 2 and 3 had been extended while concrete degradation issues in adjacent non-nuclear buildings were addressed (Image: Electrabel)

The ACES project, which began on 1 September and will run until 31 August 2024, has a total budget of just over EUR5 million (USD6 million), of which the European Commission is funding almost EUR4 million under the H2020-Euratom-1 programme.

The consortium involved in the project comprises 10 European companies and research partners, and one international partner. They are: Engie Lab and SCK-CEN of Belgium; CTU and CVR of the Czech Republic; CEA, EDF and IRSN of France; ZAG of Slovenia; Energorisk of Ukraine; and, ORNL of the USA.

The project will study the deterioration and ageing mechanisms of reinforced concrete, such as in reactor containment buildings, as well as predicting the occurrence of corrosion. It aims to develop an innovative inspection tool for early detection of corrosion.

Claim: Historical climate fluctuations in Central Europe overestimated due to tree ring analysis

by Postdam Institute, Sep 10, 2020 in WUWT


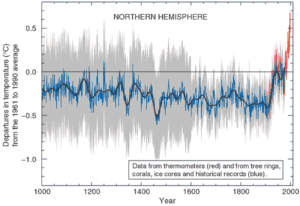
“Was there a warm period in the Middle Ages that at least comes close to today’s? Answers to such fundamental questions are largely sought from tree ring data,” explains lead author Josef Ludescher of the Potsdam Institute for Climate Impact Research (PIK). “Our study now shows that previous climate analyses from tree ring data significantly overestimate the climate’s persistence. A warm year is indeed followed by another warm rather than a cool year, but not as long and strongly as tree rings would initially suggest. If the persistence tendency is correctly taken into account, the current warming of Europe appears even more exceptional than previously assumed.”

To examine the quality of temperature series obtained from tree rings, Josef Ludescher and Hans Joachim Schellnhuber (PIK) as well as Armin Bunde (Justus-Liebig-University Giessen) and Ulf Büntgen (Cambridge University) focused on Central Europe. Main reason for this approach was the existing long observation series dating back to the middle of the 18th century to compare with the tree ring data. In addition, there are archives that accurately recorded the beginning of grape and grain harvests and even go back to the 14th century. These records, as well as the width of tree rings, allow temperature reconstructions. A warm summer is indicated by a wide tree ring and an early start of the harvest, a cold summer by a narrow tree ring and a late start of the harvest. The trees studied are those from altitudes where temperature has a strong influence on growth and where there is enough water for growth even in warm years.

Charting the Flows of Energy Consumption by Source and Country (1969-2018)

by Govin Bhutada, Sep 9, 2020 in VisualCapitalist


Charting Energy Consumption by Source and Country

View the interactive version of this post by clicking here.

Over the last 50 years, the world has seen a colossal increase in energy consumption—and with the ongoing transition to renewable energy, it’s interesting to look at how these sources of energy have been evolving over time.

While some countries continue to rely heavily on fossil fuels like oil, coal, and natural gas, others have integrated alternative energy sources into their mix.

This visualization comes to us from Brian Moore and it charts the evolution of energy consumption in the 64 countries that have data available for all of the last 50 years.

Tera-What? The Most Prominent Sources of Energy (2009-2018)

First, let’s take a look at which sources have produced the most energy over the last decade of data. Energy consumption is measured in terawatt-hours (TWh)—a unit of energy equal to outputting one trillion watts for an hour.

Al Gore Uses Heatwaves, Wildfires To Fuel Global Warming Angst

by V. Richardson, Sep 9, 2020 ClimateChangeDispatch


A burst of wild September weather brought a “climate crisis” warning Tuesday from Al Gore as Californians struggled with heat and wildfires, Atlantic storm trackers raced through the alphabet and Coloradans traded their flip-flops for snow boots.

California firefighters fought to contain 23 active fires that charred a record 2.3 million acres as the state headed into the peak of its fire season fueled by a heatwave. On Sunday, the Los Angeles County town of Woodland Hills set a record at 121 degrees.

“It reached a record high of 121 degrees F in LA county over the weekend,” Mr. Gore tweeted Tuesday. “Extreme heat is fueling a longer, more intense, and more destructive wildfire season in CA. This is what an unabated climate crisis looks like.”

In a warming climate, temperatures become more stable, not less, because the differences between the poles and the equator become smaller, Mr. Taylor said.

“Assuming for the sake of argument that a large temperature swing is a crisis like climate alarmists assert, global warming will make such temperature swings less likely and severe,” he said. “So this is happening despite our recent modest warming, not because of it.”

California’s Creek Fire Creates Its Own Pyrocumulonimbus Cloud

by NASA, September 9, 2020 in WUWT


On Friday September 4, 2020 at about 6:44 PM PDT the Creek Fire began in the Big Creek drainage area between Shaver Lake, Big Creek and Huntington Lake, Calif. NASA’s Suomi NPP satellite captured these images of the fire on Sep. 05 through Sep. 07, 2020. From the series of images the spread of the fire can be seen in the outward movement of the red hot spots, although the huge cloud on the 6th obscures all readings due to its size.

The huge, dense cloud created on Sep. 05 and seen in the Suomi NPP image was a pyrocumulonimbus cloud (pyroCb) and the resulting smoke plume that grew upward was spotted and confirmed on Sep. 06, 2020. A pyrocumulonimbus cloud is also called a cumulonimbus flammagenitus. The origins of the latter word are from the Latin meaning “flame” and “created from.” This perfectly describes a cloud that is caused by a natural source of heat such as a wildfire or volcano. Rising warm air from the fire can carry water vapor up into the atmosphere causing clouds. Any type of convective cloud can be created. In this case, the cumulonimbus, or thunderhead cloud, was created. Precipitation and lightning can also occur with these types of clouds creating a risk that the fire will expand due to increased wind from precipitation downdraft or by creating new fires due to lightning strikes. These are all things that fire managers must keep in mind while continuing to try to fight the fire.

Centennial-Scale Temperature Change During the Common Era Revealed by Quantitative Temperature Reconstructions on the Tibetan Plateau

by Li X. et al., September 3, 2020 in Front.Earth.Sci.


Quantitative palaeotemperature reconstruction is crucial for understanding the evolution of Earth’s climate and reducing uncertainty in future climate predictions. Clarifying the temperature change over the Tibetan Plateau (TP) during the Common Era is critical because it plays a vital role in the prediction of cryosphere changes in such regions under a future warming climate. In this paper, we report a comprehensive synthesis of currently available quantitative temperature records to refine the temperature history of the TP during the Common Era. To date, Common Era quantitative temperature reconstructions are sparse and mainly concentrated in the northeastern TP. Considering seasonal bias of the available quantitative temperature reconstructions, three different composite temperature records for TP were derived, namely the “Standardization” composite, the “Mean annual air temperature anomaly” composite, and the “Mean summer temperature anomaly” composite individually. All the integrated temperature series reveal the Medieval Climate Anomaly and the Little Ice Age, but the start and end timings of these multi-centennial-scale periods and their temperature amplitudes differ. There is strong seasonality in temperature variations on this high plateau, and the 20th century warming was characterized by rapid winter temperature increases, while summer temperatures displayed weak variations. Spatial analysis suggests a relatively consistent signal marking a warm TP during 600–1400 CE and a cold plateau during 1400–1900 CE. Large-scale trends in temperature history for the TP resemble those for China and the Northern Hemisphere. Many factors, such as seasonality of temperature proxies, might lead to uncertainty in the reconstructed series. The results highlight that it is of crucial importance to develop more seasonal temperature reconstructions to improve the reliability of quantitative paleoclimatic reconstructions based on geological records across the TP.

“NEW LITTLE ICE AGE INSTEAD OF GLOBAL WARMING?” BY DR THEODOR LANDSCHEIDT

by Cap Allon, September 7, 2020 in Electroverse


Among the long list or scientific papers suggesting that a solar-driven spell of global cooling is on the cards, Dr Theodor Landscheidt’s ‘New Little ICE Age Instead of Global Warming?‘ probably has the claim of priority.

Published in 2003, just a year before his death, Landscheidt’s research is standing the test of time, and is still largely on course to be proved correct.

The paper’s abstract begins:

‘Analysis of the sun’s varying activity in the last two millennia indicates that contrary to the IPCC’s speculation about man-made global warming as high as 5.8C within the next hundred years, a long period of cool climate with its coldest phase around 2030 is to be expected.’

Crucially, in the growing list of research concluding that a solar-driven multidecadal spell of global cooling is on the cards (research from multiple studies of quite different characteristics), the year 2030 ALWAYS features prominently. Unlike the IPCC, which tosses its thermageddon doomsday date back and forth like a hot potato, researchers who track the multimillennial plays of the cosmos (namely those of the Sun) routinely land on the year 2030 as being the date of ‘climate deterioration’: this in itself should serve as compelling evidence.

Dr Landscheidt continues:

‘It is shown that minima in the 80 to 90-year Gleissberg cycle of solar activity, coinciding with periods of cool climate on Earth, are consistently linked to an 83-year cycle in the change of the rotary force driving the sun’s oscillatory motion … As the future course of this cycle and its amplitudes can be computed, it can be seen that the Gleissberg minimum around 2030 and another one around 2200 will be of the Maunder minimum type accompanied by severe cooling on Earth. This forecast should prove skillful as other long-range forecasts of climate phenomena, based on cycles in the sun’s orbital motion, have turned out correct as for instance the prediction of the last three El Niño years before the respective event.’

Dr Landscheidt concludes his introduction with the IPCC’s position on global warming, and he points to a growing list of publications showing a solar-climate connection:

CNN Falsely Blames Climate Change For Siberian Craters

by A. Watts, September 6, 2020 in ClimateChangeDispatch


The phrase “never let a potential climate crisis story go to waste” must be in CNN’s news handbook because this headline has absolutely nothing to do with global warming aka climate change.

The story at CNN titled Massive mystery holes appear in Siberian tundra — and could be linked to climate change is a red herring of the smelliest kind because if the writer Katie Hunt had bothered to do even the simplest of web searches, she would have learned that this crater, peculiar to that part of Siberia, is called a Pingo.

It has been known to western academics since 1825, ruling out the paranoia of “climate change” in recent decades as the cause.

In fact, all Katie had to do was look at Wikipedia for the answer:

Pingos are intrapermafrost ice-cored hills, ranging in height from 3 to 70 m (10 to 230 ft) and 30 to 1,000 m (98 to 3,281 ft) in diameter. They are typically conical in shape and grow and persist only in permafrost environments, such as the Arctic and subarctic.

A pingo is a periglacial landform, which is defined as a non-glacial landform or process linked to colder climates. It is estimated that there are more than 11,000 pingos on Earth. The Tuktoyaktuk peninsula area has the greatest concentration of pingos in the world with a total of 1,350 pingos.

Ocean carbon uptake widely underestimated

by University of Exeter, September5, 2020 in WUWT/Nature


The world’s oceans soak up more carbon than most scientific models suggest, according to new research.

Previous estimates of the movement of carbon (known as “flux”) between the atmosphere and oceans have not accounted for temperature differences at the water’s surface and a few metres below.

The new study, led by the University of Exeter, includes this – and finds significantly higher net flux of carbon into the oceans.

It calculates CO2 fluxes from 1992 to 2018, finding up to twice as much net flux in certain times and locations, compared to uncorrected models.

“Half of the carbon dioxide we emit doesn’t stay in the atmosphere but is taken up by the oceans and land vegetation ‘sinks’,” said Professor Andrew Watson, of Exeter’s Global Systems Institute.

“Researchers have assembled a large database of near-surface carbon dioxide measurements – the “Surface Ocean Carbon Atlas” (http://www.socat.info) – that can be used to calculate the flux of CO2 from the atmosphere into the ocean.

“Previous studies that have done this have, however, ignored small temperature differences between the surface of the ocean and the depth of a few metres where the measurements are made.

Continuer la lecture de Ocean carbon uptake widely underestimated

PROF. NILS-AXEL MÖRNER: “THE APPROACHING GRAND SOLAR MINIMUM AND LITTLE ICE AGE CONDITIONS”

by Cap Allon, September 6, 2020 in Electroverse


Nils-Axel Mörner is the former head of the paleogeophysics and geodynamics department at Stockholm University. He retired in 2005 and since has dedicated his days to disproving the IPPC’s thermageddon nonsense while also warning of a coming Grand Solar Minimum.

Between 1997-2003, Mörner chaired an INTAS project on Geomagnetism & Climate; the project concluded that we, in the middle of the 21st century, had to be back in a new solar minimum with Little Ice Age climatic conditions.

These conclusions were quite straightforward, writes Mörner, and were included in a Special Issue of PRP: Obviously we are on our way into a new grand solar minimum. This sheds serious doubts on the issue of a continued, even accelerated, warming as proposed by the IPCC project. This quite innocent—and very true—conclusion made the publisher take the quite remarkable step to close down the entire scientific journal. This closing down gave rise to turbulence and objections within the scientific community. But it didn’t stop Mörner. He kept publishing scientific works regarding the impending GSM.

In 2015, Mörner’s “The Approaching New Grand Solar Minimum and Little Ice Age Climate Conditions” was published. It suggests that by 2030-2040 the Sun will experience a new grand solar minimum. This is evident from multiple studies of quite different characteristics, writes Mörner: the phasing of sunspot cycles, the cyclic observations of North Atlantic behavior over the past millennium, the cyclic pattern of cosmogenic radionuclides in natural terrestrial archives, the motions of the Sun with respect to the center of mass, the planetary spin-orbit coupling, the planetary conjunction history, and the general planetary-solar-terrestrial interaction.

During the previous grand solar minima—i.e. the Spörer Mini-mum (ca 1440-1460), the Maunder Minimum (ca 1687-1703) and the Dalton Minimum (ca 1809- 1821)—the climatic conditions deteriorated into Little Ice Age periods.

 …
see also  SEPTEMBER SNOW IS “A BIG DEAL FOR EVERYONE WHO FARMS” — WELCOME TO THE GRAND SOLAR MINIMUM

Sceptical covid-19 research and sceptical polar bear science: is there a difference?

by Polar Bear Science, September 6, 2020


This essay about medical researchers having trouble getting their papers published because the results don’t support the official pandemic narrative has disturbing parallels with my experience trying to inject some balance into the official polar bear conservation narrative.1 Especially poignant is the mention of models built on assumptions sold as ‘facts’ that fail once data (i.e. evidence) become available – which of course is the entire point of my latest book, The Polar Bear Catastrophe That Never Happened.

Read the commentary below, copied from Lockdownsceptics.org (6 September 2020). Bold in original, link added to the story to which this is a response, and brief notes and links added as footnotes for parallels with polar bear conservation science.

NuScale SMR receives US design certification approval

by World Nuclear News, September 1, 2020


The US Nuclear Regulatory Commission (NRC) has issued a final safety evaluation report (FSER) for NuScale’s small modular reactor. This is the first-ever FSER to be issued by the NRC for an SMR, and represents the completion of the technical review and approval of the design.

NuScale’s application for certification of its SMR design for use in the USA was submitted on 31 December, 2016 and was accepted by the NRC the following March. NRC said its completion of the technical review within its original 42-month schedule demonstrates its commitment to “timely” licensing of new, advanced reactor technology.

“This is a significant milestone not only for NuScale, but also for the entire US nuclear sector and the other advanced nuclear technologies that will follow. This clearly establishes the leadership of NuScale and the US in the race to bring SMRs to market,” said NuScale Chairman and CEO John Hopkins. He also credited strong bipartisan support from US Congress for the project, which received cost-shared federal funding as it advanced through the NRC Design Certification process.

NuScale said it had spent over USD500 million, with the backing of its majority investor Fluor, and over 2 million labour hours to develop the information needed to prepare its design certification application. The company also submitted 14 separate Topical Reports in addition to the application – itself over 12,000 pages long – and provided more than 2 million pages of supporting information for NRC audits.

The NuScale design uses passive processes such as convection and gravity in its operating systems and safety features to produce about 600 MW of electricity. Twelve modules, each producing 50 MW, are submerged in a safety-related pool built below ground level. The NRC has concluded the design’s passive features “will ensure the nuclear power plant would shut down safely and remain safe under emergency conditions, if necessary”, it said. NuScale has also indicated to NRC it will apply for standard design approval of a version using 60 MW modules, the regulator said. This would require additional NRC review.


Continuer la lecture de NuScale SMR receives US design certification approval

Mining For Green-Energy Materials Threatens Biodiversity, Study Shows

by O. Rudgard, September 3, 2020 in ClimateChaneDispatch


Mining for renewable energy materials could threaten biodiversity, researchers have found.

Scientists at the University of Queensland, Brisbane found a high degree of overlap between areas used for mining essential minerals like lithium, which is used for car batteries, and areas with high levels of biodiversity as yet untouched by industry.

Conservationists are “often naive to the threats posed by significant growth in renewable energies”, the researchers said in the study published in the journal Nature Communications, pointing out that 14 percent of protected areas contain metal mines or have them nearby.

Overall, the researchers found that eight percent of mining areas were within the range of areas designated as protected by national governments, and seven percent were within the same range of key biodiversity areas.

Using this metric, 50 million square kilometers of the earth’s land surface is influenced by mining, with 82 percent of mining areas focused on elements needed for renewable energy production.

Elements including lithium, cobalt, and nickel are essential for rechargeable batteries, which are used for power storage in wind and solar projects, as well as in electric cars.

New mines are planned to target these substances, adding to the global surface area covered by mining activities.

Challenging IChemE climate scaremongering

by D.  Wojick, September 2, 2020 in WUWT


The Institution for Chemical Engineers (IChemE) is a prestigious international group of scientists and professionals with over 35,000 members in about 100 countries. IChemE has been conducting what it calls a consultation on its draft Position Statement on Climate Change. This basically means that the members are invited to submit comments. Given that many engineers are skeptical of the climate scare, it will be interesting to see if all of these comments are made public.

The draft statement itself is pure alarmism. They say the science is settled, per the IPCC, and catastrophe looms. Here is the opening paragraph:

“Climate science is established – global climate change is upon us, exacerbated by human activities. IChemE accepts the veracity of the science and its conclusions published by the Intergovernmental Panel on Climate Change (IPCC). To avoid irreparable social, economic and environmental damage, it is essential that we accelerate our efforts to decarbonize our economic systems and stabilize the levels of greenhouse gases in the earth’s atmosphere, if we are to have any chance of limiting the global average temperature rise to 1.5 degrees C, beyond which catastrophic consequences are more likely. Action needs to be global and fair, recognizing the relative differences between regions, both in terms of historic contributions to emissions and vulnerability to the consequences of a warming planet.

Chemical engineers are uniquely placed to take action in the industries that contribute to greenhouse gas emissions to arrest and reverse the damage we humans are doing to the life support systems of our single, shared planet .” (Emphasis added).

Not only do they simply sing the IPCC song, they even get it wrong. Nowhere does the IPCC suggest that 1.5 degrees of warming (with one degree already on their books) is a threshold to catastrophe. In fact the Paris Accord target is still 2.0 degrees. The last sentence may explain IChemE’s fervent catastrophism. Its members are positioned to make huge sums of money doing the engineering to decarbonize the world. After all, CO2 emissions are typically the product of chemical reactions (including combustion).

An Unremarkable Summer

by P. Homewood, September 3, 2020 in NotaLotofPeopleKnowThat


Despite a few warm days in early August, the month as a whole was not unusually hot, a full 1.6C cooler than August 1995, according to the Central England Temperature series. Other hotter Augusts include 1911, 1947 and 1975.

It was even colder than 1736 and 1899.

Summer as whole was even less remarkable, ranking 51st, tied with years such as 1701, 1731 and 1780.

The summers of 1976 and 1826 remain the two hottest on record, well above anything seen since.

https://www.metoffice.gov.uk/hadobs/hadcet/data/download.html

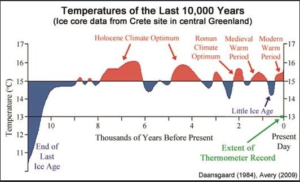
Que nous apprend l’Optimum Climatique Romain?

by A. Préat, 4 septembre 2020 in ScienceClimatEnergie


SCE a plusieurs fois rapporté que la période actuelle de réchauffement n’est pas exceptionnelle, qu’elle fait partie de cycles décennaux à pluriséculaires de refroidissement et réchauffement qui ont lieu dans des fourchettes de température fort modestes, de l’ordre de 0,15°C par 10 ans. SCE a aussi montré que le CO2 tant incriminé dans ces changements, et surtout l’actuel, n’avait pas de raison d’être, ce gaz venant après l’augmentation de température. Le ‘bouton CO2 ‘ à même d’expliquer ou de ‘justifier’ le battage médiatique quasi-quotidien est donc à ‘la remorque’ de la température et, l’hypothèse de l’effet de serre reste avant tout une hypothèse (exemple ici).

Enfin SCE a souvent rappelé (ici et ici) que la concentration atmosphérique de CO2 n’a jamais été aussi basse dans l’histoire géologique de notre planète, qui a connu la plupart du temps des  concentrations jusqu’à 25 fois supérieures au cours du Phanérozoïque (à partir du Cambrien, il y a 541 millions d’années), et même encore bien plus élevées au cours du Précambrien. Nous partirons de ce dernier point, puisque les médias et scientifiques sont toujours  à nous rappeler, de manière assez dramatique, que la teneur actuelle est plus élevée que celle des ‘derniers’ millions d’années (articles médiatiques presque quotidiens, exemple ici parmi une pléthore d’articles). Est-ce bien le cas? et si oui –et toujours pour ces ‘derniers’ millions d’années– quid de la température ?

NuScale SMR receives US design certification approval

by World Nuclear News, September 1, 2020


The US Nuclear Regulatory Commission (NRC) has issued a final safety evaluation report (FSER) for NuScale’s small modular reactor. This is the first-ever FSER to be issued by the NRC for an SMR, and represents the completion of the technical review and approval of the design.


….

The NuScale design uses passive processes such as convection and gravity in its operating systems and safety features to produce about 600 MW of electricity. Twelve modules, each producing 50 MW, are submerged in a safety-related pool built below ground level. The NRC has concluded the design’s passive features “will ensure the nuclear power plant would shut down safely and remain safe under emergency conditions, if necessary”, it said. NuScale has also indicated to NRC it will apply for standard design approval of a version using 60 MW modules, the regulator said. This would require additional NRC review.

About That Sharp Rise in Climate Concern

by Donna Laframboise, September 2, 2020 in BigPicturesNews


Poll sponsors say climate attitudes have been ‘remarkably consistent’ over two decades.

A few days ago, Scientific American reprinted an article straight from Climatewire. Titled Republican Convention Ignored Climate Threat, But Americans’ Attitudes Are Shifting, it says “Polling shows that voter concern about climate change has been growing for years and that it has not diminished as a result of the coronavirus pandemic.” We’re then told about a recent public opinion survey affiliated with Stanford University.

La géologie, une science plus que passionnante … et diverse