
by Tony Brown, February 15, 2020 in WUWT
This is the third examination of Central England Temperatures (CET) in a series that commenced in 2015 and which has charted the recent decline in temperatures from their highest values. The two previous articles in this series are referenced here;
The Rise and Fall of Central England Temperatures; Part 1 covering 2000 to 2015
https://judithcurry.com/2015/11/25/the-rise-and-fall-of-central-england-temperature/
The Rise and Fall of Central England Temperatures; Part 2 covering 2000 to 2017
When referencing any ‘decline’ we need to put that into context against CET’s overall substantial rise in recent decades. The official CET dataset used in this article, which is compiled by the UK Met office is linked here and shown in Figure A);
https://www.metoffice.gov.uk/hadobs/hadcet/
It should be noted that the values between 1538 and 1658 are my own reconstruction and are not used at all in this current paper.
Note: Weather comprises the day to day events that we all experience. Climate is officially the trend of the weather (often temperature and rainfall) taken over a continuous thirty year period. The two terms have sometimes been used in an interchangeable manner here, when a period of more than a year is being examined.
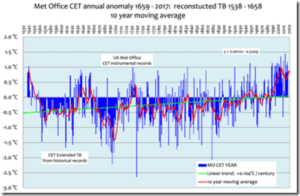
Figure A
According to the Met office; ‘Since 1974 the data have been adjusted to allow for urban warming: currently a correction of -0.2 °C is applied to mean temperatures.’
…