100% consensus on the Anthropogenic Global Warming? A skeptical examination

by S. Point, Aug 27, 2021 in EuropeanScientist


The theory of Anthropogenic Global Warming is regularly presented as benefiting from a solid scientific consensus. What proves the solidity of this consensus? A scientific article, published in 2016  by Cook and colleagues, proposed a synthesis of the work: from the examination of  studies available at that time, the authors showed that the consensus on the reality of climate change was shared by 90%-100% of scientific climate experts. An estimate that we find widely relayed in the media today. In 2019, Powell said he found consensus to be 100%. In this article, we propose to analyze the potential biases in the work of Cook and colleagues, in order to understand how these biases could affect the claimed level of consensus. We also deal with Powell’s recent assert of 100% consensus and enlighten potential cognitive & methodological biases in his approach.

AN UNDENIABLE CONSENSUS?

New IPCC report resurrects the Hockey Stick

by Clintel,  26 Aug 2021


Every IPCC report is accompanied by this kind of ritual dance. The IPCC itself declares in somewhat woolly language (because the IPCC is officially policy neutral) that it is 2 minutes to 12 after which activists, politicians and the media go wild and declare that it is already 2 minutes past 12. This time it was no different.

Now that the media hype around the report has subsided somewhat, it is time to take a calm look at some of the claims in the new IPCC report and also at what the IPCC leaves unsaid or gives less attention to in its Summary for Policy Makers (SPM). I made a first attempt last week in an interview in the popular Studio BLCKBX: “Alarmist IPCC report offers hope” (in Dutch but with English subtitles).

Hockey stick
Back to the opening words in our national news program: “climate change is accelerating”. Most people will let these words pass almost without thinking and will assume “it must be true”. For insiders like me, however, this new conclusion in the IPCC report was downright surprising! The claim is based on a brand new hockey stick graph (the graph at the very top of this article). This graph was the opening graph in the Summary for Policy Makers. So it is a piece of evidence that the IPCC wanted to give a lot of attention. Coupled with yet another graph – with which the IPCC claims to ‘prove’ that the warming since 1850 is mainly due to greenhouse gases – the message was the following: “due to human influence (read: CO2 and other greenhouse gases), the earth has warmed at a rate unprecedented in the last 2000 years”.

Without exaggeration, I would not be writing this article now if, way back in 2004, when I worked at the popular science monthly Natuurwetenschap & Techniek, I had not been asked by my chief editor to write an article about “a hockey stick graph”. It became the beginning of a two-month quest that ended with a long article (English version here) in which the hockey stick graph in the third IPCC report in 2001 was smashed to smithereens by two Canadian researchers (Stephen McInytre and Ross McKitrick). This experience and especially the reactions to it from the field (the unwillingness to acknowledge the criticism of McIntyre and McKitrick) triggered me to start investigating more climate claims, which eventually led to the publication of my book (in Dutch) De Staat van het Klimaat.

The controversy surrounding the hockey stick, especially to be found on Stephen McIntyre’s blog climateaudit.org was a central theme in the climate debate for years. It was ultimately also the cause of climategate, an affair in which thousands of e-mails from prominent IPCC authors were hacked and put online. The emails were examined by various committees of enquiry but were ultimately dismissed as a storm in a teacup. But in my book, I show that several emails do shed a very questionable light on the integrity of the IPCC authors involved.

In any case, there is even a hefty book on this matter written by Andrew Montford and it would be going too far to go into it all again. After climategate, all those closely involved became fed up with the subject. And in the fourth (2007) and fifth (2013) IPCC reports, the IPCC did not publish a prominent hockey stick either. But lo and behold, in the sixth IPCC report the hockey stick is back in all its glory. Or as McInytre puts it: “the IPCC is addicted to hockey sticks”.

Where does this attraction to the hockey stick come from? A long time ago, in 1995, a climate researcher once wrote: we have to get rid of the Medieval Warm Period. There is much historical evidence that around the year 1000 it was also warm on Earth. The Vikings went to Greenland, called it Greenland (and not e.g. Iceland), farmed there and managed to survive for several centuries. This kind of information is unwelcome (for the IPCC) because this warm period suggests that even without CO2 emissions it was warm on Earth in the recent past. How warm exactly? Warmer than now? And if so, what caused the warming? There is no simple answer to these questions, but with the introduction of hockey sticks the IPCC suggests there is. Take a closer look.

PAGES2019: 30-60S

by S. McIntyre, Aug 26, 2021 in ClimateAudit


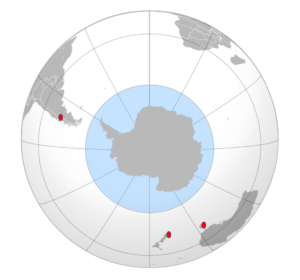
The 30-60N latitude band gets lots of attention in paleoclimate collections – probably more proxies than the rest of the world combined. The 30-60S latitude band is exactly the same size, but it is little studied. It is the world of the Roaring Forties and Furious Fifties, a world that is almost entirely ocean. The only land is New Zealand, Tasmania and the southern coast of Australia facing Antarctica, the tip of South Africa and the narrow part of South America: southern Chile and Argentina. But 96% or so is ocean.


Conclusion

Given that the 60-30S latband is almost entirely ocean, it seems logical that IPCC and PAGES2K should use data from ocean proxies to estimate past temperature in this latitude band. But this isn’t what they’ve done. Instead, they’ve purported to estimate past temperature from a few scattered tree ring chronologies, only one of which reaches earlier than AD1850; and an idiosyncratic singleton pigment series. Ironically, the only 30-60S proxy series in PAGES 2019 that reaches back into the first millennium – the Mount Read, Tasmania tree ring series – was used by Mann et al 1998-1999, Jones et al 1998 and numerous other supposedly “independent” multiproxy studies. Neither of the two series reaching back to the medieval period permit the conclusion that modern period is warmer than medieval period. Caveat: I’m not saying that it isn’t; only that this data doesn’t show it, let alone support the big-bladed HS cited by IPCC. High-resolution alkenone measurements from ocean cores offshore Chile show a consistent decrease in ocean temperatures over the past two millennia that is neither reported nor discussed by IPCC (or PAGES 2019).

To be clear, some of the technical articles on 30-60S ocean core proxies by specialist authors are truly excellent and far more magisterial than the IPCC mustered, in particular, several articles on offshore Chile. Here are a few:

Mohtadi et al, 2007. Cooling of the southern high latitudes during the Medieval Period
and its effect on ENSO link

Killian and Lamy 2012. A review of Glacial and Holocene paleoclimate records from southernmost Patagonia (49-55degS) link

Collins et al 2019. Centennial‐Scale SE Pacific Sea Surface Temperature Variability Over the Past 2,300 Years link

Températures extrêmes et foehn – Démonter le mythe des ‘dômes de chaleur’

by B. Van Vliet-Lanoë et J. Van Vliet, 27 août 2021, in ScienceClimat Energie


EN GUISE DE CONCLUSIONS

Les températures extrêmes observées en juin 2021 en Colombie britannique et dans le Nord-Ouest américain s’expliquent quantitativement et de manière classique par le gradient vertical de 9,8 K/km de l’adiabatique sèche, associé à une baisse d’altitude de 2 km, par l’intermédiaire d’un phénomène de foehn autocatalytique.Les concepts de « dôme de chaleur » et de Global Warming ne sont donc d’aucune utilité pour interpréter les observations. 

De manière plus générale, le phénomène de foehn peut être déclenché par la présence de hautes pressions dans le voisinage d’une chaîne de montagnes. La chaîne des Montagnes Rocheuses est particulièrement sujette à ces phénomènes depuis la Colombie britannique jusqu’à la Californie, mais elle est loin d’être la seule, comme le montre le Tableau 13. Le vent de foehn chaud et sec favorise également les incendies de forêts.

La genèse des hautes pressions peut résulter du passage d’ondes planétaires, mais également du passage d’AMP en provenance du vortex polaire. Ce dernier est particulièrement renforcé lorsque le vent solaire – ou l’activité aurorale qui lui est équivalente – faiblit, comme c’est le cas entre la fin d’un cycle solaire et la montée de l’activité du cycle suivant (Schlamminger 1990). Ceci explique pourquoi les hautes pressions et les vagues de froid sont particulièrement intenses au début du cycle solaire, comme déjà observé entre 2009 et 2013, et comme attendu entre 2019 et 2023. Il est donc probable que les phénomènes extrêmes et les incendies de forêts se poursuivront dans les 2 ou 3 années qui viennent. 

Enfin, les différents phénomènes physiques évoqués se situent non pas dans un contexte de réchauffement, mais bien dans un contexte de refroidissement global qui a démarré avec le 21ème siècle (van Vliet 2020) et que le printemps froid et l’été pluvieux de 2021 rendent particulièrement visible en Belgique, en France, en Angleterre et en Allemagne.

Dans cet article, une analyse quantitative simple nous a conduit à la conclusion que les températures extrêmes et les feux de forêt sont d’origine naturelle : l’homme n’y est donc pour rien, sauf pour la gestion de la couverture végétale et … l’allumage. Il est faux de juger l’homme coupable comme le font systématiquement l’ONU et le GIEC.

Oser prétendre que la transition énergétique améliorera cette situation relève d’une alliance contre nature entre le monde politique, le marketing insensé des énergies renouvelables et la propagande écologiste.