As in years past, the annual rollout of the GISTEMP, NOAA, HadCRUT and Berkeley Earth analyses of the surface temperature record have brought forth many stories about the long term trends and specific events of 2022 – mostly focused on the impacts of the (ongoing) La Niña event and the litany of weather extremes (UK and elsewhere having record years, intense rainfall and flooding, Hurricane Ian, etc. etc.).
But there are a few things that don’t get covered much in the mainstream stories, and so we can dig into them a bit here.
What influence does ENSO really have?
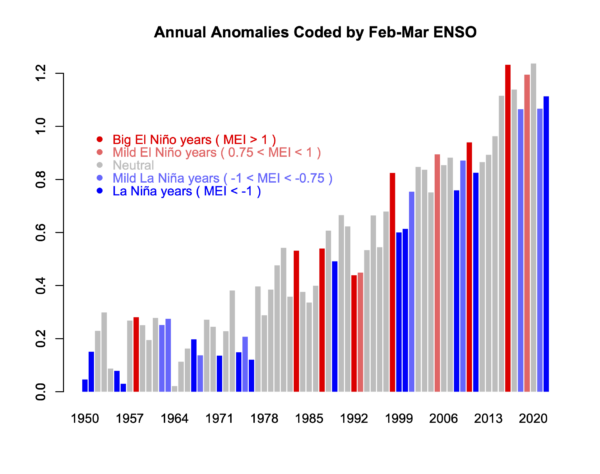
It’s well known (among readers here, I assume), that ENSO influences the interannual variability of the climate system and the annual mean temperatures. El Niño events enhance global warming (as in 1998, 2010, 2016 etc.) and La Niña events (2011, 2018, 2021, 2022 etc.) impart a slight cooling.
GISTEMP anomalies (w.r.t. late 19th C) coded for ENSO state in the early spring.
Consequently, a line drawn from an El Niño year to a subsequent La Niña year will almost always show a cooling – a fact well known to the climate disinformers (though they are not so quick to show the uncertainties in such cherry picks!). For instance, the trends from 2016 to 2022 are -0.12±0.37ºC/dec but with such large uncertainties, the calculation is meaningless. Far more predictive are the long term trends which are consistently (now) above 0.2ºC/dec (and with much smaller uncertainties ±0.02ºC/dec for the last 40 years).
It’s worth exploring quantitatively what the impact is, and this is something I’ve been looking at for a while. It’s easy enough correlate the detrended annual anomalies with the ENSO index (maximum correlation is for the early spring values), and then use that regression to estimate the specific impact for any year, and to estimate an ENSO-corrected time series.
…
…
La géologie, une science plus que passionnante … et diverse