Archives par mot-clé : 2022

The State Of The Climate 2022: ‘No Reason For Alarm’

by Dr B. Pieser, Apr12, 2023 in ClimateChangeDispatch


In his annual review of the state of the global climate, Professor Ole Humlum finds much of interest to readers, but little to alarm them.

There are some climate trends that support claims of climate concern – but many that do not.

For example, Professor Humlum draws attention to the patterns of ocean warming:

“The top of most oceans shows significant warming, but below the top layer, there is very little. Further down you find warming again.

“This suggests that changes in ocean circulation are just as important as carbon-dioxide-driven warming.

Similarly, while the surface of the Antarctic and equatorial oceans has warmed in recent years, the Arctic Ocean has cooled at almost all depths.

“There are far more factors to the climate than carbon dioxide”, says Professor Humlum.

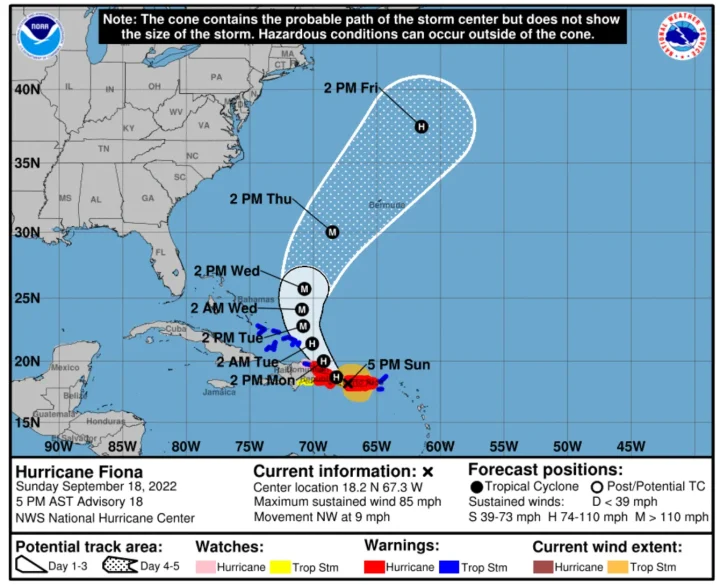
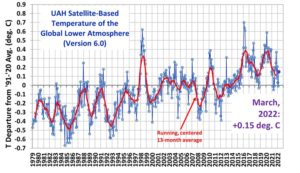
The review covers a wide range of temperature measurements in both ocean and atmosphere, alongside reviews of oceanic oscillations, sea level, snow and ice measurements, and storms.

Ole Humlum: The State of the Climate 2022 (pdf)

The 2022 Hurricane Season

by P. Homewood (pdf), Feb 2023 in GWPF


Contents

About the author iii Executive summary v

  1. Introduction 1
  2. Observational methodologies 1
  3. US landfalling hurricanes 3
  4. Atlantic hurricanes 5
  5. Global trends 7
  6. What do the IPCC say? 8

Notes
About the Global Warming Policy Foundation 10

Executive summary

It is widely believed that hurricanes are getting worse as a consequence of climate change. This belief is fuelled by the media and some politicians, particularly when a bad storm occurs. This be- lief is reinforced because the damage caused by hurricanes is much greater nowadays, thanks to increasing populations in vulnerable coastal areas and greater wealth more generally.

But is this belief correct, or is it a misconception? This study has carefully analysed official data and assessments by hurricane scientists, and finds:

• 2021 and 2022 recorded the lowest number of both hurricanes and major hurricanes glob- ally for any two year period since 1980.

• The apparent long-term increase in the number of hurricanes since the 19th century has been due to changes in observational practices over the years, rather than a real increase.

• Data show no long-term trends in US landfalling hurricanes since the mid-19th century, when systematic records began, either in terms of frequency or intensity.

• Similarly, after allowing for the fact that many hurricanes were not spotted prior to the sat- ellite era, there are no such trends in Atlantic hurricanes either.

  • Globally there are also no trends in hurricanes since reliable records began in the 1970s.
  • Evidence is also presented that wind speeds of the most powerful hurricanes may now be overestimated in comparison to pre-satellite era ones, because of changing methods of meas- urement.

• The increase in Atlantic hurricanes in the last fifty years is not part of a long-term trend, but is simply a recovery from a deep minimum in hurricane activity in the 1970s, associated with the Atlantic Multidecadal Oscillation.

These findings are in line with those of hurricane scientists generally, as well as official bodies such as NOAA and the IPCC.

2022 updates to the temperature records

by Gavin, Jan 13, 2023 in RealClimate


Another January, another annual data point.

As in years past, the annual rollout of the GISTEMP, NOAA, HadCRUT and Berkeley Earth analyses of the surface temperature record have brought forth many stories about the long term trends and specific events of 2022 – mostly focused on the impacts of the (ongoing) La Niña event and the litany of weather extremes (UK and elsewhere having record years, intense rainfall and flooding, Hurricane Ian, etc. etc.).

But there are a few things that don’t get covered much in the mainstream stories, and so we can dig into them a bit here.

What influence does ENSO really have?

It’s well known (among readers here, I assume), that ENSO influences the interannual variability of the climate system and the annual mean temperatures. El Niño events enhance global warming (as in 1998, 2010, 2016 etc.) and La Niña events (2011, 2018, 2021, 2022 etc.) impart a slight cooling.

GISTEMP anomalies (w.r.t. late 19th C) coded for ENSO state in the early spring.

Consequently, a line drawn from an El Niño year to a subsequent La Niña year will almost always show a cooling – a fact well known to the climate disinformers (though they are not so quick to show the uncertainties in such cherry picks!). For instance, the trends from 2016 to 2022 are -0.12±0.37ºC/dec but with such large uncertainties, the calculation is meaningless. Far more predictive are the long term trends which are consistently (now) above 0.2ºC/dec (and with much smaller uncertainties ±0.02ºC/dec for the last 40 years).

It’s worth exploring quantitatively what the impact is, and this is something I’ve been looking at for a while. It’s easy enough correlate the detrended annual anomalies with the ENSO index (maximum correlation is for the early spring values), and then use that regression to estimate the specific impact for any year, and to estimate an ENSO-corrected time series.

It’s temperature prediction time again!

by Net Zero, Jan 13, 2023  NetZeroWatch


  1. Each year, we invite Net Zero Watch readers to enter our annual Global Temperature Prediction Competition, in which we try to outdo the Met Office for the accuracy of our soothsaying.

  2. For 2022, the Met Office predicted an average of between 0.97 and 1.21°C (midpoint 1.09°C) above pre-industrial temperatures for the HadCRUT5 index. However, Net Zero Watch readers, as is their wont, went slightly lower, with the median prediction coming in at 1.00°C, and the mode at 1.03°C. This is all shown in the graph below, alongside the correct value, just announced by the Met Office, of 1.16°C.

As you can see, none of our competition entrants got the right answer. There were three people just above, and three more just below. We’ll put all six names into a hat to pick a winner. We’ll be in contact shortly.

If you’d like to enter the 2023 competition, now is your chance!

As always, the prize is a bottle of hooch of your choice, and a book from the GWPF or Net Zero Watch publication lists.

The Met Office reckons on a relatively sharp warming, suggesting HadCRUT5 will come in at between 1.08 and 1.32°C above pre-industrial (with a central estimate of 1.20°C). That’s 0.04°C above last year’s outturn, which doesn’t seem unreasonable, assuming we come out of the La Nina conditions that prevailed in 2022.

To enter, click here (opens a new site). Good luck!

Europe’s climate warming at twice rate of global average, claims WMO

by P. Homewood, Nov 4, 2022 in NotaLotofPeopleKnowThat


Temperatures in Europe have increased at more than twice the global average in the last 30 years, according to a report from the World Meteorological Organization (WMO).

The effects of this warming are already being seen, with droughts, wildfires and ice melts taking place across the continent. The European State of the Climate report, produced with the EU’s Copernicus service, warns that as the warming trend continues, exceptional heat, wildfires, floods and other climate breakdown outcomes will affect society, economies and ecosystems.

From 1991 to 2021, temperatures in Europe have warmed at an average rate of about 0.5C a decade. This has had physical results: Alpine glaciers lost 30 metres in ice thickness between 1997 and 2021, while the Greenland ice sheet has also been melting, contributing to sea level rise. In summer 2021, Greenland had its first ever recorded rainfall at its highest point, Summit station.

https://www.theguardian.com/environment/2022/nov/02/europes-climate-warming-at-twice-rate-of-global-average-says-report

The WMO is of course another UN organisation, so obviously cannot be trusted. Neither can any of its sources of data, such as NOAA, GISS and Berkeley Earth, which are based around homogenised data.

But what do we know about recent climate trends in Europe?

Greenland Mass Balance

by Andy May, Oct 25, 2022 in WUWT


The following is from Cap Allon’s excellent post here. We are all used to the mainstream media distorting climate science data and analysis, but he has uncovered a case that is beyond the pale. Consider this post a follow up to Dave Middleton’s post earlier the month.

Read on in Cap Allon’s words:

MSM OBFUSCATION

[Greenland’s ‘healthy’ melt season, was obscured across the mainstream media.]

CNN wrote the following in July 20 article: “The amount of ice that melted in Greenland between July 15 and 17 was enough to fill 7.2 million Olympic-sized swimming pools or cover the entire state of West Virginia with a foot of water.”

They even have a quote from cLiMaTe ScIeNtIsT Ted Scambos: “The northern melt this past week is not normal, looking at 30 to 40 years of climate averages. But melting has been on the increase, and this event was a spike in melt.”

CNN is screaming about this period of melting (circled below):

September Arctic Sea Ice Trends

by P. Homewood, Oct 8, 2022 in NotaLotofPeopleKnowThat


We looked at the Arctic sea ice minimum for this year a couple of weeks ago. But the average for September as a whole is much more relevant.

In fact it shows very similar results this year, with average September extent slightly below last year, but otherwise the highest since 2014, and also much greater than in 2007:

https://ocean.dmi.dk/arctic/icecover_30y.uk.php

Note the grossly misleading trend line, loved by all Arctic alarmists! Their trend cannot conceal the fact that the ice extent stopped declining in 2007.

The ice could remain stable for the next century, but DMI’s overall trend line would still show a long term decline decline.

Good News: 2022 Hurricane Season Mild. Bad News: Pressure Pattern Threatens Europe with Hell Winter

by P. Gosselin, Sep 19, 2022 in WUWT


This year’s hurricane season has been unusually quiet. The USA has gotten off easy so far in terms of landfalls and damage, thus once again contradicting all the doomsday scenarios from the climate alarmists.

Mid September is usually the peak of hurricane activity. But right now it’s quiet and there are no threats to the US mainland – for the time being. Here’s the latest update from the National Hurricane Center (NHC):

Potential killer winter on top of acute energy crisis

On another subject, some forecasters have been projecting a milder than normal winter for Europe, which would be welcome with a red carpet due to the continent’s acute energy crisis.

However, Joe notes there are signs this may not be the case. That would mean the coming winter could become – in the current dire energy situation – the Mother of Nightmares: a bitter cold winter with energy outages. In the event of blackouts, which many experts warn have a high chance of occurring, Europe would then be facing a humanitarian and economic crisis on a scale not seen in a very long time.

“Look at what the surface maps are showing,” Bastardi says. “When you have high pressure over Greenland and Iceland, and low pressure over Spain like that, folks, that is an ugly looking situation for the winter. That is similar to 2010/11.”

UAH Global Temperature Update for March, 2022: +0.15 deg. C

by Dr R. Spencer, Apr 4, 2022 in WUWT


The Version 6.0 global average lower tropospheric temperature (LT) anomaly for March, 2022 was +0.15 deg. C, up from the February, 2022 value of -0.01 deg. C.

The linear warming trend since January, 1979 still stands at +0.13 C/decade (+0.12 C/decade over the global-averaged oceans, and +0.18 C/decade over global-averaged land).

Various regional LT departures from the 30-year (1991-2020) average for the last 15 months are:

YEAR MO GLOBE NHEM. SHEM. TROPIC USA48 ARCTIC AUST 
2021 01  0.12  0.34 -0.09 -0.08  0.36  0.49 -0.52
2021 02  0.20  0.32  0.08 -0.14 -0.66  0.07 -0.27
2021 03 -0.01  0.12 -0.14 -0.29  0.59 -0.78 -0.79
2021 04 -0.05  0.05 -0.15 -0.29 -0.02  0.02  0.29
2021 05  0.08  0.14  0.03  0.06 -0.41 -0.04  0.02
2021 06 -0.01  0.30 -0.32 -0.14  1.44  0.63 -0.76
2021 07  0.20  0.33  0.07  0.13  0.58  0.43  0.80
2021 08  0.17  0.26  0.08  0.07  0.32  0.83 -0.02
2021 09  0.25  0.18  0.33  0.09  0.67  0.02  0.37
2021 10  0.37  0.46  0.27  0.33  0.84  0.63  0.06
2021 11  0.08  0.11  0.06  0.14  0.50 -0.43 -0.29
2021 12  0.21  0.27  0.15  0.03  1.62  0.01 -0.06
2022 01  0.03  0.06  0.00 -0.24 -0.13  0.68  0.09
2022 02 -0.01  0.01 -0.02 -0.24 -0.05 -0.31 -0.50
2022 03  0.15  0.27  0.02 -0.08  0.21  0.74  0.02

The full UAH Global Temperature Report, along with the LT global gridpoint anomaly image for March, 2022 should be available within the next several days here.


Germany January Mean Temperatures Falling Since 1988, Contradicting Claims Of Warming

by NoTricksZone, Feb 2, 2022 in WUWT


According to the media and climate alarmists, winters like we used to have in the global cooling days of the 1970s were supposed to be disappearing due to increasing warming from rising CO2.

But that hasn’t really been happening. For example, Stefan Kämpfe at the European Institute for Climate and Energy (EIKE) plotted Germany’s mean January temperature going back to 1988:

Climate Alarmists Conceal Global Temperature Anomaly Measurement Declines Despite Increasing Atmospheric CO2

by L. Hamlin, Jan 17, 2022 in WUWT


OAA published its global climate report for year end 2021 highlighting that its global temperature anomaly measurements showed 2021 being the sixth highest of its recorded measurements. NOAA’s global annual measurement for 2021 was 0.84 degrees C.

NOAA chose to emphasize that the annual 2021 temperature anomaly was in the top ten of its recorded years as follows:

“The year culminated as the sixth warmest year on record for the globe with a temperature that was 0.84°C (1.51°F) above the 20th century average. The years 2013–2021 all rank among the ten warmest years on record.”

What NOAA failed to highlight was that the year-end 2021 global temperature anomaly measurement marked the continuing decline of its global temperature anomaly measurements that have now fallen for the last 6 years since peak year 2016 as shown in their graph below. These declining measurement outcomes make a complete mockery of recent climate alarmists scientifically unsupported politically contrived “climate emergency” propaganda claims.