by Climate Auditor, January 2023
Mauna Loa CO2_vs_temp_2022 June.pdfAtmospheric CO2 concentration
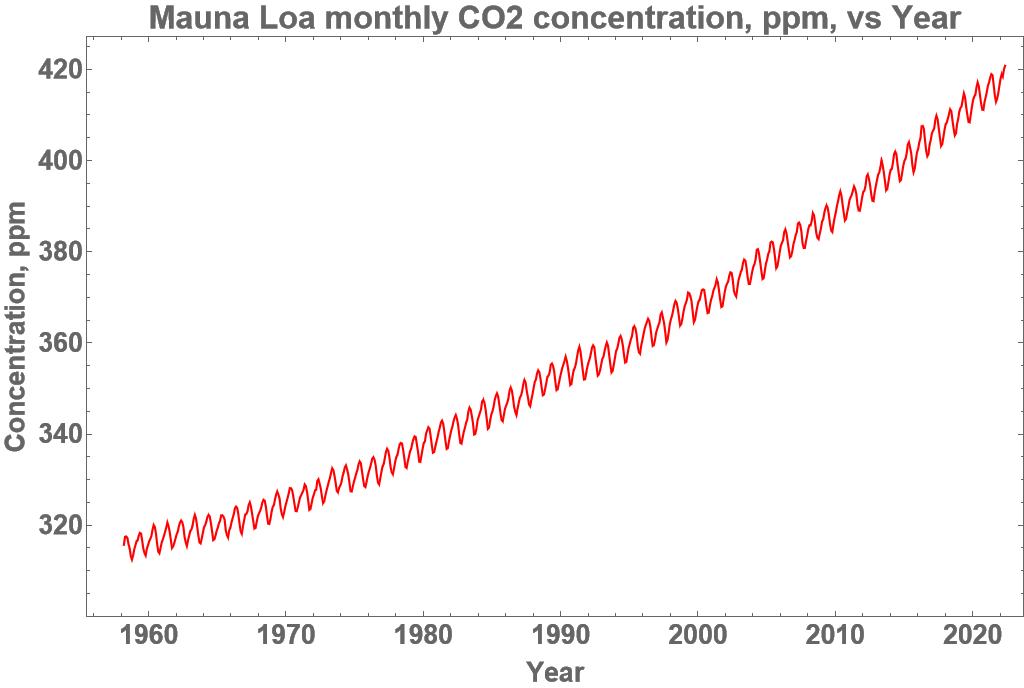
Here in Figure 1 is the monthly atmospheric CO2 concentration measured at the Mauna Loa Observatory, Hawaii, Latitude19.5̊ N, Longitude 155̊ W, elevation 3397m, for the 64 year period from March 1958 to May 2022.

Figure 1. Monthly atmospheric CO2 concentration, Mauna Loa Observatory, Source:[ Ref. 2]
The source file, Ref. 2, lists the data in 10 columns. The columns used here were columns 3 and 4, the date in Excel and decimal format, column 9 being the measured CO2 concentration with missing values in-filled from a smoothed fit to the data and column 10 being the seasonally adjusted measurements again with missing values in-filled.
The monthly CO2 concentration had an average rate of increase over the 64 year period from March 1958 to May 2022 of 1.60 ppm pa. For the 5 year period March 1958 to March 1963 the rate was 0.68 ppm pa and for the 5 year period May 2017 to May 2022 the rate was 2.50 ppm pa, that is, the rate of increase has steadily accelerated over time to be 3.7 times greater than it was 59 years earlier. The range was from a minimum of 312.43 ppm to a maximum of 420.78 ppm.
The amplitude of the seasonal variation was estimated to range from 5.25 ppm to 8.03 ppm, increasing in amplitude over time, in an irregular fashion. The maxima occurred, on average, in early May, which is the beginning of Summer, and the minima in late September, at the end of Summer. The greatest seasonal variation took place between September 2015 and April 2016. This means that the CO2 concentration rose during the cool of Winter and fell during the heat of Summer, which is out of phase with the UN IPCC claim that increased CO2 concentration causes an increase in temperature. Nor does the UN IPCC hypothesis provide an explanation for the steady increase in the rate of increase of the CO2 concentration.
Temperature and CO2 concentration
Here is 522 months of empirical data, showing a distinct lack of a relationship between the Tropics satellite lower troposphere temperature [ Ref.1] and the seasonally adjusted atmospheric CO2 concentration at the Mauna Loa Observatory.
Figure 2. Mauna Loa Observatory, Source: [ Ref. 1] and [ Ref. 2]
Figure 2 shows the monthly satellite lower troposphere temperature for the Tropics zone, 20̊ South to 20̊ North, in blue, and the relevant monthly CO2 concentration in red after removal of the seasonal variation so as to match the residual temperature series. The range for the monthly CO2 concentration is from 335.77 ppm to 418.2 ppm. The range for the Tropics temperature is from -0.99̊ Celsius to +1.15̊ Celsius with respect to a 30 year average base value. The clear and obvious difference between the two raises the possibility that there may be no common causal factor whereby the CO2 concentration drives the temperature as claimed by the UN IPCC.
Calculation of the Ordinary Linear Regression between the two time series gave a Pearson correlation coefficient of 0.462 from the 522 monthly data pairs. This is a measure of the relationship between the background linear trend of each of the time series as shown by an almost identical correlation of 0.463 between the temperature and the time. The correlation between the CO2 concentration and the time was 0.995, that is, the seasonal adjusted CO2 concentration time series was practically a linear trend with respect to time. Any pair of linear trends, no matter what their source, will have a high correlation coefficient of about 1.0 which is necessarily of no causal significance as a background linear trend with respect to time can be calculated for any time series.
…


