“Observations show no significant decline in Arctic sea ice concentration (SIC) since 2012…revealing a negligible trend of -0.4% per decade…” – Wang et al., 2025
Scientists are now acknowledging the sharply declining trend in Arctic sea ice from the mid-1990s to 2010s (-11.3% per decade), as well as the “negligible” or flat trend since 2012 (-0.4% per decade) are both “closely coupled” with natural decadal-scale variations in the North Atlantic Oscillation, the Atlantic Multidecadal Oscilliation, and “enhanced summertime radiation balance associated with an anticyclonic atmospheric circulation pattern.”
In other words, instead of a linear decline in Arctic sea ice coupled with rising greenhouse gas emissions, it is claimed that “approximately half” of the observed Arctic sea ice decline in the modern era can be attributed to internal variability.
The authors of this new study published in Nature Communications further suggest the flattened trend or “slowdown” in sea ice decline will likely persist for the next 10 to 15 years. Consequently, alarmist predictions of an “ice-free” Arctic in the coming decades will have to be put on hold until after the 2030s.
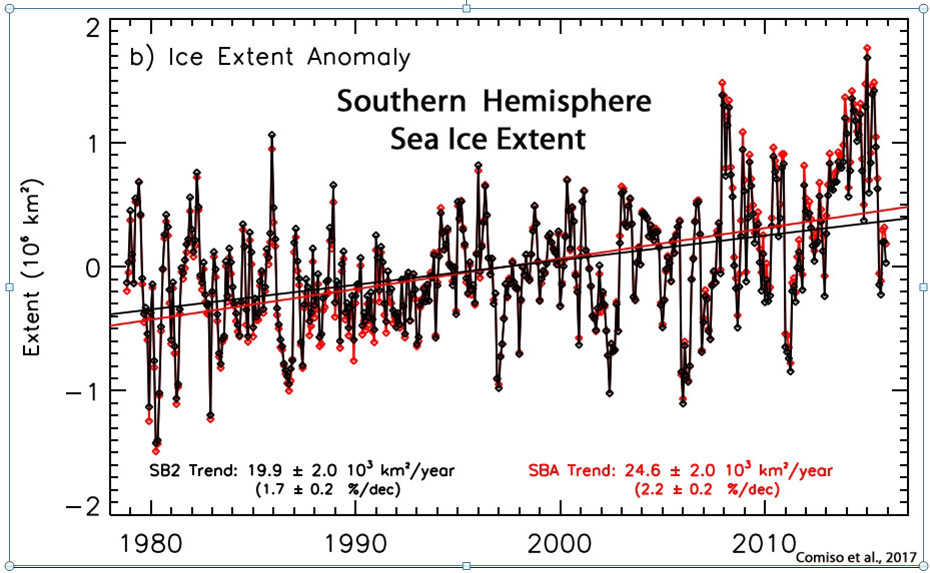
Despite all the claims of a “rapidly warming planet”, we know Antarctic sea ice extent has seen a rather impressive upward trend over the past 40 years, which tells us cooling is more likely at play.
Here’s southern hemisphere sea ice extent chart (up to 2017):
Antarctic sea ice has gained steadily over the past 40 years. Chart: Comiso et al, 2017
It’s not what you’d expect from a CO2-induced warming planet.
In this paper, the 1978–2022 series of northern (NHSI) and southern (SHSI) hemisphere sea ice extent are submitted to singular spectral analysis (SSA). The trends are quasi-linear, decreasing for NHSI (by 58,300 km2/yr) and increasing for SHSI (by 15,400 km2/yr). The amplitude of annual variation in the Antarctic is double that in the Arctic. The semi-annual components are in quadrature. The first three oscillatory components of both NHSI and SHSI, at 1, 1/2, and 1/3 yr, account for more than 95% of the signal variance. The trends are respectively 21 (Antarctic) and 4 times (Arctic) less than the amplitudes of the annual components. We next analyze variations in pole position (PM for polar motion, coordinates m1, m2) and length of day (lod). Whereas the SSA of the lod is dominated by the same first three components as sea ice, the SSA of the PM contains only the 1-yr forced annual oscillation and the Chandler 1.2-yr component. The 1-yr component of NHSI is in phase with that of the lod and in phase opposition with m1, while the reverse holds for the 1-yr component of SHSI. The semi-annual component appears in the lod and not in m1. The annual and semi-annual components of NHSI and SHSI are much larger than the trends, leading us to hypothesize that a geophysical or astronomical forcing might be preferable to the generally accepted forcing factors. The lack of modulation of the largest (SHSI) forced component does suggest an alternate mechanism. In Laplace’s theory of gravitation, the torques exerted by the Moon, Sun, and planets play the leading role as the source of forcing (modulation), leading to changes in the inclination of the Earth’s rotation axis and transferring stresses to the Earth’s envelopes. Laplace assumes that all masses on and in the Earth are set in motion by astronomical forces; more than variations in eccentricity, it is variations in the inclination of the rotation axis that lead to the large annual components of melting and re-freezing of sea-ice.
Posted onDecember 14, 2022| Comments Offon Arctic Report: primary productivity still high & sea ice flatline continues despite warmer temperatures
NOAAs annual Arctic Report Card is, for the most part, a valiant effort to turn good and ambiguous news into harbingers of climate change disaster. Primary productivity is up across most of the region (good news for wildlife) and despite Arctic temperatures being “twice as high” as the rest of the world in recent years, the summer sea ice ‘death spiral’ has failed to materialize.
Oddly, there is no bad news about polar bears (last mention was 2014). However, the media were told that the few hundred sea birds that died this year in the enormous Bering/Chukchi Sea region over the four months of summer in 2022 is a portend of climate change catastrophe–even though the authors of the NOAA report admit they have no conclusive evidence to explain the phenomenon. However, here are also some honest figures that are quite illuminating.
Sea ice
The graph at the bottom of this graphic, spread out rather than bunched up to make changes seem more dramatic, makes it much easier to see the lack of a declining trend in sea ice extent since 2007, and that winter (March) coverage has changed hardly at all.
by P. Homewood, Oct 8, 2022 in NotaLotofPeopleKnowThat
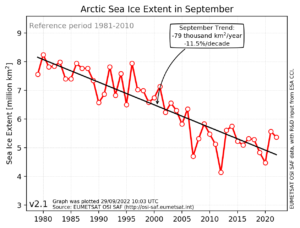
We looked at the Arctic sea ice minimum for this year a couple of weeks ago. But the average for September as a whole is much more relevant.
In fact it shows very similar results this year, with average September extent slightly below last year, but otherwise the highest since 2014, and also much greater than in 2007:
Note the grossly misleading trend line, loved by all Arctic alarmists! Their trend cannot conceal the fact that the ice extent stopped declining in 2007.
The ice could remain stable for the next century, but DMI’s overall trend line would still show a long term decline decline.
La géologie, une science plus que passionnante … et diverse