Study: Northern Greenland Was Ice Free, Forested ~125k Years Ago, Adding 3 Meters To Sea Levels

by Diamond et al. 2021, Apr 27, 2023 in NoTricksZone


During the last interglacial (LIG) 127 to 119k years ago, when CO2 levels were said to be only 275 ppm, Greenland’s Camp Century surface was ice free, vegetated. Today this same site is buried under a 1.4 kilometers-high ice sheet.

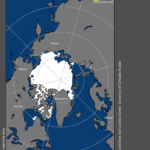
The Arctic was sea ice free during the LIG (Diamond et al., 2021).

China’s Coal Power Building Plans Are Still at a Frenzied Pace

by D. Murtaugh, Apr 24, 2023 in Bloomberg


Provincial governments gave the green light to at least 20.5 gigawatts of new coal in the first quarter, topping the 18.5 gigawatts for all of 2021, Greenpeace said in a new research report. Approvals began to soar last year, to at least 90.7 gigawatts, after a series of economy-crippling power shortages, according to the study.

Greenpeace’s report is the latest in a series of research findings and industry comments highlighting Beijing’s plan to rely on its mainstay fuel as a backstop for reliable and affordable power amid rising global fuel prices and the development of intermittent renewable generation. The government is also leaning on miners to boost coal output to record levels to avoid a reliance on foreign supplies.

“The 2022 coal boom has clearly continued into this year,” said Xie Wenwen, Greenpeace East Asia climate and energy campaigner. Reasons given by governments in approval documents included ensuring safe energy supply, meeting heating demand and stimulating local economic development, Xie said.

see also here : Coal in India 

Massive iceberg discharges during the last ice age had no impact on nearby Greenland, raising new questions about climate dynamics

by WUWT, Apr 24, 2023


CORVALLIS, Ore. – During the last ice age, massive icebergs periodically broke off from an ice sheet covering a large swath of North America and discharged rapidly melting ice into the North Atlantic Ocean around Greenland, triggering abrupt climate change impacts across the globe.

These sudden episodes, called Heinrich Events, occurred between 16,000 and 60,000 years ago. They altered the circulation of the world’s oceans, spurring cooling in the North Atlantic and impacting monsoon rainfall around the world.

But little was known about the events’ effect on nearby Greenland, which is thought to be very sensitive to events in the North Atlantic. A new study from Oregon State University researchers, just published in the journal Nature, provides a definitive answer.

“It turns out, nothing happened in Greenland. The temperature just stayed the same,” said the study’s lead author, Kaden Martin, a fourth-year doctoral candidate in OSU’s College of Earth, Ocean, and Atmospheric Sciences. “They had front-row seats to this action but didn’t see the show.”

Instead, the researchers found that these Heinrich events caused rapid warming in Antarctica, at the other end of the globe.

The researchers anticipated Greenland, in close proximity to the ice sheet, would have experienced some kind of cooling. To find that these Heinrich Events had no discernible impact on temperatures in Greenland is surprising and could have repercussions for scientists’ understanding of past climate dynamics, said study co-author Christo Buizert, an assistant professor in the College of Earth, Ocean, and Atmospheric Sciences.

“If anything, our findings raise more questions than answers,” said Buizert, a climate change specialist who uses ice cores from Greenland and Antarctica to reconstruct and understand the Earth’s climate history. “This really changes how we look at these massive events in the North Atlantic. It’s puzzling that far-flung Antarctica responds more strongly than nearby Greenland.”

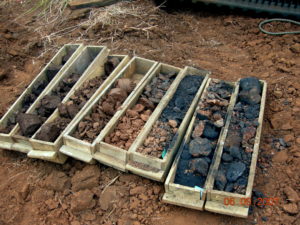
Scientists drill and preserve ice cores to study past climate history through analysis of the dust and tiny air bubbles that have been trapped in the ice over time. Ice cores from Greenland and Antarctica provide important records of Earth’s atmospheric changes over hundreds of thousands of years.

Australia-wide assessment: climate change or instrument change?

by J. Marohasy, April 2023 in WUWT


In the five years following the installation of probes in automatic weather stations (AWS) as they replaced mercury thermometers across Australia, the annual frequency of extremely hot days increased by an average 18.7%.

This new analysis by Perth journalist and climate researcher Chris Gillham makes a mockery of claims by the Bureau that the transition from mercury thermometers to automatic weather stations has had no effect on temperatures, and so there is no need to transcribe or make public the parallel data.

Chris has found that a majority of these AWS stations had an average 62.8% increase in their 99th percentile observations. These are the hottest 1 per cent of days calculated since the start year of each station.

High sea surface temperature in North Atlantic

by Arctic News, Apr 22, 2023


SST World (60S-60N)

On April 20, 2023, sea surface temperatures (between 60°South and 60°North) had been at 21°C or higher for as many as 32 days. Such temperatures are unprecedented in the NOAA record that goes back to 1981.


On April 4, the sea surface temperature in 2023 (black line) was as much as 0.3°C higher than in 2022 (orange line) and we’re only just entering the upcoming El Niño.


SST North Atlantic

The situation is especially critical in the North Atlantic. Vast amounts of ocean heat in the North Atlantic are moving toward the Arctic, threatening to cause rapid melting of Arctic sea ice and thawing of permafrost. Last year, North Atlantic sea surface temperatures reached a record high of 24.9°C in early September and, as illustrated by the image below, the North Atlantic sea surface temperature on April 20 was as much as 0.5°C higher in 2023 (black) than in 2022 (orange).

As we’re moving into the upcoming El Niño, the Arctic Ocean can be expected to receive more and more heat over the next few years, i.e. more heat from direct sunlight, more heat from rivers, more heat from heatwaves and more ocean heat from the Atlantic Ocean and the Pacific Ocean.

Earth Day At 52: None of the eco-doomsday predictions have come true

by NetZeroWatch, Apr 22, 2023


From predicting ecological collapse and the end of civilization to warnings that the world is running out of oil, all environmental doomsday predictions of the first Earth Day in 1970 have turned out to be flat out wrong.

More than three decades before Greta Thunberg was born — the Swedish environmental activist on climate change — more than 20 million Americans participated in the first Earth Day on April 22, 1970.

We now look back at quotes from Earth Day, Then and Now,” by Ronald Bailey of the spectacularly wrong apocalyptic predictions from Earth Day 1970.

Considering the current doomsday predictions scaremonger activists are verbalizing about global warming that will result in the demise of civilization within the next decade, many of those unscientific 1970 predictions are being reincarnated on today’s social and news media outlets.

Many of the same are being regurgitated today, but the best prediction from the first earth day five decades ago, yes 50 years ago, was that the “the pending ice age as earth had been cooling since 1950 and that the temperature would be 11 degrees cooler by the year 2000”.

The 1970’s were a lousy decade. Embarrassing movies and dreadful music reflected the national doomsday mood following an unpopular war, endless political scandals, and a faltering economy.

The first Earth Day was celebrated in 1970 — okay, “celebrated” doesn’t capture the funereal tone of the event. The events (organized in part by then hippie and now convicted murderer Ira Einhorn) predicted death, destruction and disease unless we did exactly as progressives commanded.data.

Skepticism Of Human-Caused Climate Change Rising Globally

by C. Morrison, Apr 21, 2023 in ClimateChangeDispatch


Skepticism about human-caused climate change continues to increase around the world.

A recent poll conducted by a group within the University of Chicago found that belief in humans causing all or most climate change had slumped in America to 49% from the 60% level recorded just five years ago. [emphasis, links added]

Similar falls have been recorded elsewhere, with a recent IPSOS survey covering two-thirds of the world’s population revealing that nearly four people in every 10 believe climate change is mainly due to natural causes.

Perhaps the most surprising statistic from the Energy Policy Institute at the University of Chicago (EPIC) survey is that 70% of Americans are unwilling to spend more than $2.50 a week to combat climate change.

Nearly four in 10 Americans said they were unwilling to pay a couple of dimes.

Despite decades of relentless green doomsday agitprop designed to corral populations into living under a collectivist Net Zero-ordered society, it appears that the vast majority of Americans are unwilling to pay even the chump change in their back pockets to stop climate change.

Surveys such as EPIC and IPSOS speak to the fundamental flaw in the ‘settled’ science surrounding the suggestion that humans burning fossil fuels are causing the climate to break down.

The hypothesis is unproven – not a single science paper provides conclusive proof.

Natural causes and the proposition that carbon dioxide becomes ‘saturated’ beyond certain atmospheric levels are more convincing explanations for scientific observations.

Fears that mainstream climate science is heavily corrupted by faulty data, pseudoscientific modeling, and outright political cherry-picking are becoming more widespread.


Are ENSO Regime Changes Connected To Major Climate Shifts? Are We Tipping To Cooling?

by P. Gosselin, Apr 19, 2023 in NoTricksZone


We’ve had a La Niña for nearly three years. But now it has officially ended, and ENSO has moved into its neutral phase, the “La Nada”.[1] The La Niña event lasted three winters in a row, something that has only occurred twice before in modern times: 1973–1976 and 1998–2001. Both of these followed in response to a very strong El Niño.

The La Niña that has now ended, on the other hand, came after the more neutral winter of 2019/20.

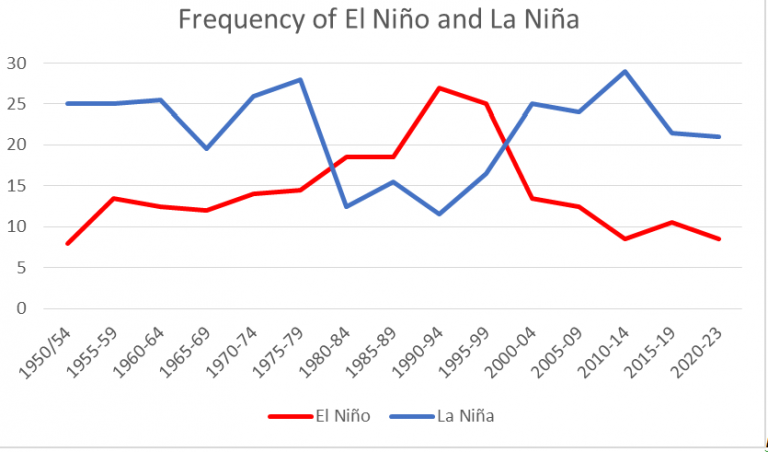
Figure 1. Number of months with each ENSO phase for five-year periods from 1950 – 2023

The number of months that we have had each ENSO phase in the last 74 years is shown in Figure 1. The La Niñas are more frequent than the El Niños. Interestingly, the opposite was true during the rapid warming we had from 1975 – 1999, when El Niños were more common. But then it reverts back again around 1998/99. Is there a pattern here?

It is established in climate science that the climate underwent a profound shift in 1976/77, related to the ocean currents.[2] In IPCC AR4, they write: “The 1976–1977 climate shift in the Pacific, associated with a phase change in the PDO from negative to positive, was associated with significant changes in ENSO evolution.” The Pacific Decadal Oscillation (PDO) shifted from a ‘cold’ to a ‘warm’ phase during these two years.[3] The ENSO also became dominated by the El Niño phase, which is characterized by warmer temperatures.[4] These changes affected the global climate, and a rapid warming began.

But what happened in the years just before 2000? As seen in Figure 1, ENSO reverts to being dominated by the ‘colder’ La Niña at that time.

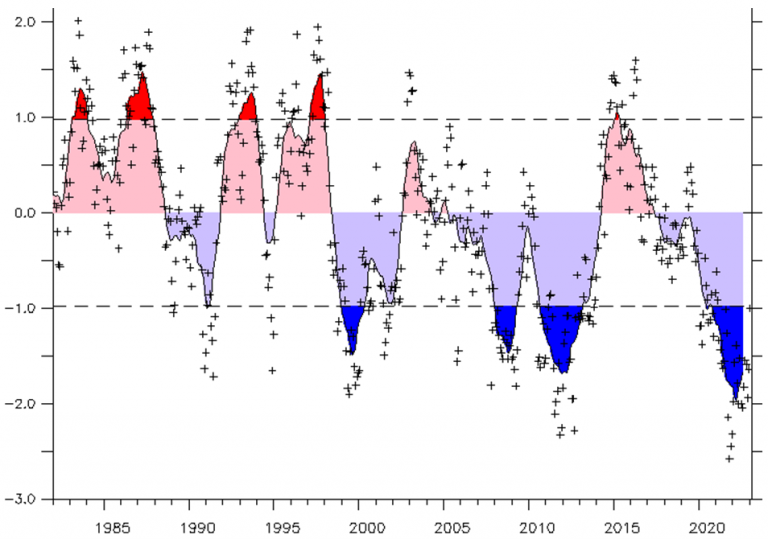
Figure 2. The PDO index according to NOAA/ESRL.

Interestingly, the PDO also reverts to its cold phase in 1998–1999.

Are we seeing a shift to a colder phase in the climate here?

Australia warned of ‘over-mining’ risk in race to secure minerals needed for clean energy

by J. Barrett, May 3, 2023 in TheGuardian


“The thinking error that makes people susceptible to climate change denial”

by E. Worrall, May 4, 2023 in WUWT


“… Climate change deniers simplify the spectrum of possible scientific consensus into two categories: 100% agreement or no consensus at all. If it’s not one, it’s the other. …”

The thinking error that makes people susceptible to climate change denial

Published: May 2, 2023 10.13pm AEST
Jeremy P. Shapiro
Adjunct Assistant Professor of Psychological Sciences, Case Western Reserve University

Cold spells often bring climate change deniers out in force on social media, with hashtags like #ClimateHoax and #ClimateScam. Former President Donald Trump often chimes in, repeatedly claiming that each cold snap disproves the existence of global warming.

From a scientific standpoint, these claims of disproof are absurd. Fluctuations in the weather don’t refute clear long-term trends in the climate.

Yet many people believe these claims, and the political result has been reduced willingness to take action to mitigate climate change.

Why are so many people susceptible to this type of disinformation? My field, psychology, can help explain – and help people avoid being misled.

The allure of black-and-white thinking

Close examination of the arguments made by climate change deniers reveals the same mistake made over and over again. That mistake is the cognitive error known as black-and-white thinking, also called dichotomous and all-or-none thinking. As I explain in my book “Finding Goldilocks,” black-and-white thinking is a source of dysfunction in mental health, relationships – and politics.

Climate change deniers simplify the spectrum of possible scientific consensus into two categories: 100% agreement or no consensus at all. If it’s not one, it’s the other.

Read more: https://theconversation.com/the-thinking-error-that-makes-people-susceptible-to-climate-change-denial-204607

‘Less ice means more conflicts with polar bears’ narrative not supported by scientific evidence

by S. Crockford, Apr 18, 2023 in WUWT


In another failed prediction, a new study on the number of polar bears killed in self-defense in Svalbard, Norway did not find the expected correlation with lack of sea ice or more tourists (Vongraven et al. 2023). Contrary to expectations, fewer bears were actually killed in self-defence as sea ice declined between 1987 and 2019.

Money Quote from the abstract:

…ice cover had no significant impact on the odds for a [polar bear] kill.”

It seems the warning from polar bear specialist Andrew Derocher a few months ago was just plain wrong:

“Poor ice conditions for polar bears at Svalbard this year. Low ice will make tough hunting conditions this coming spring. Time to plan for more human-bear conflicts unless conditions change.” [13 Feb 2023 tweet, my bold]

From the Discussion section of the Vongraven paper (pg. 9), my bold:

More bears on land for longer periods during which more people were accessing the same habitats could have been expected to increase the number of bear-human interactions, and the number of bears killed in defence of life and property. Despite a positive relationship between number of tourists and number of kills at a given time, the total numbers of bears killed did not increase over the years of the study and per-capita kills strongly declined. … This overall reduction in kills, despite greatly reduced sea ice habitat availability and more polar bears spending more time on land, may reflect success of the Svalbard Environmental Act of 2001.”

Nice save there, at the end. Hey, this wasn’t a failure of our prediction that loss of sea ice due to global warming would cause more polar bears to be killed because they attacked people, it’s a resounding victory for a law prohibiting people “seeking out” polar bears! As noted in the next two sentences:

Earth’s Mean Annual Temp Was Warmer 31,000 Years Ago… North Pole 22°C Warmer

by K. Richard, Apr 18, 2023 in ClimateChangeDispatch


Earth’s average annual temperature fluctuated by as much as 35°C (at high latitudes) from one millennial-scale period to the next during the last glacial period.

A recently-published 2-part study (Smul′skii, 2022a and 2022b) utilizes established orbital and insolation data to calculate Earth’s average temperature today (0 k years ago), 14.4°C, and at 25°N, 45°N, 65°N, 80°N, 0°, -25°S, -45°S, -65°S, and -80°S during 3 paleo epochs: 15.9 k years ago, 31.3 k years ago, and 46.4 k years ago. [emphasis, links added]

The Global Annual Temperature Of Earth: 14.4°C – The Same As A Century Ago

Consistent with dozens of other calculations, Smul′skii (2022a) determined the mean annual temperature of the modern period, which includes 1991-2018, ranges between 14.07 and 14.41°C.

What Is A 1000 Year Flood?

by P. Homewood, Apr 18, 2023 in NotaLotofPeopleKnowThat


We’ve all heard the terminology. An extreme event happens — a flood or heat wave — and soon after it is characterized as a “1,000-year event” (or it doesn’t have to be 1,000, it could be any number). This week I watched one of the world’s most visible climate scientists, Michael E. Mann, go on national TV and in process show that he had no idea what the concept actually means.

Let’s start by correcting that climate scientist who expressed a popular misconception (about which climate scientists should know better). A 1,000-year flood does not refer to a level of flooding that comes around every 1,000 years.

CO2 Budget Model Update Through 2022: Humans Keep Emitting, Nature Keeps Removing

by Roy Spencer, Apr 14, 2023 in WUWT


This is an update of my CO2 budget model that explains yearly Mauna Loa atmospheric CO2 concentrations since 1959 with three main processes:

  1. an anthropogenic source term, primarily from burning of fossil fuels
  2. a constant yearly CO2 sink (removal) rate of 2.05% of the atmospheric “excess” over 295 ppm
  3. an ENSO term that increases atmospheric CO2 during El Nino years and decreases it during La Nina years

The CO2 Budget Model

I described the CO2 budget model here. The most important new insight gained was that the model showed that the CO2 sink rate has not been declining as has been claimed by carbon cycle modelers after one adjusts for the history of El Nino and La Nina activity.

If the sink rate was really declining, that means the climate system is becoming less able to remove “excess” CO2 from the atmosphere, and future climate change will be (of course) worse than we thought. But I showed the declining sink rate was just an artifact of the history of El Nino and La Nina activity, as shown in the following figure (updated through 2022).

More on Cloud Reduction. CO2 is innocent but Clouds are guilty.

by C. Blaisdell, 15 Apr 2023, in WUWT


Abstract

This is a continuation of previous papers (1) and (2) on Cloud Reduction.  Further analysis of cloud data has revealed four new observations:

  1.  Mount Pinatubo ash in the atmosphere and Amazonia deforestation may be seen in the cloud data.
  2. A correlation of measured “Temperature – Dew point Temperature”, T-Td, to Cloud Cover was found.
  3. The Temperature – Dew point Temperature variable suggests Cloud Reduction has been going on before 1975.
  4. A simple model shows that Clouds either by reduced Cloud Fraction, decreased Cloud Albedo (lower reflectivity), or both can account for most of the observed Radiation and the associated Global Warming, GW.

CO2 is innocent but Clouds are guilty.

Introduction

Climate change leaves a multi variable data finger print in the Atmosphere that is useful in drawing conclusions and testing theories.  The first of these finger prints is shown in Figure 1 where Cloud Cover, Temperature, Specific Humidity, and Relative Humidity (ground and 850mb) are shown on the same time scale.  None of Figure 1 graphs is a flat line any theory on GW should account for all these observations.  Figure 1 is NOAA data from “NOAA Physical Science Laboratory”, (3) average Northern and Southern Hemisphere.  In Figure 1 note that relative humidity at 1000mb is much less sensitive than the relative humidity at 850mb(where cumulus cloud are).  Cloud Data is from Climate Explorer, (11)

Another data finger-print data set is shown in Figure 2 from “Met Office Climate Dashboard” (“HadISDH” data), (4)  (station and buoy data).  Note that the Met Data has a much better relative humidity correlation.  The relative humidity is significant variable in the Dew Point temperature calculation, Figure 2 (e).