by C. Xing & F. Liu, Jan 2023 in InnovativeGeoscience
The devastating flood of 2020 along the Yangtze River serves as a painful reminder of the 1991 East China’s largest flood. The latter event profoundly impacted the Yangtze-Huaihe River basins (YHRBs), causing extensive damage to both human lives and property1. The flood engulfed numerous villages and cities across seven provinces in East China, affecting over 15,000,000 hectares of farmland and approximately 100 million people. In response, millions of individuals in Anhui and Jiangsu provinces were forced to evacuate, with some seeking refuge on the banks of the Huaihe River. Gaining a comprehensive understanding of the contributing factors to this historically significant flood will enhance our ability to predict the East Asian summer monsoon and mitigate related climate disasters. Over the past three decades, this pursuit has been a persistent challenge1,2,3.
The 1991 East China flood was attributed to prominent intraseasonal oscillations, as evidenced by three episodes of heavy rain occurring from mid-May to mid-July over the YHRBs2, primarily linked to the persistent Meiyu front during early July1. The stable western Pacific subtropical high (WPSH), which plays a crucial role in influencing the East Asian monsoon by altering the convergence of southeasterly and southwesterly, provided substantial support for the prolonged existence of the Meiyu front in 19911; However, the reason behind the prolonged stability of the WPSH during that specific period remains a mystery.
No internal climate variability modes were reported to be in their most flood-favorable conditions during 1991, and the effect of external forcing on this flood disaster was not taken into consideration at all. Half a month before the flood, the Mount Pinatubo (located at 120.4ºE, 15.1ºN) in Luzon, the Philippines, explosively erupted on June 15th, 1991, which later is known as one of the strongest volcanic eruption in the past century. This eruption released approximately 20 Tg of SO2 into the tropical stratosphere4, which can form stratospheric aerosol that impact the global radiative balance. The stratospheric volcanic aerosol acts as a major forcing on the climate by cooling the global surface and slowing down the water cycle on annual to decadal timescales5. However, it remains unclear whether explosive volcanic eruptions have short-term impacts on the climate, particularly on the intraseasonal timescale.
…
by C. Blaisdell, 15 Apr 2023, in WUWT
Abstract
This is a continuation of previous papers (1) and (2) on Cloud Reduction. Further analysis of cloud data has revealed four new observations:
- Mount Pinatubo ash in the atmosphere and Amazonia deforestation may be seen in the cloud data.
- A correlation of measured “Temperature – Dew point Temperature”, T-Td, to Cloud Cover was found.
- The Temperature – Dew point Temperature variable suggests Cloud Reduction has been going on before 1975.
- A simple model shows that Clouds either by reduced Cloud Fraction, decreased Cloud Albedo (lower reflectivity), or both can account for most of the observed Radiation and the associated Global Warming, GW.
CO2 is innocent but Clouds are guilty.
Introduction
Climate change leaves a multi variable data finger print in the Atmosphere that is useful in drawing conclusions and testing theories. The first of these finger prints is shown in Figure 1 where Cloud Cover, Temperature, Specific Humidity, and Relative Humidity (ground and 850mb) are shown on the same time scale. None of Figure 1 graphs is a flat line any theory on GW should account for all these observations. Figure 1 is NOAA data from “NOAA Physical Science Laboratory”, (3) average Northern and Southern Hemisphere. In Figure 1 note that relative humidity at 1000mb is much less sensitive than the relative humidity at 850mb(where cumulus cloud are). Cloud Data is from Climate Explorer, (11)
Another data finger-print data set is shown in Figure 2 from “Met Office Climate Dashboard” (“HadISDH” data), (4) (station and buoy data). Note that the Met Data has a much better relative humidity correlation. The relative humidity is significant variable in the Dew Point temperature calculation, Figure 2 (e).
by Bud Bromley, May 20, 2022 in budbromley
Abstract
Digital signal processing technology was used to analyze daily carbon dioxide data from the joint NOAA – Scripps Oceanographic Institution’s Global Monitoring Laboratory (MLO). The period surrounding the 1991 eruption of the Pinatubo volcano was rigorously analyzed for slope and acceleration of net global average atmospheric CO2 concentration and found to be consistent with the theory that Henry’s Law, the Law of Mass Action, and Le Chatelier’s principle control net global average atmospheric CO2 concentration rather than human-produced CO2 emissions. Background and theory are explained. A method of using common physics and math for a novel purpose is presented to compare natural CO2emission or absorption with human-produced CO2 emission. The claim that human-produced CO2 emission is causing increasing global CO2 concentration and climate change is shown to be without scientific merit.
Key words: carbon, CO2, climate, warming, Impulse, Pinatubo, Henry’s Law, Mauna Loa
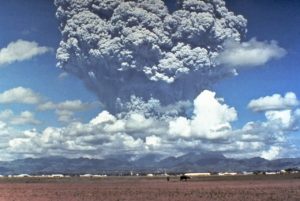
Figure 1. Photo of Pinatubo eruption by Dave Harlowe, USGS. Public domain
…
La géologie, une science plus que passionnante … et diverse
