Australia-wide assessment: climate change or instrument change?

by J. Marohasy, April 2023 in WUWT


In the five years following the installation of probes in automatic weather stations (AWS) as they replaced mercury thermometers across Australia, the annual frequency of extremely hot days increased by an average 18.7%.

This new analysis by Perth journalist and climate researcher Chris Gillham makes a mockery of claims by the Bureau that the transition from mercury thermometers to automatic weather stations has had no effect on temperatures, and so there is no need to transcribe or make public the parallel data.

Chris has found that a majority of these AWS stations had an average 62.8% increase in their 99th percentile observations. These are the hottest 1 per cent of days calculated since the start year of each station.

High sea surface temperature in North Atlantic

by Arctic News, Apr 22, 2023


SST World (60S-60N)

On April 20, 2023, sea surface temperatures (between 60°South and 60°North) had been at 21°C or higher for as many as 32 days. Such temperatures are unprecedented in the NOAA record that goes back to 1981.


On April 4, the sea surface temperature in 2023 (black line) was as much as 0.3°C higher than in 2022 (orange line) and we’re only just entering the upcoming El Niño.


SST North Atlantic

The situation is especially critical in the North Atlantic. Vast amounts of ocean heat in the North Atlantic are moving toward the Arctic, threatening to cause rapid melting of Arctic sea ice and thawing of permafrost. Last year, North Atlantic sea surface temperatures reached a record high of 24.9°C in early September and, as illustrated by the image below, the North Atlantic sea surface temperature on April 20 was as much as 0.5°C higher in 2023 (black) than in 2022 (orange).

As we’re moving into the upcoming El Niño, the Arctic Ocean can be expected to receive more and more heat over the next few years, i.e. more heat from direct sunlight, more heat from rivers, more heat from heatwaves and more ocean heat from the Atlantic Ocean and the Pacific Ocean.

Earth Day At 52: None of the eco-doomsday predictions have come true

by NetZeroWatch, Apr 22, 2023


From predicting ecological collapse and the end of civilization to warnings that the world is running out of oil, all environmental doomsday predictions of the first Earth Day in 1970 have turned out to be flat out wrong.

More than three decades before Greta Thunberg was born — the Swedish environmental activist on climate change — more than 20 million Americans participated in the first Earth Day on April 22, 1970.

We now look back at quotes from Earth Day, Then and Now,” by Ronald Bailey of the spectacularly wrong apocalyptic predictions from Earth Day 1970.

Considering the current doomsday predictions scaremonger activists are verbalizing about global warming that will result in the demise of civilization within the next decade, many of those unscientific 1970 predictions are being reincarnated on today’s social and news media outlets.

Many of the same are being regurgitated today, but the best prediction from the first earth day five decades ago, yes 50 years ago, was that the “the pending ice age as earth had been cooling since 1950 and that the temperature would be 11 degrees cooler by the year 2000”.

The 1970’s were a lousy decade. Embarrassing movies and dreadful music reflected the national doomsday mood following an unpopular war, endless political scandals, and a faltering economy.

The first Earth Day was celebrated in 1970 — okay, “celebrated” doesn’t capture the funereal tone of the event. The events (organized in part by then hippie and now convicted murderer Ira Einhorn) predicted death, destruction and disease unless we did exactly as progressives commanded.data.

Skepticism Of Human-Caused Climate Change Rising Globally

by C. Morrison, Apr 21, 2023 in ClimateChangeDispatch


Skepticism about human-caused climate change continues to increase around the world.

A recent poll conducted by a group within the University of Chicago found that belief in humans causing all or most climate change had slumped in America to 49% from the 60% level recorded just five years ago. [emphasis, links added]

Similar falls have been recorded elsewhere, with a recent IPSOS survey covering two-thirds of the world’s population revealing that nearly four people in every 10 believe climate change is mainly due to natural causes.

Perhaps the most surprising statistic from the Energy Policy Institute at the University of Chicago (EPIC) survey is that 70% of Americans are unwilling to spend more than $2.50 a week to combat climate change.

Nearly four in 10 Americans said they were unwilling to pay a couple of dimes.

Despite decades of relentless green doomsday agitprop designed to corral populations into living under a collectivist Net Zero-ordered society, it appears that the vast majority of Americans are unwilling to pay even the chump change in their back pockets to stop climate change.

Surveys such as EPIC and IPSOS speak to the fundamental flaw in the ‘settled’ science surrounding the suggestion that humans burning fossil fuels are causing the climate to break down.

The hypothesis is unproven – not a single science paper provides conclusive proof.

Natural causes and the proposition that carbon dioxide becomes ‘saturated’ beyond certain atmospheric levels are more convincing explanations for scientific observations.

Fears that mainstream climate science is heavily corrupted by faulty data, pseudoscientific modeling, and outright political cherry-picking are becoming more widespread.


Are ENSO Regime Changes Connected To Major Climate Shifts? Are We Tipping To Cooling?

by P. Gosselin, Apr 19, 2023 in NoTricksZone


We’ve had a La Niña for nearly three years. But now it has officially ended, and ENSO has moved into its neutral phase, the “La Nada”.[1] The La Niña event lasted three winters in a row, something that has only occurred twice before in modern times: 1973–1976 and 1998–2001. Both of these followed in response to a very strong El Niño.

The La Niña that has now ended, on the other hand, came after the more neutral winter of 2019/20.
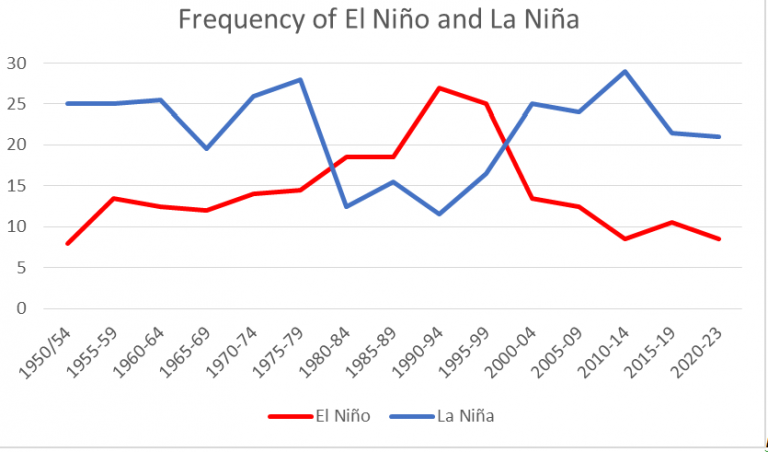
Figure 1. Number of months with each ENSO phase for five-year periods from 1950 – 2023

The number of months that we have had each ENSO phase in the last 74 years is shown in Figure 1. The La Niñas are more frequent than the El Niños. Interestingly, the opposite was true during the rapid warming we had from 1975 – 1999, when El Niños were more common. But then it reverts back again around 1998/99. Is there a pattern here?

It is established in climate science that the climate underwent a profound shift in 1976/77, related to the ocean currents.[2] In IPCC AR4, they write: “The 1976–1977 climate shift in the Pacific, associated with a phase change in the PDO from negative to positive, was associated with significant changes in ENSO evolution.” The Pacific Decadal Oscillation (PDO) shifted from a ‘cold’ to a ‘warm’ phase during these two years.[3] The ENSO also became dominated by the El Niño phase, which is characterized by warmer temperatures.[4] These changes affected the global climate, and a rapid warming began.

But what happened in the years just before 2000? As seen in Figure 1, ENSO reverts to being dominated by the ‘colder’ La Niña at that time.
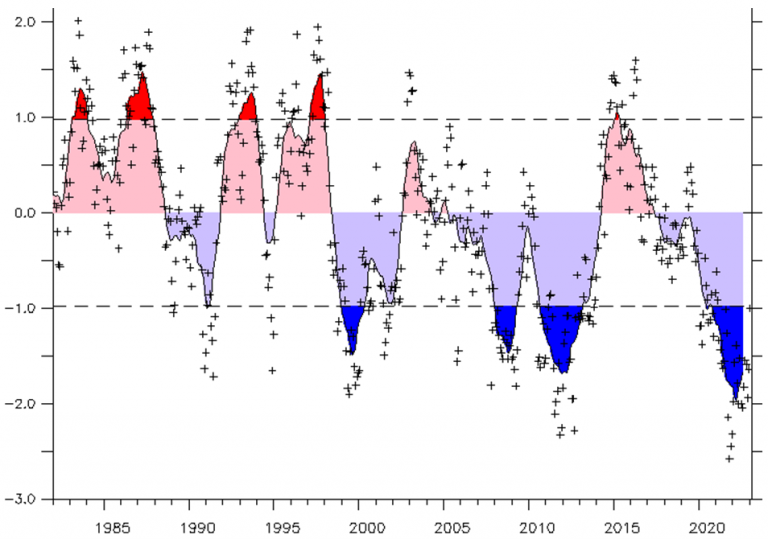
Figure 2. The PDO index according to NOAA/ESRL.

Interestingly, the PDO also reverts to its cold phase in 1998–1999.

Are we seeing a shift to a colder phase in the climate here?