by WUWT, 2025
…

by A. Watts, July 31, 2025 in WUWT
Honestly, I never thought I’d see the day. To quote Mr. FOIA from ClimateGate, “A miracle has occurred.”
Yesterday’s release of the DOE’s A Critical Review of Impacts of Greenhouse Gas Emissions on the U.S. Climate is a watershed moment in the ongoing debate over climate policy in America. Why? Because for the first time, a major U.S. government agency—on official letterhead and with a blue-ribbon cast of authors (John Christy, Judith Curry, Steven Koonin, Ross McKitrick, and Roy Spencer)—has published an open challenge to the central claims, data handling, and even the motivations behind mainstream climate science and policy.
This isn’t just another technical report. It is a systematic rebuke of accepted climate “wisdom,” and it does so with unusual clarity, scientific rigor, and (at times) a sense of humor often absent in climate documents. Most importantly, it directly confronts the exaggerated and politicized rhetoric that has dominated headlines for decades.
The Executive Summary from the DOE web page:
This report:
What Makes This Report Unique?
…
by J. Curry, July 31, 2025 in WUWT
Climate science is baaaack
Energy Secretary Chris Wright has commissioned a new climate assessment report:
A Critical Review of Impacts of Greenhouse Gas Emissions on the U.S. Climate
From the Secretary’s Foreword:
What I’ve found is that media coverage often distorts the science. Many people—even well-meaning ones—walk away with a view of climate change that is exaggerated or incomplete. To provide clarity, I asked a diverse team of independent experts to summarize the current state of climate science, with a focus on how it relates to the United States.
To correct course, we need open, respectful, and informed debate. That’s why I’m inviting public comment on this report. Honest scrutiny and scientific transparency should be at the heart of our policymaking.
Climate Working Group (CWG)
These reports were authored by the DOE Climate Working Group (CWG). Members of the Climate Working Group are: [link to biosketches ]
The origins of the Group and rationale for selecting us are described in Secretary Wright’s Foreword:
To provide clarity, I asked a diverse team of independent experts to summarize the current state of climate science, with a focus on how it relates to the United States. I didn’t select these authors because we always agree—far from it. In fact, they may not always agree with each other. But I chose them for their rigor, honesty, and willingness to elevate the debate. I exerted no control over their conclusions. What you’ll read are their words, drawn from the best available data and scientific assessments.
—— Disclaimer: the remainder of the text in this blog post reflects JC’s personal impressions/analysis and not that of the CWG.
…
by A. Watts, July 29, 2025 in WUWT
Today’s decision by the Environmental Protection Agency to remove the Carbon Dioxide Endangerment Finding represents a pivotal shift in America’s approach to climate policy—one rooted in evidence, not ideology. For years, this “finding” has served as the legal justification for an array of costly, far-reaching regulations targeting everything from our nation’s power plants to the cars we drive and the energy bills we pay. Its removal is a direct response to mounting evidence that the basis for this rule was always more about speculative modeling and political maneuvering than sound science. Watch the announcement here:
…
…
…
by P. Gosselin, July 25, 2025 in NoTricksZone
We remember: by mid-2023, the data on global temperatures had shown a very marked increase. It had gotten warmer globally quite quickly, by an incredible 0.5°C compared to 2022. This led to a new record for the year being announced in 2024. The German public television Tagesschau (and many other media) did so in great detail.
The whole (climate) world asked about the cause. The Tagesschau correctly concluded that the (rather mediocre) El Nino could only make a very small contribution in the second half of 2023. Looking at the temporal change, the rise in global temperatures occurred simultaneously with the El Nino rise in ocean temperatures in the tropical East Pacific (an area called “Nino 3.4”) and that was already an indication that this could not be where the problem is: The lag is usually 3 months for global temperatures to follow Nino 3,4. Causality would have been violated.
It was already apparent in January 2022 that something was up. A volcano called Honga-Tunga-Honga erupted. It is an underwater volcano and large masses of water were hurled into the stratosphere. Here is a satellite image of it.
It has long been known that stratospheric water vapor causes temperatures on the ground to rise globally. But a volcano like this is a natural event, the warming effect is then added “on top” of the greenhouse gas effect. However, the “bump” itself was not man-made. Unfortunately, the news report did not mention this at all.
Every “impulse” that affects global temperatures (including land volcanoes such as the eruption of Pinatubo in 1991, which had a cooling effect due to many aerosols in the stratosphere) does so with some delay. The climate effect builds up slowly in the atmosphere and the thermal inertia of the Earth system as a whole does the rest.
Consequently, studies such as this one appeared at the beginning of 2023, which predicted a temporary warming of more than the “famous” 1.5°K deviation from pre-industrial values.
According to the Tagesschau, this is exactly what happened: “2024 was also the first calendar year to be 1.6 degrees warmer globally than pre-industrial levels from 1850 to 1900.”
…
The values are extrapolated to the end of July 2025, this month is estimated using a model, 7 days before its end.
The volcano in question occurred at the end of January 2022. Not much happened until around May 2023. Then, however, the “impulse response” of the climate system probably took place: in September 2023, an additional warming of 0.58 °C was detected compared to the average for 2022. The entire year 2024 saw an increased level of 0.39°C compared to 2022. This can NOT be explained by the gradual increase in forcing by greenhouse gases etc.!
Between 1980 and 2020 there was a warming of 0.018 °C/year, now it should suddenly be a factor of 10 in the years 2022-2024? That was always completely unlikely!
…
by J.F. Dean et al., June 4, 2025 in Nature
Rivers and streams are an important pathway in the global carbon cycle, releasing carbon dioxide (CO2) and methane (CH4) from their water surfaces to the atmosphere1,2. Until now, CO2 and CH4 emitted from rivers were thought to be predominantly derived from recent (sub-decadal) biomass production and, thus, part of ecosystem respiration3,4,5,6. Here we combine new and published measurements to create a global database of the radiocarbon content of river dissolved inorganic carbon (DIC), CO2 and CH4. Isotopic mass balance of our database suggests that 59 ± 17% of global river CO2 emissions are derived from old carbon (millennial or older), the release of which is linked to river catchment lithology and biome. This previously unrecognized release of old, pre-industrial-aged carbon to the atmosphere from long-term soil, sediment and geologic carbon stores through lateral hydrological routing equates to 1.2 ± 0.3 Pg C year−1, similar in magnitude to terrestrial net ecosystem exchange. A consequence of this flux is a greater than expected net loss of carbon from aged organic matter stores on land. This requires a reassessment of the fate of anthropogenic carbon in terrestrial systems and in global carbon cycle budgets and models.
…
by ScienceFeedback, July, 2025
Recent articles and social media posts inaccurately summarized findings from a June 2025 PNAS paper by claiming that a ‘major current in the Southern Ocean has reversed’. In reality, the PNAS paper does not mention any ‘ocean current reversal’. Instead, the paper mentions a ‘reversal’ of a decades-long trend: the Southern Ocean’s surface is now becoming saltier, instead of ‘fresher’. A saltier ocean surface can speed up the melting of Antarctic sea ice – floating ice which surrounds Antarctica – by drawing heat in the ocean upward toward the ice. This trend surprised scientists in the study, given that prior observations show the Southern Ocean’s surface becoming fresher (less salty) since the 1980s.
…
…

Figure 1 – Plot showing that sea ice began retreating around 2015 when the Southern Ocean’s surface became saltier, as shown by the red line representing sea surface salinity (SSS) anomalies obtained via satellite. Source: Silvano et al. (2025)[1]
…
by A. May, July 18, 2025 in WUWT
ow) but they are not the same. The NAO is usually measured using the SLP (sea level air pressure) difference between the Azores or the Iberian Peninsula and Iceland and is a North Atlantic regional phenomenon, whereas the Arctic Oscillation is the SLP difference between the northern mid-latitudes and the Arctic, and is evident in all longitudes (Thompson & Wallace, 2001). The AO accounts for more of the variance in Northern Hemisphere surface air temperature than the NAO and is tightly connected to the stratospheric polar vortex (Higgins, et al., 2000) and (Thompson & Wallace, 1998). We will discuss these oscillations together in this post.
…
by University of Plymouth, July 16, 2025
Summary
At the dawn of the millennium, a group of eminent scientists began compiling a list of the threats they felt were most likely to impact the world’s rocky shorelines over the coming quarter of a century.
Published in 2002, it included forecasts that – among other things – pollution from oil spills would decrease, the number of invasive species across the world would rise, genetically-modified organisms would have harmful effects on the ocean, and the impacts of global climate change would be felt more intensely.
…
by D. Harsanyl, July 16, 2025 in ClimateChangeDispatch
The public awareness campaign to convince Americans that climate change is an existential threat has been an epic failure. [emphasis, links added]
In a recent segment, “Are Americans Afraid of Climate Change?” CNN’s Harry Enten incredulously noted that despite all “the bad weather” we’ve been seeing, only “40% of Americans are greatly worried about climate change. The same as in 2000!”
Sooner or later, fearmongering becomes noise. Reality crashes against predictions.
Public schools, institutions of higher learning, governments, international organizations, the whole culture, and scientific institutions have spent billions and untold hours trying to normalize the idea that modernity and capitalistic gluttony have driven temperatures to dangerous extremes.
When I was growing up, it was cooling. Now, it’s warming. And with each surge of alarmism, the message depreciates.
…
by L. Lueken, July 16, 2025 in WUWT
A recent article at Al Jazeera, titled “Wildfire risks as climate change fuels extreme heatwave in Southern Europe,” claims that recent heatwaves in parts of southern Europe are due to climate change, which the publication says is making them more intense, and will inevitably cause more deaths. This is false. Recent heatwaves are not outside of historic norms, and though Al Jazeera correctly identifies the urban heat island effect as a major contributor, they downplay its role in recent trends and the evidence concerning temperature related deaths.
Al Jazeera reports that authorities across several southern European countries have issued heat warnings and fire warnings, “as Southern Europe experiences the summer’s first severe heatwave and as experts link the rising frequency and intensity of soaring temperatures to climate change.”
Countries impacted are: Spain; Portugal, where Al Jazeera says Lisbon is “expected” to see temperatures around 107°F; the Italian island of Sicily, which saw some wildfires over the weekend; and Greece.
Much of the article presents a reasonable discussion of the dangers heatwaves can pose, like increases in the likelihood of wildfire outbreaks and heat stroke. Unfortunately, the author of the post proceeds to make unfounded claims regarding the cause of the summer heat, like that “extreme weather events are becoming increasingly common across Europe’s southern region due to global warming.”
This is false; extreme weather is not becoming more severe or frequent. For example, Lisbon’s predicted high is not unprecedented, in part because the city is prone to being impacted by what is called the “Saharan air layer.” This is the same phenomenon that carries dust all the way across the Atlantic, as well as hot dry air with boosts temperatures. In 2018, Lisbon recorded a high of 111°F, and the all time high for Portugal was 117°F in 2003.
…
by K. Richard, July 14 2025, in NoTricksZone
Before relative sea level (RSL) declined to its present position over the last millennium, Africa’s Atlantic coast RSL ranged anywhere from 0.8 to 4 meters higher than today between 5000 and 1700 years ago (Vacchi et al., 2025).
This Mid- to Late-Holocene RSL highstand was “mainly controlled by the deglaciation history” − meltwater contributions from Earth’s ice sheets and glaciers. Because the climate was so much warmer than today at that time, there was significantly less water locked up on land as ice.
The Antarctic Thermal Optimum “simulated melt of the western Antarctic ice sheet until 2.0 ka BP.” Consequently, sea levels were still ≥ 1 meter higher than present during the Roman Warm Period
“Between -15°N and -0°…data indicate RSL reached its maximal elevation above the present sea level in the late Holocene (~2.0 to ~1.7 ka BP).”
…
by L. Johnson, July 14, 2025 in WUWT
The Met Office were given a right of reply to this GB News story. Instead of actually responding to the specific points raised, they merely regurgitated their Press Release:
However, according to the Met Office, the UK has warmed by 0.25C per decade since the 1980s, with the past three years among the five warmest on record.
Last year saw the warmest spring, the warmest May, and the wettest winter half-year in over 250 years, the report says.
It also states that days with temperatures 10°C above average have quadrupled since the 1960s, and months of double-average rainfall have risen by 50 per cent.
They could, of course, added that the wettest year was in 1872!
Their waffle about higher temperatures is meaningless without the corresponding data on extreme cold days.
Worst of all is the fact that they still make claims of extreme rainfall against a baseline of 1961-90. This is what the Press Release stated:
“the number of months where counties are recording monthly rainfall totals of at least twice the 1991-2020 monthly average has increased by over 50% compared to the number in 1961-1990”
They know full well that 1961-90 was a much drier interlude compared with both what preceded it and also what followed it.
They have all the data back into the 19thC, so why don’t they show the long term trends? Is it because it would not tell the story they want to tell?
The long term monthly data for the England & Wales Precipitation Series, for example, shows absolutely no evidence to support the Met Office’s claims:

KNMI Climate Explorer
The KNMI chart only runs to 2021, but since then the wettest month was 177.5mm in October 2023. Nothing, in other words, that alters the trends shown.
by K. Richard, July 8, 2025 in WUWT
Holocene (11,700 to 8,200 years ago) Arctic (Svalbard) temperatures “were up to 9°C higher than today” according to the authors of a new Nature journal study. At that time CO2 was thought to only hover around 260 ppm.
Svalbard then cooled as CO2 rose for the next 8,000 years – a negative correlation that wholly contradicts the rising-CO2-drives-Arctic-warmth narrative.
Nonetheless, climate models are predicated on the assumption rising human CO2 emissions (RCP 8.5) will lead to a warming of ~8°C by 2100.
…
by W. Eschenbach, July 6, 2025 in WUWT
ery so often, the climate media machine spits out a headline so breathless you’d think the laws of physics had just been accidentally repealed by a badly-worded executive order. Case in point: bne IntelliNews in Germany recently told us that a “major ocean current in the Southern Hemisphere has reversed direction for the first time in recorded history,” and that climatologists are calling it a“catastrophic” tipping point. It also quotes a climatologist as saying “The stunning reversal of ocean circulation in the Southern Hemisphere confirms the global climate system has entered a catastrophic phase.”
And the headline for that hysteria?
Southern Ocean current reverses for first time, signalling risk of climate system collapse
The implication: pack your bags, the climate apocalypse is here, and don’t forget your floaties.
But as is so often the case, the devil isn’t just in the details—it’s in the words they didn’t mention. The article, like a magician with something up both sleeves, never links to the actual scientific study.
…
…
So, after a bit of digital spelunking, I dug up the source. It’s an article in PNAS, the Proceedings of the National Academy of Sciences, yclept “Rising surface salinity and declining sea ice: A new Southern Ocean state revealed by satellites.”
And when I got to the study, what do you know? The study doesn’t mention “tipping point,” “collapse,” “current reversal,” “Southern Ocean current” or even “overturning circulation.” The only “reversal” in the paper refers to satellites detecting a reversal in surface salinity trends from decreasing to increasing, not a reversal in the the direction of the Southern ocean’s most complex circulation shown above.
So what did the study actually say? Here’s the paper’s abstract:
“For decades, the surface of the polar Southern Ocean (south of 50°S) has been freshening—an expected response to a warming climate. This freshening enhanced upper-ocean stratification, reducing the upward transport of subsurface heat and possibly contributing to sea ice expansion. It also limited the formation of open-ocean polynyas. Using satellite observations, we reveal a marked increase in surface salinity across the circumpolar Southern Ocean since 2015. This shift has weakened upper-ocean stratification, coinciding with a dramatic decline in Antarctic sea ice coverage. Additionally, rising salinity facilitated the reemergence of the Maud Rise polynya in the Weddell Sea, a phenomenon last observed in the mid-1970s. Crucially, we demonstrate that satellites can now monitor these changes in real time, providing essential evidence of the Southern Ocean’s potential transition toward persistently reduced sea ice coverage.”
…
by R. Spencer, July 3rd, 2025 in ClimateWarming
The Version 6.1 global average lower tropospheric temperature (LT) anomaly for June, 2025 was +0.48 deg. C departure from the 1991-2020 mean, down slightly from the May, 2025 anomaly of +0.50 deg. C.
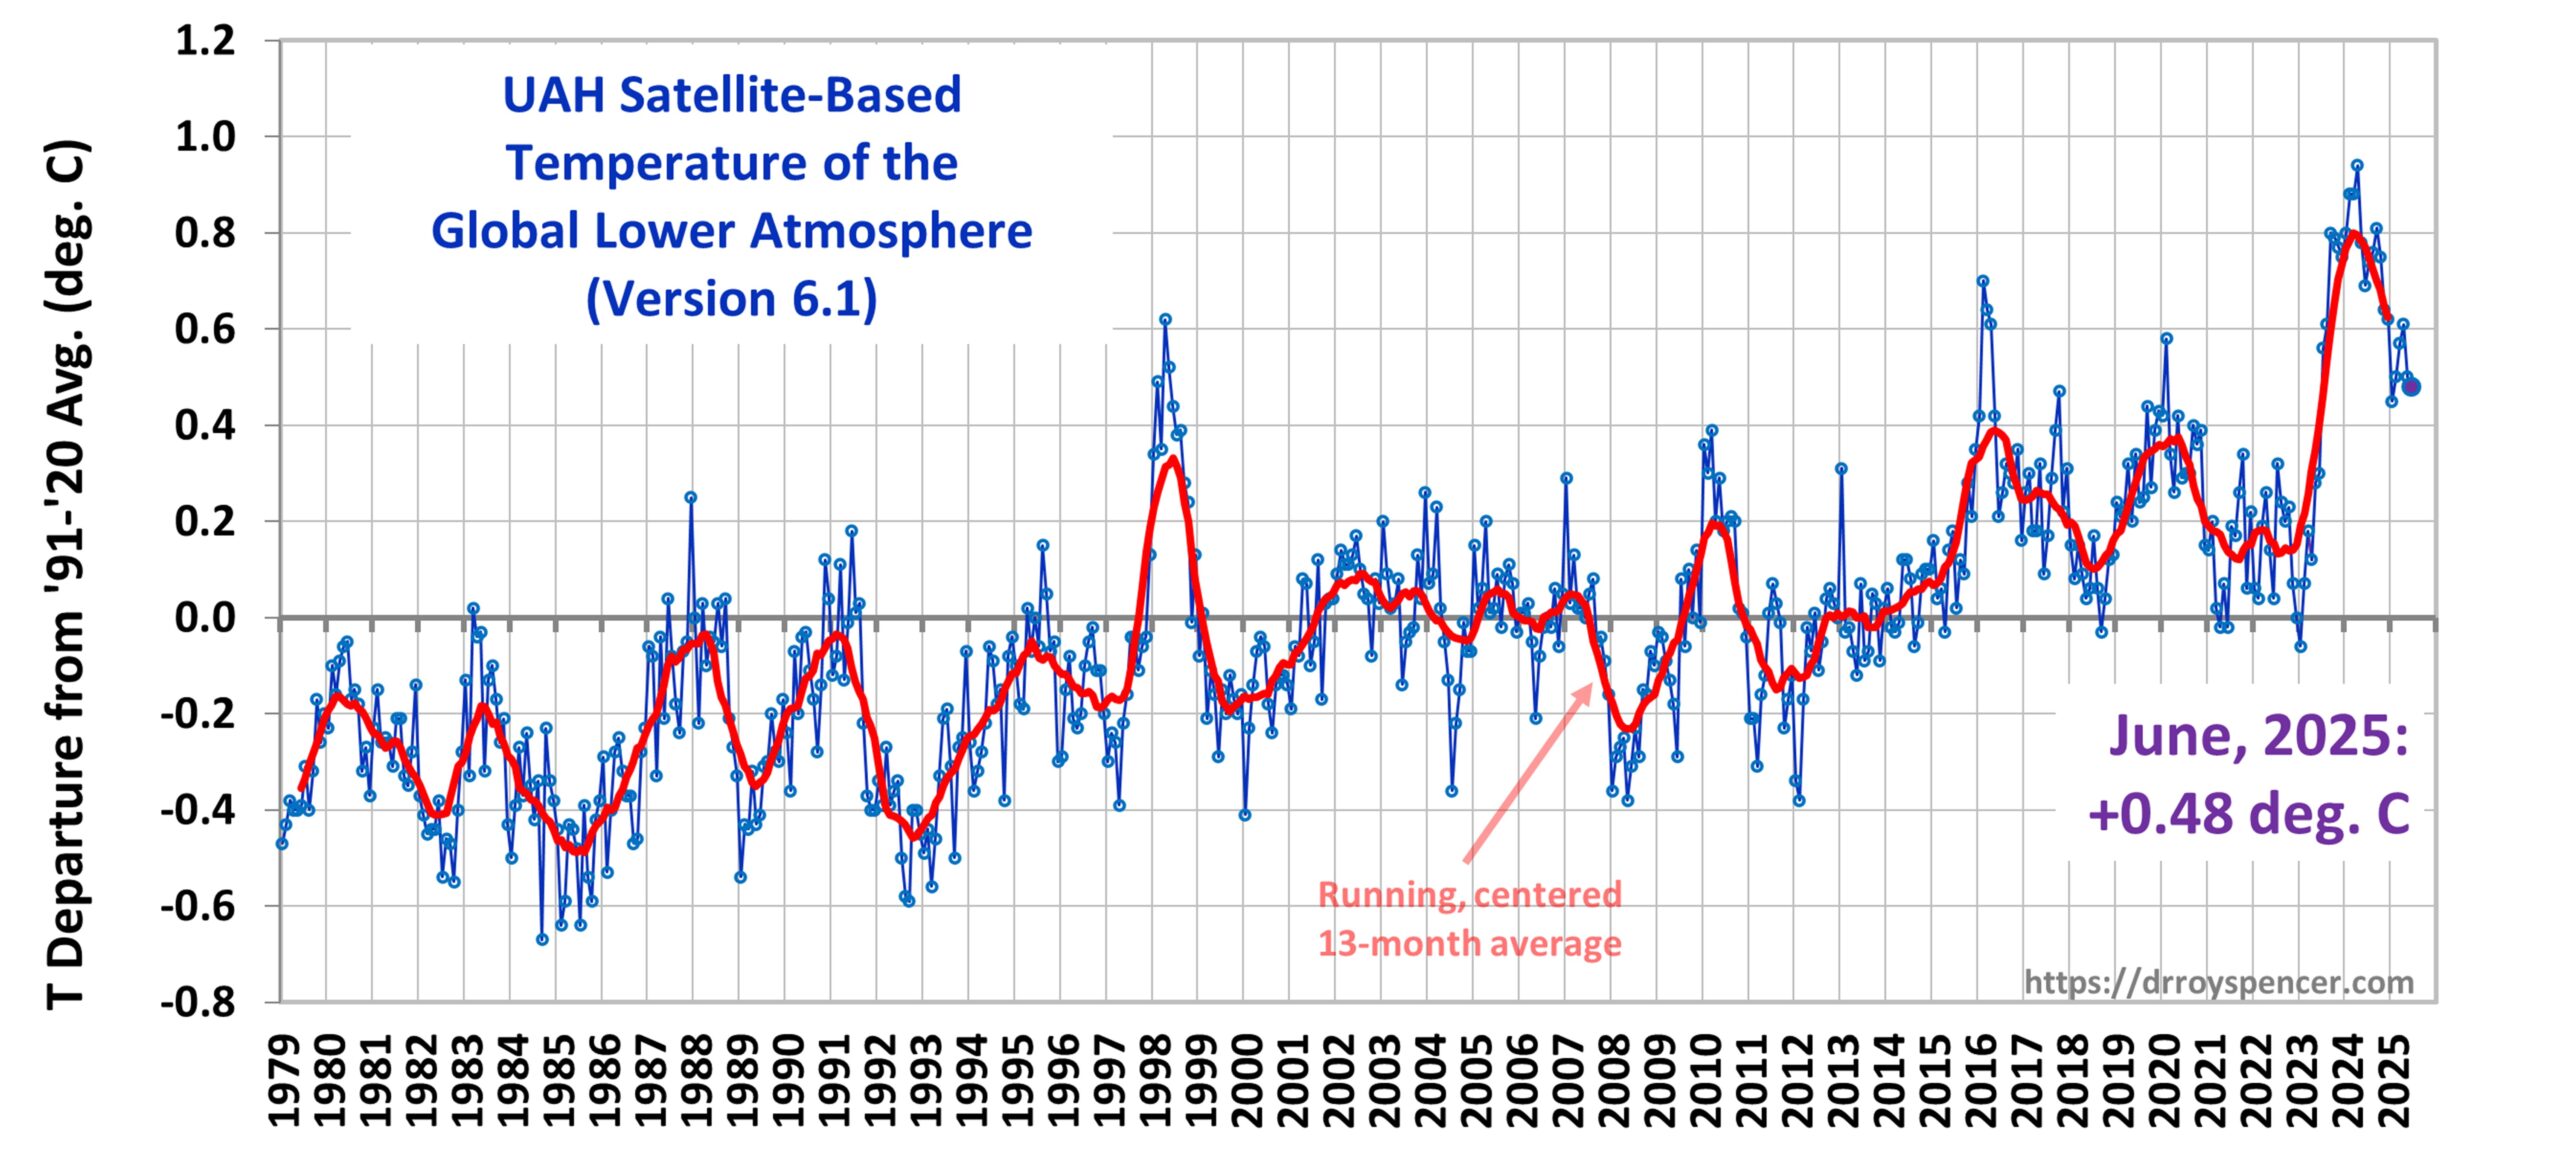
The Version 6.1 global area-averaged linear temperature trend (January 1979 through June 2025) now stands at +0.16 deg/ C/decade (+0.22 C/decade over land, +0.13 C/decade over oceans).
The following table lists various regional Version 6.1 LT departures from the 30-year (1991-2020) average for the last 18 months (record highs are in red).
| YEAR | MO | GLOBE | NHEM. | SHEM. | TROPIC | USA48 | ARCTIC | AUST |
| 2024 | Jan | +0.80 | +1.02 | +0.58 | +1.20 | -0.19 | +0.40 | +1.12 |
| 2024 | Feb | +0.88 | +0.95 | +0.81 | +1.17 | +1.31 | +0.86 | +1.16 |
| 2024 | Mar | +0.88 | +0.96 | +0.80 | +1.26 | +0.22 | +1.05 | +1.34 |
| 2024 | Apr | +0.94 | +1.12 | +0.76 | +1.15 | +0.86 | +0.88 | +0.54 |
| 2024 | May | +0.78 | +0.77 | +0.78 | +1.20 | +0.05 | +0.20 | +0.53 |
| 2024 | June | +0.69 | +0.78 | +0.60 | +0.85 | +1.37 | +0.64 | +0.91 |
| 2024 | July | +0.74 | +0.86 | +0.61 | +0.97 | +0.44 | +0.56 | -0.07 |
| 2024 | Aug | +0.76 | +0.82 | +0.69 | +0.74 | +0.40 | +0.88 | +1.75 |
| 2024 | Sep | +0.81 | +1.04 | +0.58 | +0.82 | +1.31 | +1.48 | +0.98 |
| 2024 | Oct | +0.75 | +0.89 | +0.60 | +0.63 | +1.90 | +0.81 | +1.09 |
| 2024 | Nov | +0.64 | +0.87 | +0.41 | +0.53 | +1.12 | +0.79 | +1.00 |
| 2024 | Dec | +0.62 | +0.76 | +0.48 | +0.52 | +1.42 | +1.12 | +1.54 |
| 2025 | Jan | +0.45 | +0.70 | +0.21 | +0.24 | -1.06 | +0.74 | +0.48 |
| 2025 | Feb | +0.50 | +0.55 | +0.45 | +0.26 | +1.04 | +2.10 | +0.87 |
| 2025 | Mar | +0.57 | +0.74 | +0.41 | +0.40 | +1.24 | +1.23 | +1.20 |
| 2025 | Apr | +0.61 | +0.77 | +0.46 | +0.37 | +0.82 | +0.85 | +1.21 |
| 2025 | May | +0.50 | +0.45 | +0.55 | +0.30 | +0.15 | +0.75 | +0.99 |
| 2025 | June | +0.48 | +0.48 | +0.47 | +0.30 | +0.81 | +0.05 | +0.39 |
The full UAH Global Temperature Report, along with the LT global gridpoint anomaly image for June, 2025, and a more detailed analysis by John Christy, should be available within the next several days here.
The monthly anomalies for various regions for the four deep layers we monitor from satellites will be available in the next several days at the following locations:
…
by H.S. Sterling, Jul 5, 2025 in WUWT
The U.K.’s The Guardian ran an article claiming that the world’s oceans have surpassed a critical tipping point in acidity threatening sea life. This is false. The pH content of the world’s oceans varies by time and place throughout the day, rising and falling modestly, but the average pH content remains far from acidic and there is no evidence crustaceans or other types of shellfish are being threatened by the sea water becoming acidic.
Lisa Bachelor, the writer of The Guardian’s article, “‘Ticking timebomb’: sea acidity has reached critical levels, threatening entire ecosystems – study,” says:
The world’s oceans are in worse health than realized, scientists have said today, as they warn that a key measurement shows we are “running out of time” to protect marine ecosystems.
Ocean acidification, often called the “evil twin” of the climate crisis, is caused when carbon dioxide is rapidly absorbed by the ocean, where it reacts with water molecules leading to a fall in the pH level of the seawater. It damages coral reefs and other ocean habitats and, in extreme cases, can dissolve the shells of marine creatures.
Bachelor’s story is based upon a study which claims that ocean acidity has breached a “planetary boundary,” the seventh of nine such milestones or boundaries to be breached, threatening to cause permanent damage to the planet’s health.
The study looked at ice core records and studies of marine life, run through algorithms of complex computer models to assess the past 150 years, concluding the ocean acidification boundary had been breached, with the world facing a “ticking timebomb,” of sea life destruction.
This study’s findings are driven by woefully flawed computer models, a limited time horizon and understanding of long-term history, and lack a basis in real world data. As such it and The Guardian’s dire warnings based on it, are unjustified.
Model outputs are only as good as the assumptions, data, and our understandings of the feedbacks and systems built into them. Even as our knowledge improves, our understanding of the oceans and the interactions of its various currents, systems, inputs, and outputs remain limited, thus the assumptions built into the models are weak and uncertain. As discussed at Climate Realism, here, here, and here, for example, the climate model outputs fail to match reality.
by C. Rotter, Jul 5, 2025 in WUWT
…
One of my favorite statistics about climate change
…is that apparently, 60% of Americans reckon that climate change has become like a religion, quote, “used to control people.”
…
…
I can barely believe this. Right?
Apparently, albatrosses are splitting up more often.
by Climate Science, Jul 4, 2025
Researchers have studied things like pebble layers, shell fragments, and coral rubble in Fiji to find out what has happened there in the past. Yanan Li and others drilled cores to find debris pushed 120m into the mangroves by the worst of the worst tropical cyclones. Handily, they also had two bad storms recorded in the last century to calibrate what they found. Awkwardly, the big storms were more common in the Little Ice Age.
by K. Richard, Jul 3, 2025 in NoTricksZone
According to a new study, abrupt (±1-2°C per century) shifts in North Atlantic sea surface temperature (SST) have occurred routinely over the last 9000 years. These decadal- to centennial-scale climate changes were “induced by Holocene summer insolation and atmosphere-ocean internal variability.”
The average SST throughout the 8.2 ka fluctuation was 10.0°C. The average 4.2 ka SST was 8.1°C. And during the Little Ice Age (LIA, 1600-1900 CE) the North Atlantic SSTs averaged 7.5°C.
Since 1900, SSTs have been stable to declining, suggesting the modern period is the coldest of the Holocene.
…
by I. Slav, June 26, 2025 in ClimateChangeDispatch
The United States is the largest oil and gas producer in the world. It is also experiencing a slowdown in its oil production for a number of reasons, including natural depletion. [emphasis, links added]
The U.S. Geological Survey, however, has just published a study stating that there are almost 30 billion new barrels of untapped oil—under federal lands, no less.
Oil and gas drilling was a contentious topic during the Biden administration. The administration decidedly did not like it and put a serious effort into curbing this drilling as much as the law allowed.
As soon as Donald Trump became president, the tables turned, and drilling on federal lands became very much a desirable direction for federal energy policy to move in, with the president prioritizing affordable energy and higher exports.
Now, the U.S. Geological Survey has thrown its weight behind the American energy dominance idea, reporting an estimated undiscovered oil reserves of 29.4 billion barrels across the country, with the leader being Alaska, with 14.46 billion barrels of untapped oil under federal lands.
New Mexico is next, with 8.925 billion barrels of undiscovered oil, followed by Nevada, with 1.4 billion barrels. Untapped gas reserves on federal lands were estimated at over 391.55 trillion cu ft.
Now, the only question is when these hitherto untapped resources will be tapped.

The number of drilling rigs in the U.S. oil patch has been on a steady decline recently, reflecting an extended weakness in international prices. This has now changed, of course, after Israel attacked Iran on June 13, but the industry is in no rush to reverse course for the time being.
The industry is playing it safe, not least because cheap drilling sites are running out—or maybe not, if the USGS assessment of untapped resources is correct.
For years now, the biggest production growth driver of U.S. oil has been the Permian Basin, spanning Texas and New Mexico. The Permian has single-handedly offset declines in several other shale plays and has largely uneventful day-to-day business in conventional fields.
…
by H. Sterling Burnett, June 27, 2025 in WUWT
Yahoo News recently posted an article from the environmental website The Cool Down claiming that the native residents of the very small Panamanian island, Gardí Sugdub (also known as Cartí Sugdupu), are being forced to flee due to fast rising sea levels swamping the land as a result of climate change. This is false. Sea levels at Gardi Sugdub aren’t rising unusually fast, and the best evidence is that most of the island’s residents are voluntarily abandoning it with government help due to overcrowding and insufficient services and infrastructure on the small island.
Grace Howarth, the author of the article, “Residents forced to flee from ‘disappearing island’ due to heartbreaking crisis: ‘There were no more friends, no more kids playing,’” writes describing the situation there:
Rising sea levels are splitting communities apart in Gardí Sugdub and leaving people behind, possibly in danger.
. . .
One year ago, around 1,200 Indigenous Guna people were transported to the mainland by the Panama government for their safety as ocean waters encroached upon their community.
Climate Realism debunked an earlier article from the BBC making the same claims in February of this year; nothing has changed in the four months since then.
…
by W. Essenbach, June 27, 2025
A few days ago I published another analysis of mine, called pHony Alarmism. Take a moment to read that if you haven’t, because this is a sequel. Both are about a new study in Science Magazine yclept “A 485-million-year history of Earth’s surface temperature”, paywalled, of course.
A short digression. One of the ways I truly benefit from publishing the results of my scientific investigations on the web and interacting with the commenters is that my mistakes don’t last long. When I go off the rails, and notice I didn’t say “if” I go, my mistakes rarely last more than a day before they’re pointed out and I can consider and correct them.
But that’s only one of the ways that it’s beneficial to write for the web and then stick around. Perhaps more importantly, it lets people ask me interesting questions and point out overlooked avenues to investigate.
Here’s an example. In a reply to my post yesterday, I got this …
Jeff Alberts, June 25, 2025 4:26 pm
No graph with the co2 and pH together?
To which I answered …
They’re sampled at different times. I could interpolate both ways. Thought about it, then decided that was enough for one post. Hang on … we know pH is proportional in some sense to the log of the CO2. Give me a minute …
In a bit I came back to say:
…well, of course it takes more than a minute but most interesting.
Looks like that will be the subject of my next post. Stay tuned.
w.
This is that next post. End of digression.
One of the reasons that I didn’t look at graphing pH versus CO2 was that I was given to understand that the procedure for calculating the pH was very complex. The paper says (or at least the Supplementary Information (PDF) says, the paper is paywalled:
4.3 Estimating the temporal variability of pHsw [pH of saltwater]