Le système d’échange de quotas d’émission de l’UE,connu sous l’acronyme SEQE-EU ou en anglais EU ETS, est instrument utilisé pour réduire les émissions de Gaz à Effet de Serre (GES) ou de CO2 pour faire court. Il repose sur un principe de plafonnement et d’échange des droits d’émission. Il a été adopté par la Commission Environnement du Parlement européen, le 13 octobre 2003.
The polar regions of the Earth have long been depicted as canary-in-the-coal-mine sentinels of climate change, given that climate models project that CO2-induced global warming will manifest itself here, first and foremost, compared to other planetary latitudes. Consequently, researchers are frequently examining the Arctic and Antarctic for evidence of recent climate change.
…
Clearly, as demonstrated here and in other studies (see, for example, The Antarctic Peninsula: No Longer the Canary in the Coal Mine for Climate Alarmists and the references therein) there is a canary in the Antarctic alright, but it is alive and well. And these counter-observations do not bode well for climate models and their projections of CO2-induced global warming.
Figure 1. Surface mass-balance records for glaciers around the northern Antarctic Peninsula. Source: Engel et al. (2018).
Judith Curry, one of climate science’s most vocal critics, is leaving academe because of what she calls the poisonous nature of the scientific discussion around human-caused global warming.
by David Wojic, December 5, 2018 in ClimateChangeDispatch
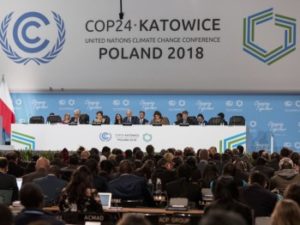
The mainstream press coverage of the beginning of the Katowice climate summit is sad but fascinating.
There is a uniformly dogmatic sense of urgency based on fear, with very little news and a great deal of preaching.
Fear is the dominant theme.
I truly pity the people who hold these false beliefs, as they must be afraid of the future. But I am not sympathetic with the alarmism, because it makes people dangerous.
The preachers are calling on the faithful to change the world we live in, and not in a good way. Fear makes people angry and angry people are dangerous.
Here are just three examples of alarmist news coverage of the Katowice climate summit, a few among many.
More than two miles below the ocean’s surface, microbes, worms, fishes, and other creatures great and small thrive. They rely on the transport of dead and decaying matter from the surface (marine snow) for food at these dark depths.
Up near the sea surface, carbon dioxide from the atmosphere is incorporated in the bodies of microscopic algae and the animals that eat them. When they die, these organisms sink to the depths, carrying carbon with them.
This supply of carbon to the deep sea isn’t steady. At times, months’ to years’ worth of marine snow falls to the abyss during very short “pulse” events.
In a new study published in the Proceedings of the National Academy of Sciences (PNAS), MBARI scientists and their collaborators show that there has been an increase in pulse events off the coast of California. They also show that, although such episodes are very important to the carbon cycle, they are not well represented in global climate models.
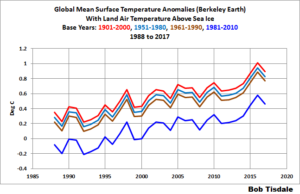
Most of us are familiar with the World Meteorological Organization (WMO)-recommended 30-year period for “normals”, which are also used as base years against which anomalies are calculated. Most, but not all, climate-related data are referenced to 30-year periods. Presently the “climatological standard normals” period is 1981-2010. These “climatological standard normals” are updated every ten years after we pass another year ending in a zero. That is, the next period for “climatological standard normals” will be 1991-2020, so the shift to new “climatological standard normals” will take place in a few years.
But were you aware that the WMO also has another recommended 30-year period for “normals”, against which anomalies are calculated? It’s used for the “reference standard normals” or “reference normals”. The WMO-recommended period for “reference normals” is 1961-1990. And as many of you know, of the primary suppliers of global mean surface temperature data, the base years of 1961-1990 are only used by the UKMO.
While there’s little cobalt mining in China itself (1 percent of the world’s total output in 2017), Chinese companies have snapped up cobalt mines abroad in recent years, particularly in the Democratic Republic of Congo, the largest source of the metal.
Summary: Volume II of the Fourth National Climate Assessment (NCA) has dominated the news in the weeks since its release. One of the major findings that journalists headlined was the effect of climate change on the US economy. Ten percent is vivid number to grab the attention of Americans still skeptical after thirty years of dire warnings about climate change. Unfortunately it is a dubious story, as explained in these tweets by Roger Pielke Jr.
Talk about cold turkey! The coldest Thanksgiving in 100 years, and quite possibly the coldest Thanksgiving ever, has hit the Northeast United States today.
The unprecedented cold snap comes courtesy of a large Canadian chill working its way across the country on its way to the Atlantic. According to the Weather Network, the deep freeze is the result of a large, low pressure system moving south from the Arctic across the Great Lakes. Combine that with a wicked wind chill, and many Americans are looking at the coldest Thanksgiving in a century.
La raison d’être de la taxe carbone qui pèse sur les carburants est qu’en augmentant le prix des carburants en France, cette taxe va diminuer la consommation de carburant, et les rejets de CO2 qui vont avec. Le raisonnement est solide. Mais la question est : de combien ? C’est l’enjeu. L’augmentation de cette taxe met le pays à feu et à sang. C’est la chandelle. Le jeu en vaut-il bien la chandelle ?
Pour y répondre il faut connaître la sensibilité de la consommation au prix, ce qu’on appelle l’élasticité-prix. C’est le rapport de l’effet, la variation de consommation (mesurée en %) sur la cause, la hausse de prix (également mesurée en %). Si une hausse des prix de 10% entraîne une diminution de consommation de 8%, l’élasticité est de -0,8.
Fossil fuels helped humanity improve our health, living standards and longevity in just 200 years.
…
Then, suddenly, a great miracle happened! Beginning around 1800, health, prosperity and life expectancy began to climb … slowly but inexorably at first, then more rapidly and dramatically. Today, the average American lives longer, healthier and better than even royalty did a mere century ago.
How did this happen? What was suddenly present that had been absent before, to cause this incredible transformation?
Humanity already possessed the basic scientific method (1250), printing press (1450), corporation (1600) and early steam engine (1770). So what inventions, discoveries and practices arrived after 1800, to propel us forward over this short time span?
New research disputes a long-held view that our earliest tool-bearing ancestors contributed to the demise of large mammals in Africa over the last several million years. Instead, the researchers argue that long-term environmental change drove the extinctions, mainly in the form of grassland expansion likely caused by falling atmospheric carbon dioxide (CO2) levels.
The study is published today in the journal Science.
“Despite decades of literature asserting that early hominins impacted ancient African faunas, there have been few attempts to actually test this scenario or to explore alternatives,” Faith says. “We think our study is a major step towards understanding the depth of anthropogenic impacts on large mammal communities, and provides a convincing counter-argument to these long-held views about our early ancestors.”
To test for ancient hominin impacts, the researchers compiled a seven-million-year record of herbivore extinctions in eastern Africa, focusing on the very largest species, the so-called ‘megaherbivores’ (species over 2,000 lbs.) Though only five megaherbivores exist in Africa today, there was a much greater diversity in the past. For example, three-million-year-old ‘Lucy’ (Australopithecus afarensis) shared her woodland landscape with three giraffes, two rhinos, a hippo, and four elephant-like species at Hadar, Ethiopia.
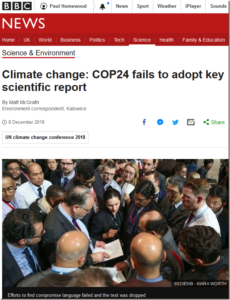
One of the most basic things about journalism, especially BBC journalism, is that anyone should be able to find out what the corporation reported on a particular day about a particular story. Imagine wanting to find out about what Parliament voted for or what was the content of a UN speech, or the conclusions of a report, and not having full confidence that what you are able to look up is what was actually broadcast or written.
The public does not have access to data held in TV and Radio News archives, but they do to the articles published by BBC News Online. Sadly if you want to know what article was published about a certain subject on a particular day you cannot be sure the BBC Online News website is telling you the truth for history might have been rewritten 1984 style if recent antics in its Environment section are anything to go by.
by Paul Berth, 22 novembre 2018, in ScienceClimatEnergie
Les microbulles de gaz emprisonnées dans les carottes de glace sont fréquemment utilisées pour estimer le taux de CO2 de l’atmosphère du passé. Il s’agit de méthodes de mesure indirectes. Par exemple la carotte de glace EPICA Dome C en Antarctique nous suggère que le CO2 de l’atmosphère a varié entre 180 et 300 ppmv pendant les derniers 650 000 ans (Brook 2005). Cependant, le taux de CO2 observé dans ces carottes de glace représente-il vraiment l’atmosphère du passé? Nous allons montrer ici qu’un paramètre est souvent négligé par les glaciologues, et que ce paramètre pourrait avoir un effet considérable sur le résultat des analyses : il s’agit de la présence de micro-organismes dans la glace et les microbulles.
Reflections on Nic Lewis’ audit of the Resplandy et al. paper.
In response to Nic Lewis’ two blog posts critiquing the Resplandy et al. paper on ocean temperatures, co-author Ralph Keeling acknowledges the paper’s errors with these statements:
…
Conclusions
By quickly admitting mistakes and giving credit where due, Ralph Keeling has done something unusual and laudatory in the field of climate science. If all climate scientists behaved this way, there would be no ‘hostile environment.’
I find it to be a sad state of affairs when a scientist admitting mistakes gets more kudos than the scientist actually finding the mistakes. But given the state of climate science, I guess finding mistakes seems to be a more common story than a publishing scientist actually admitting to mistakes.
Given the importance of auditing climate research and independent climate scientists working outside of institutional frameworks, I wish there was some way to encourage more of this. In the absence of recognition and funding, I don’t have much to suggest
Over 8,000 homes and businesses have been reduced to ashes and rubble by the latest California conflagrations. Well over 60 people have perished, over 50,000 are homeless, hundreds remain missing. “This is the new abnormal,” Governor Jerry Brown insists. “Dryness, warmth, drought, all those things are going to intensify,” because of climate change. Even if we do more on forest management, that won’t stop climate change. “And those who deny that are definitely contributing to the tragedies.”
Those assertions have no basis in fact. The hard, incontrovertible reality is that California has always been a largely arid state, afflicted by prolonged droughts, interspersed with periods of intense rainfall, and buffeted almost every autumn by strong winds that can whip forest fires into infernos. The problem isn’t climate change. It’s ideological, even criminally incompetent forest management practices demanded by politicians, regulators, judges and environmentalists in recent decades. My article presents the real story.
Ask medieval historian Michael McCormick what year was the worst to be alive, and he’s got an answer: “536.” Not 1349, when the Black Death wiped out half of Europe. Not 1918, when the flu killed 50 million to 100 million people, mostly young adults. But 536. In Europe, “It was the beginning of one of the worst periods to be alive, if not the worst year,” says McCormick, a historian and archaeologist who chairs the Harvard University Initiative for the Science of the Human Past.
A mysterious fog plunged Europe, the Middle East, and parts of Asia into darkness, day and night—for 18 months. “For the sun gave forth its light without brightness, like the moon, during the whole year,” wrote Byzantine historian Procopius. Temperatures in the summer of 536 fell 1.5°C to 2.5°C, initiating the coldest decade in the past 2300 years. Snow fell that summer in China; crops failed; people starved. The Irish chronicles record “a failure of bread from the years 536–539.” Then, in 541, bubonic plague struck the Roman port of Pelusium, in Egypt. What came to be called the Plague of Justinian spread rapidly, wiping out one-third to one-half of the population of the eastern Roman Empire and hastening its collapse, McCormick says.
by M. Bastasch, November 14, 2018 in WUWT/DailyCaller
Scientists behind a headline-grabbing climate study admitted they “really muffed” their paper.
Their study claimed to find 60 percent more warming in the oceans, but that was based on math errors.
The errors were initially spotted by scientist Nic Lewis, who called them “serious (but surely inadvertent) errors.”
The scientists behind a headline-grabbing global warming study did something that seems all too rare these days — they admitted to making mistakes and thanked the researcher, a global warming skeptic, who pointed them out.
“When we were confronted with his insight it became immediately clear there was an issue there,” study co-author Ralph Keeling told The San Diego Union-Tribune on Tuesday.
Their study, published in October, used a new method of measuring ocean heat uptake and found the oceans had absorbed 60 more heat than previously thought. Many news outlets relayed the findings, but independent scientist Nic Lewis quickly found problems with the study.
by P. Homewood, November 9, 2018 in NotaLotofPeopleKnowThat
What are the environmental impacts? Generally the environmental impact of geothermal developments is extremely low. There are virtually no emissions and land use and visual impact are small. However, some potential impacts do need to be considered and information on each of these issues is set out in the sections below. All these issues will be fully considered as part of the planning process. Cornwall Council has worked with the industry to develop robust Supplementary Planning Guidance to ensure risks are mitigated and minimised. In addition to planning permission, projects must also obtain the necessary licenses from the Environment Agency.
What is the risk of earth tremors (induced seismicity)?
A new study, based on 27 years of data from Mana Pools National Park in Zimbabwe, suggests that temperature increases over the last three decades have already caused major declines in local populations of tsetse flies.
This analysis, published in the journal PLOS Medicine this week, provides a first step in linking temperature to the risk of sleeping sickness in Africa.
…
My analysis
A model for fly population mortality is only as good as the temperature data used to run the model. It appears they only used one source of temperature data, the only one available to them, the Rekomitjie Research Station.
Interestingly, this helpful photo was also included in the press release from Eurekalert. It is the weather station used to monitor climate at the Rekomitjie Research Station, Zimbabwe. I provide it below, click for full-size. At the scale displayed above, you might not notice some important details about the weather station itself, but I did. Here it is, magnified: …
“A number of biases internal and external to the scientific community contribute to perpetuating the perception of ocean calamities in the absence of robust evidence.” – Duarte et al., 2015
…
Within a matter of days after the press release for a newly published Naturepaperspewed the usual it’s-worse-than-we-thought headlines throughout the alarmosphere (Washington Post, BBC, New York Times), the paper’s results were assessed to have “major problems” by an author of multiple CO2 climate sensitivity papers (Lewis and Curry, 2015, 2018).
A glaring miscalculation was quickly spotted that changed not only the results, but consequently undermined the conclusion that estimates of climate sensitivity to doubled CO2 may be too low.
And yet the paper was able to pass through peer review anyway.
The Intergovernmental Panel on Climate Change (IPCC) published a special report (hereafter called SR15) on the impacts of global warming of 1.5 °C above pre-industrial levels on October 8, 2018. The report says the cost of mitigating CO2 emissions in 2030 to prevent temperatures from exceeding 1.5 °C above pre-industrial levels is about 880 US$2010 per tonne of CO2 ($/tCO2). The benefit of doing so, according to the report, is 15 $/tCO2. Using a climate sensitivity based on observations including effects of natural climate change, urban warming and the best available economic model, the mitigation proposal will prevent a benefit of 8.2 $/t CO2, for a total loss of 888 $/tCO2 mitigated. In other words, each $1000 spent on mitigation of CO2 emissions will cause another loss $9.20.
The SR15, presents various emissions pathways to limit the projected rise of temperatures from pre- industrial times, estimated to be the temperature average from 1850 to 1900, to the year 2100, and to limit the temperature rise to 2.0 °C by 2100. According to the IPCC, temperatures have increased by about 1.0 °C from pre-industrial times to 2017. Therefore, the emissions pathways to limit warming allows only 0.5 °C temperature rise from 2017, assuming there is no natural caused climate change.