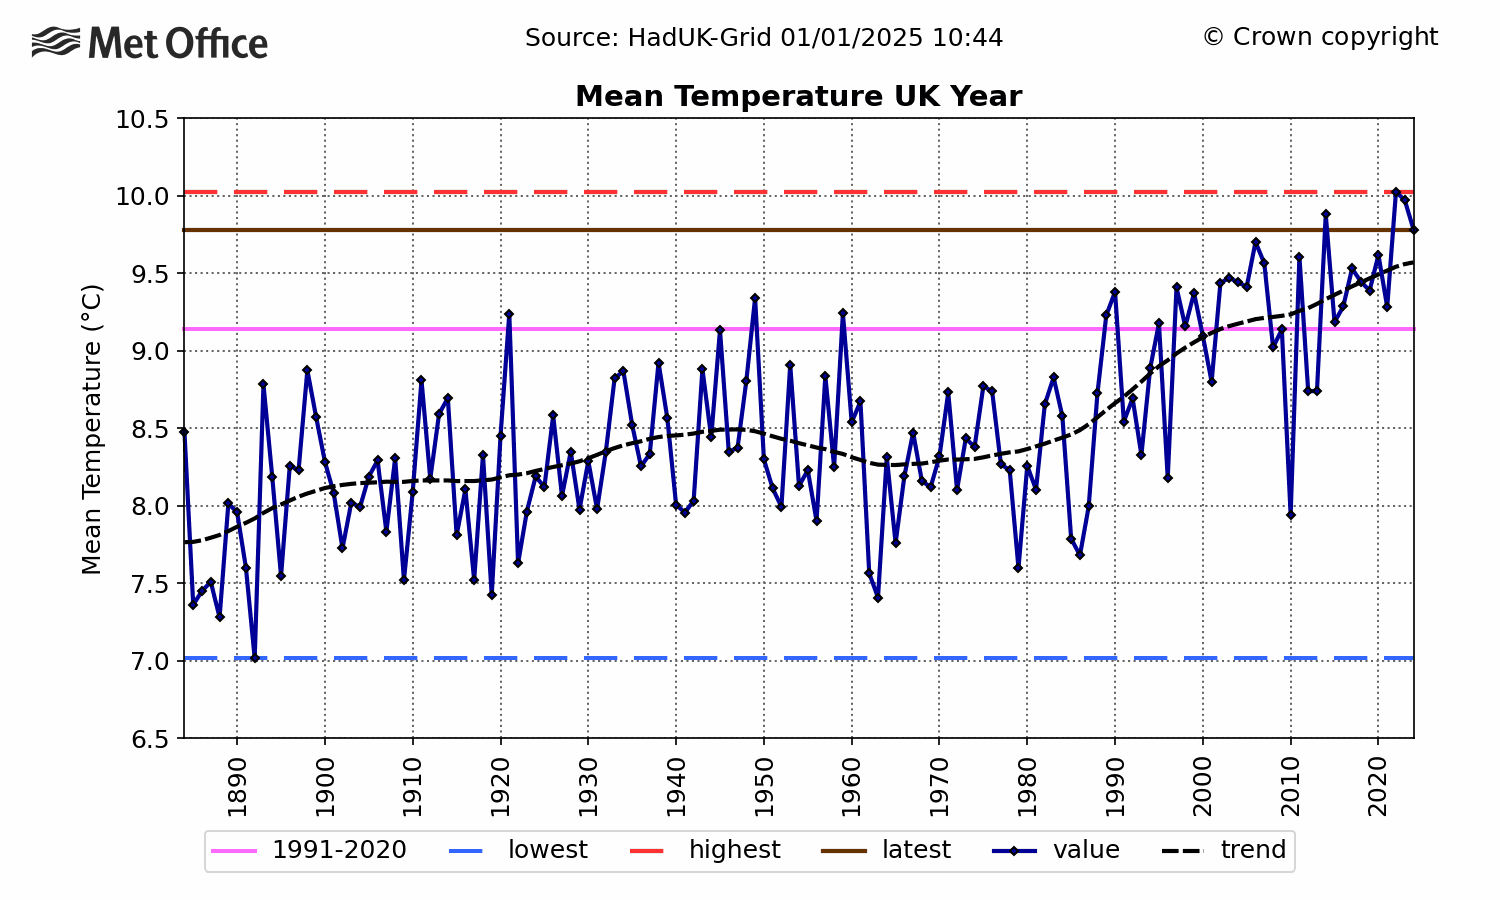
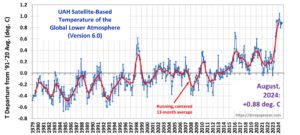
There’s no doubt that 2024 was the hottest year of the instrumental period. But why it was so warm is not exactly clear, even with the backdrop of increasing global temperatures.
Over the years we have heard a lot about consensus when it comes to climate science. Sometimes it has been manufactured, for example the suggestion that 97% of all scientists believe global warming is real, but in many cases it does represent what is at least a snapshot of what scientists think is happening.
So it was on December 10th at the American Geophysical Union meeting in Washington. A show of hands was requested in answer to the question as to whether we understand why 2023 and 2024 was so hot. Very few hands were raised. Asked a slightly different question, the majority of the audience raised their hands to the proposition that we can’t explain it.
The spike in, already elevated, global temperatures of 2023 and 2024 is beyond what can be explained by more CO2 in the atmosphere. It can’t be explained with El Niño, volcanic emissions or the decline in ship fuel pollution letting more sunlight reach the ocean. Something else is going on.
One team of researchers have suggested it’s due to a decrease in low cloud, which tends to cool our planet. If this is so, then it is important to see if it is a blip or a trend.
Reporting certainty
Such scientific niceties haven’t bothered most reporters dealing with the record-breaking warmth of 2024, which broke the 1.5°C Paris Agreement boundary.
Given that the increase is unexplained, is it wise to present it as evidence of a dangerous new phase in our broken clime, as New Scientist did? Despite the uncertainties, they say that Earth’s climate systems are no longer behaving as they should. It points to the wavering Jet Stream and the recent Californian wildfires as proof, even though it’s technically possible to explain these effects without climate change, catastrophic or not.
New Scientist says the one thing we can now expect ‘with certainty’ is that we ‘should’ expect extreme weather events to become more frequent. What is it? Is it certain, or just something that should happen?
The uncertainty extends into 2025. It was expected that El Niño, which boosted 2023 and 2024 temperatures, would have declined by mid-year, but it didn’t. It has hung on and is expected to linger for most of this year, to be followed by a weak and brief cooling La Niña.
I wonder if there will be another show of hands by puzzled scientists at the end of 2025.


