Archives par mot-clé : Australia

Coral Catastrophes Imagined

by Jennifer, April 10, 2020 in WUWT


From Jennifer Marohasy’s Blog

April 10, 2020 By jennifer

Exactly one year ago yesterday, I was getting off a train in Proserpine, looking to pickup a hire car to drive to Bowen. I wanted to know if the coral there was all dead, or not. Bowen is a coastal town in North Queensland, not far from Abbott Point that is the coal terminal for the controversial Adani coal mine.

Judge Salvador Vasta had earlier that week handed down his findings regarding the sacking of Peter Ridd. He had exonerated Ridd and explained that James Cook University had wrongly sacked him.

Some claim that it all came to a sorry end for Ridd because he dared to question the consensus of scientific opinion concerning the health of the Great Barrier Reef – particularly the impact of global warming. The university claimed it was because he had become ‘un-collegial’ and did not follow various directives while disclosing confidential information.

These issues were argued in the Federal Circuit Court in Brisbane a month earlier, in March 2019. Very few people realized that at the heart of the case were a couple of what might be best described as fake-news photographs promoted by Terry Hughes.

This is the same Terry Hughes who is now claiming that 60%* of the Great Barrier Reef has been bleached, and that this is an extraordinary catastrophe for which we should all be ashamed.

If Peter Ridd had become un-collegial and disclosed confidential information, it was because he was fed-up with the fake news. As Ridd wrote in chapter 1 of the book that I edited three years ago, a chapter entitled ‘The Extraordinary Resilience of Great Barrier Reef Corals, and Problems with Policy Science’:

ANTARCTIC BLAST DELIVERS RARE SUMMER SNOW AND FREEZING TEMPERATURES TO PARTS OF AUSTRALIA

by Cap Allon, March 2, 2020 in Electroverse


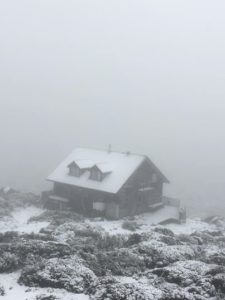
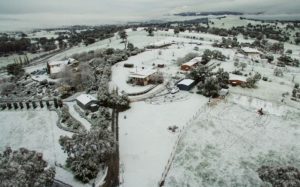
Australia’s “Grand Solar Minimum” summer –which brought record cold/heat, drought/floods, fires, and dust storms– had one final sting in the tail: another flurry of rare summer snow.

While summer down-under officially ended on Saturday, Feb 29, another blast of heavy, unexpected snow began burying parts of Tasmania on Wednesday, Feb 26.

Mountainous areas of the isolated island state reported large accumulations to close out the week, with local meteorologists warning yet more snow could settle above 1,000 m (3,280 ft) –including at Mount Field and Wellington– over the coming days.


Australian fires: Climate ‘truth bomb’?

by Alan Longhurst, February 24, 2020 in WUWT


Recipe for Australia’s climate ‘truth bomb’:  dubious manipulations of the historical temperature record, ignorance of the climate dynamics of the Southern Hemisphere, and ignorance of Australia’s ecological and social history.

A correspondent of The Guardian newspaper writes that her personal ‘climate truth bomb’ hit her while she was picking ash from her glass at a wine tasting event – the Sydney Harbour bridge being dimly seen through the murk of bushfires. The truth came to her, she wrote, in the eloquent rage of Greta Thunberg and also in heat, smoke and fire.

Although anthropogenic climate change sells well, especially at The Guardian, their Sydney correspondent cannot be so ignorant about the climate of Australia or about bushfires as she pretends. Put briefly, bushfires in Australia and elsewhere have two main sources: from thunderstorms or from human activity, deliberate or otherwise – cigarette butts, sparks from brakes on railway trains, from incautious welding on farm machinery and from electric transmission lines. In California, where almost 2 million acres burned in 2018 and claimed many lives, the electricity supply company now closes down its transmission lines in windy conditions to prevent sparking and fires.

As she should have known, climate change or not, that ash in The Guardian correspondent’s wine was very probably caused by the direct action of an Australian citizen. In the current drought, 36% of fires have been judged to be accidental, 37% as suspicious, 13% as deliberate and only 6% as natural. And that pattern is not new: Australia has a serious arson problem. “In short, up to 85 bushfires begin every day because someone leaves their house and decides to start one,” said Dr. P. Reid of the Australian Center for Research in Bushfires and Arson

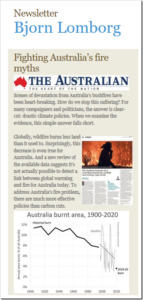
Bjorn Lomborg Fighting Australia’s Fire Myths

by P. Homewood, January 29, 2020 in NotaLotofPeopleKnowThat


https://www.facebook.com/bjornlomborg/photos/a.221758208967/10158703983303968/?type=3&theater

As he points out in the article:

Australia is the world’s most fire-prone continent. In 1900, 11 per cent of its surface burned annually. These days, 5 per cent of the country burns every year. By the end of the century, if we do not stop climate change, higher temperatures and an increase in aridity will likely mean a 0.7 percentage point increase in burnt area, an increase from 5.3 per cent of Australia to 6 per cent.

Unfortunately, many reports on Australia’s fires have exploited the carnage to push a specific agenda, resting on three ideas: that bushfires are worse than ever, that this is caused by global warming, and that the only solution is for political leaders to make even bigger carbon-cut promises.

Globally, bushfires burn less land than it used to. Since 1900, global burnt area has reduced by more than one-third because of agriculture, fire suppression and forest management. In the satellite era, NASA and other groups document significant decreases.

Surprisingly, this decrease is even true for Australia. Satellites show that from 1997 to 2018 the burnt area declined by one-third. Australia’s current fire season has seen less area burned than in previous years. Up to January 26, bushfires burned 19.4 million hectares in Australia — about half the average burn over the similar timeframe of 37 million hectares in the satellite record. (Actually the satellites show 46 million hectares burnt, but 9 million hectares are likely from prescribed burns.)

When the media suggests Australia’s fires are “unprecedented in scale”, it is wrong. Australia’s burnt area declined by more than a third from 1900 to 2000, and has declined across the satellite period. This fire season, at the time of writing, 2.5 per cent of Australia’s area has burned compared with the past 10 years’ 4.8 per cent average by this point.

What is different this year is that fires have been mostly in NSW and Victoria. These are important states with a little more than half the country’s population — and many of its media outlets.

But suggesting fires are caused by global warming rests on cherrypicking these two regions with more fire and ignoring the remaining 87 per cent of Australia’s landmass, where burned area has declined.

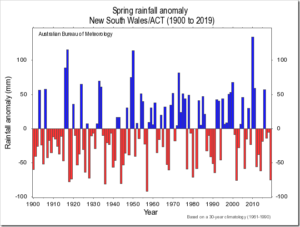
I certainly would take issue with the claim aridity will increase, as we know that rainfall has generally been greater since the 1970s than before.

Lomborg goes on to make the points I have made regularly, that there are many practical ways to reduce the risk of severe fires, and that even if Australia went totally net zero, it would have no effect whatsoever on their climate.

Well worth a read though.

Learning The Lessons From The Waroona Bushfires

by P. Homewood, January 22, 2020 in NotaLotofPeopleKnowThat


It has surely now been established beyond any possible doubt the major role that poor fire hazard management has played in the severity of recent Australian bushfires, despite disinformation campaigns from the BBC/Guardian/Met Office.

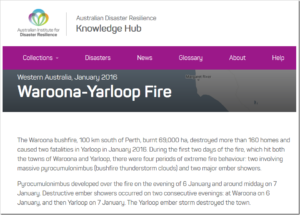
Back in 2016, a Special Inquiry was held following the catastrophic Waroona bushfire, just south of Perth that year. Their report not only reemphasised the crucial role of controlled burning, but also gives an insight into the evolution of such practices in recent decades:

Below is the key segment of the report. [The data relates to Western Australia, and P&W refers to the Department of Parks and Wildlife].

Les Feux en Australie : la réalité des faits et rien d’autre…

by Yannick Colleu, 17 janvier 2020 in ScienceClimatEnergie


Les feux de brousse en Australie font la une des journaux écrits et audiovisuels. Ces annonces sont reprises par les réseaux sociaux.
La vérité médiatique est maintenant bien établie, ces feux sont l’œuvre du dérèglement climatique. Ces catastrophes humaine et écologique présagent, selon les réseaux dits sociaux, la fin du Monde annoncée par les « experts » du GIEC.

A ma connaissance pas un seul journaliste ne semble s’être penché sur le sujet. Du moins aucune autre conclusion, quant aux causes de cette catastrophe, n’a été, à ma connaissance, publiée sinon pour pointer le changement climatique comme seul et unique coupable.

Pourtant la réponse est moins évidente.

Il est de notoriété publique que l’Australie est un pays coutumier des sécheresses et des températures extrêmes. En outre c’est un pays quasi désertique de 7,7 millions de km² peuplé d’à peine 25 millions d’habitants principalement implantés dans les grandes villes de la côte Est et dans la principale métropole de l’Ouest.

Après les gigantesques feux de brousse de janvier à mars 1961 en Australie occidentale les réflexions sur les actions de prévention conduisaient à préconiser l’usage de feux déclenchés/contrôlés pour maîtriser la végétation à l’approche de la saison sèche. Cette technique permet en effet de créer des coupe-feux et de limiter la matière inflammable qui nourrit les brasiers.

Cette politique préventive a longtemps porté ses fruits, réduisant considérablement les incendies et surtout leur propagation. Néanmoins les chantres de la lutte contre le réchauffement et le CO2 ont poussé le gouvernement australien à changer de politique il y a une dizaine d’années (par exemple ici et ici).

La politique actuelle ne privilégie plus l’anticipation du risque d’incendie mais préconise de laisser les incendies se propager et de ne défendre autant faire se peut que les habitations et les vies humaines.
De fait la végétation n’est plus façonnée par l’homme pour limiter les risques de propagation et celle-ci offre dès lors un combustible abondant au moindre foyer qui se développe.

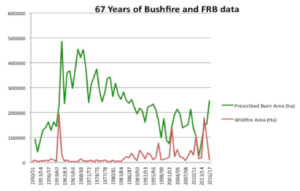
Le graphique ci-dessous fournit par l’association Bushfire Front Inc (BFF) de l’État d’Australie occidentale révèle l’impact que cet abandon d’une politique de prévention sur les feux de brousse sur la période 1950-2017.

En vert : surface de feux déclenchés.
En rouge : surface de feux de brousse


Source : https://www.bushfirefront.org.au/prescribed-burning/why-prescribed-burning/
Légende : La zone d’incendie contrôlé (réduction de ‘carburant’) est indiquée en vert et la zone des feux de brousse (feux de forêt) en rouge. Les pics causés par désastreuse saison des incendies de 1961 et les grands feux de brousse de ces dernières années sont clairement visibles.

It has been hotter, fires have burnt larger areas

by J. Marohasy, January 4, 2020 in WUWT


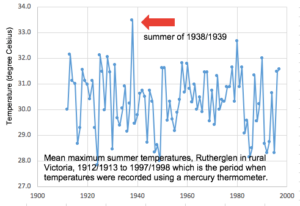
Last summer, and this summer, has been hot in Australia. But the summer of 1938-1939 was probably hotter — and back then more ferocious bushfires burnt larger areas. In rural Victoria, the summer of 1938-1939 was on average at least two degrees hotter than anything measured with equivalent equipment since, as shown in Figure 1.

Figure 1. Mean maximum summer (December, January February) temperatures as measured at Rutherglen in rural Victoria by The Australian Bureau of Meteorology for the period when mercury thermometers were used. Data unadjusted/not homogenised.

The summer of 1938-1939 was probably the hottest ever in recorded history for the states of New South Wales and Victoria. It is difficult to know for sure because the Bureau has since changed how temperatures are measured at many locations and has not provided any indication of how current electronic probes are recording relative to the earlier mercury thermometers.

Further, since 2011, the Bureau is not averaging measurements from these probes so the hottest recorded daily temperature is now a one-second spot reading from an electronic devise with a sheath of unknown thickness. In the United States similar equipment is used and the readings are averaged over five (5) minutes and then the measurement recorded.


See also: Australia Drought, The Indian Ocean Dipole & Sudden Stratospheric Warming

See also: Australia Bushfires – Is Blaming Greens a Conspiracy Theory?

See also : 24 People Charged For Setting Fires In New South Wales; Arrest Toll Hits 183

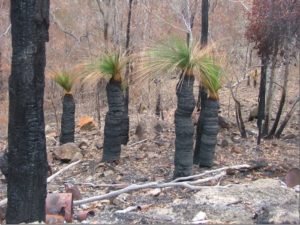
See also  : RISING LIKE A PHOENIX — AUSTRALIA’S FORESTS RENEW THEMSELVES

Australian Wildfire Latest

by P. Homewood, January 3, 2020 in NotaLotofPeopleKnowThat


According to the Telegraph, the current fires have affected 5.9m hectares, or 59,000 km2. While they claim this is three times the size of Wales, we need to remember that Australia is more than 30 times the size of the UK. 59,000 km2 represents 0.77% of Australia’s area, which in UK terms would be about 1800 km2, equivalent to three times the size of the New Forest.

.

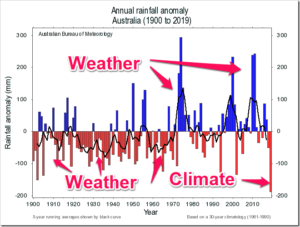
Now we can look at the rainfall data for Australia as a whole from BOM:

Certainly the area either side of the Queensland border shows the lowest rainfall on record, but most of the state has seen periods before with lower rainfall.

Also note that worst fires seem to be clustered towards the Victoria border, where rainfall deficiency has been less severe.

Finally it is worth revisiting the rainfall trend map. It shows that since 1900, most of the country has been getting wetter, with the exception of a small part of Queensland, and some coastal areas of Western Australia and southern Australia along with Tasmania:

Also: Let’s tell the burning truth about bushfires and the ALP-Greens coalition

Also : How Greens Made Australia’s Bushfires Worse

Also: Bushfire scientist David Packham warns of huge blaze threat, urges increase in fuel reduction burns

Also : Australia’s Epic Fires Caused By Bad Forestry And Arson, Not Climate Change

Also : Australian wildfires were caused by humans, not climate change

Also : Australian Bushfires Much Worse In 1974/5

Also : Climatologist: Blaming Aussie Bushfires On Climate Change Is ‘Alarmist Nonsense’

Also : Who Checks The Factcheckers?

Also : Fake News: “The idea that “greenies” … would oppose measures to prevent fires … is simply false.”

Also : Forgotten Fact: 1974/75 Australian Bush Fires Were More Than 9 Times Greater Than Those Of 2019/20!

Also : The Aussie Wildfires Are About Arsonists – Not Climate Change

Also : Climate change: Australia fires will be ‘normal’ in warmer world–Matt McGrath

Also : Australia fires: Aboriginal planners say the bush ‘needs to burn’

Also : Fight fire with fire: controlled burning could have protected Australia

Also : Regional Forest Manager: Politicians are Using Climate Change to Deflect Blame for Bushfires

Also Fight Fires With Facts – Not Fake Science

Are Australian Wildfires Due To Climate Change?

by P. Homewood, December 24, 2019 in NotaLotofPeoppleKnowThat


Many have questioned what role climate change has played in the Australian wildfires currently wreaking havoc in NSW and across the border in Queensland.

The commonly heard cry is that it is now hotter and drier than in the past.

But what does the actual data say?

First, let’s look at rainfall. All the data and graphs  that follows are from the Australian BOM:

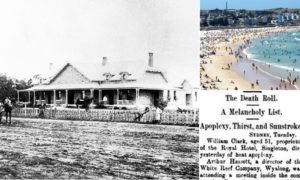
How a 24-DAY heatwave on Australia’s east coast in January 1896 saw temperatures climb to 49 degrees and killed 437 people

by Freya Noble, February 14; 2017 in DailyMail

There were temperatures above 119F (48C)

It was a hot start to 1896 and by January 14, newspapers were reporting people were dying from a range of complications brought on by the extreme temperatures.

By the third week of the year, 12 infants had died from heat-related illnesses in Goulburn, NSW, alone, a report on JoNova about the heatwave revealed.

People were fleeing the cities on trains to seek refuge in the mountainous regions of the country, and one child escaping the heat ‘died at the moment the train arrived’.

Hospitals were at breaking point, and the death toll was rising.


How a 24 DAY heatwave in January 1896 saw temperatures hit 49 degrees and killed 437 people t is as if history is being erased. For all that we hear about recent record-breaking climate extremes, records that are equally extreme, and sometimes even more so, are ignored.
In January 1896 a savage blast “like a furnace” stretched across Australia from east to west and lasted for weeks. The death toll reached 437 people in the eastern states. Newspaper reports showed that in Bourke the heat approached 120°F (48.9°C) on three days (1)(2)(3). The maximumun at or above 102 degrees F (38.9°C) for 24 days straight.
By Tuesday Jan 14, people were reported falling dead in the streets. Unable to sleep, people in Brewarrina walked the streets at night for hours, the thermometer recording 109F at midnight. Overnight, the temperature did not fall below 103°F. On Jan 18 in Wilcannia, five deaths were recorded in one day, the hospitals were overcrowded and reports said that “more deaths are hourly expected”. By January 24, in Bourke, many businesses had shut down (almost everything bar the hotels). Panic stricken Australians were fleeing to the hills in climate refugee trains. As reported at the time, the government felt the situation was so serious that to save lives and ease the suffering of its citizens they added cheaper train services:

Raw Data Bombshell: no change in Very Hot Days in Australia since World War I

by JoNova, November 20, 2019


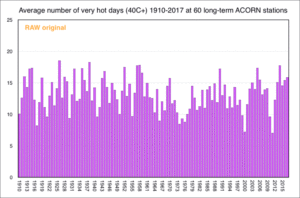
After we were shocked at the latest ACORN changes to our Very Hot Days data, I asked Chris Gillham if we could see the effect of Bureau of Meteorology changes to the original raw data – and he replied it would be too time-consuming writing the code to calculate 40C+ days among the millions of daily temperatures from 112 weather stations across Australia since 1910. Then he did it anyway.

Wow. In 2011, the BoM’s ACORN 1 adjustments wiped out some of the “very hot days” recorded at weather stations in the early 1900s. These were records that had stood for a whole century. Then, quietly six years later, the ACORN 2 readjustments turned the statistical air conditioner on again and cooled people from 100 years in the future.

It’s all especially miraculous given that even the old World War I  data was recorded in official BoM-approved Stevenson screens. The BoM won’t consider pre 1910 data because it wasn’t standardized, but even when it is, they still have to “fix” it. And in the intervening years after 1910, the Urban Heat Islands have grown and electronic equipment that can record one-second-records have been introduced across the nation. With the old equipment, 40C+ extremes were harder to get than with today’s micro-minute spikes caused by gusts of hot air rolling off carparks and tarmacs.

What we see in the 60 longest running ACORN sites, all open in 1910, is that the raw temperature data had just as many “very hot days” in the World War I era as it does now. Oh boy.

No wonder the BOM was keen to move the “Very Hot Days” graphics and data and tuck them away in a remote page on their website.


The Corals That Don’t Exist

by Donna Laframboise, November 18, 2019 in BigPictureNews


In December 2015 Peter Ridd, then a physics professor at Australia’s James Cook University, contacted a journalist. Researchers affiliated with his own institution, he said, were misleading the public about the Great Barrier Reef.

As an example, Ridd cited photos taken approximately 100 years apart near Bowen, a community of 10,000 on the Australian coast in the vicinity of the Reef. These photos tell a stark story: previously vibrant coral expanses are now desolate wastelands.

Ridd complained that this pair of photos was spreading across the Internet. They were appearing in official reports and news stories. Even though the 1995 paper in which they’d first been published had cautioned against viewing them as evidence the Reef was in “broad scale decline,” that’s exactly how they were being used.

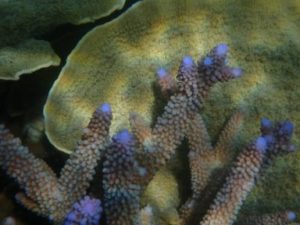
Ridd supplied the journalist with recent photos from the same area. These showed healthy, abundant coral.

CRYING WOLF OVER THE GREAT BARRIER REEF

by Peter Ridd, August 12, 2019 in GWPF


The scare stories about the Great Barrier Reef started in the 1960’s when scientist first started work on the reef. They have been crying wolf ever since.

Scientists from James Cook University have just published a paper on the bleaching and death of corals on the Great Barrier Reef (GBR) and were surprised that the death rate was less than they expected because of the adaptability of corals to changing temperatures. It appears as though they exaggerated their original claims and are quietly backtracking. To misquote Oscar Wilde, to exaggerate once is a misfortune, to do it twice looks like carelessness, but to do it repeatedly looks like unforgivable systemic unreliability by some of our major science organisations.

It is a well-known phenomenon that corals can adapt very rapidly to high temperatures and that if you heat corals in one year, they tend to be less susceptible in future years to overheating. It is the reason why corals are one of the least likely species to be affected by climate change, irrespective of whether you believe the climate is changing by natural fluctuations or from human influence.

AUSTRALIA HIT BY ANTARCTIC FRONT WITH TOWNS RECEIVING THEIR FIRST SNOW IN DECADES

by Cap Allon, August 12, 2019 in Electroverse


Regions just 90 minutes from Sydney received extremely rare snow over the weekend, as an intense cold front released from the Antarctic pushed north past Tasmania.

Blackheath resident Erica Mann was ecstatic to find fresh white powder falling in her garden, saying it was the most snow she had ever seen there:

“I opened the curtains and I could see a huge amount of snow on top of the water tank — it was so exciting,” she said. “It’s amazing. I went up the street … and all the houses are completely covered in snow.”

Residents in the Riverina also received a dumping of snow, with some towns recording their first falls in decades. Cootamundra local Steve Theobald said the last time he remembered snow there was 1985(solar minimum of cycle 21), while residents in Tumut –just 300 metres above sea level– said it was their first fall since 2000.

Other towns in southern NSW which recorded rare snow include Adelong, Harden and Batlow.

The powder continued falling through Sunday and finally began abating on Monday.

See also here (in French)

STRANGE CORAL SPAWNING IMPROVING GREAT BARRIER REEF’S RESILIENCE

by University of Queensland, August 7, 2019 in GWPF


The discovery was made by University of Queensland and CSIRO researchers investigating whether corals that split their spawning over multiple months are more successful at spreading their offspring across different reefs.

Dr Karlo Hock, from UQ’s School of Biological Sciences, said coral mass spawning events are one of the most spectacular events in the oceans.

“They’re incredibly beautiful,” Dr Hock said.

“On Australia’s Great Barrier Reef, all coral colonies typically spawn only once per year, over several nights after the full moon, as the water warms up in late spring.”

Study co-author Dr Christopher Doropoulos from the CSIRO Oceans & Atmosphere said sometimes however, coral split their spawning over two successive months.

“This helps them synchronise their reproduction to the best environmental conditions and moon phases,” he said.

“While reproductive success during split spawning may be lower than usual because it can lead to reduced fertilisation, we found that the release of eggs in two separate smaller events gives the corals a second and improved chance of finding a new home reef.”

The research team brought together multi-disciplinary skills in modelling, coral biology, ecology, and oceanography, simulating the dispersal of coral larvae during these split spawning events, among the more than 3800 reefs that make up the Great Barrier Reef.

Aussie Leaders Bow To Change In Political Climate And Back Coal

by Charles the moderator, May 24, 2019 in WUWT


Climate change was supposed to have won the party the Australian election. But yesterday, routed in the polls, panicking Labor Party leaders backed the opening of a coal field bigger than the UK to mining.

Fearing a wipeout in state elections next year amid a rising tide of pro-coal workers and a rebellion against its plans to halve Australia’s carbon emissions, the Labor state government in Queensland accelerated its decision on 105,000 square miles of coal-rich outback land known as the Galilee Basin.

It came days after the party lost what was dubbed as the “climate election” to the incumbent centre-right, pro-coal government of Scott Morrison, suffering the most damage with swings of up to 20 per cent in the coal country of central Queensland and the Hunter Valley of New South Wales.

Queensland’s premier, Annastacia Palaszczuk, announced she was overturning all attempts to block mining and all outstanding approvals would be resolved within three weeks. She said she was “fed up” with her own government’s processes, and that the election had been a “wake-up call” on mining the basin. The move was welcomed by the federal resources minister, Matt Canavan, who told The Times yesterday that the Galilee Basin represented a victory for the “hi-vis workers’ revolution” — a reference to the armies of mine workers, dressed in high-visibility shirts, who make Australia the world’s biggest coal exporter, and seemingly a reference to the “yellow vest” movement in France which battled President Macron on his climate policies.

Scientists Find No Human Impact On Extreme Rainfall Events In Southeastern Australia…Rather ENSO Related

by P. Gosselin, May 21, 2019 in NoTricksZone


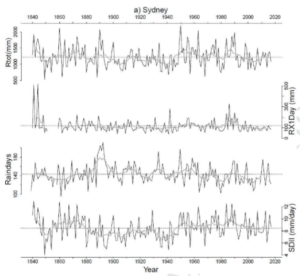
A new study appearing in the Journal of Weather and Climate Extremes titled “Historical extreme rainfall events in southeastern Australia” – led by LindenAshcroft, School of Earth Sciences, University of Melbourne – shows that even more extreme weather in terms of rainfall existed before 1900 in Melbourne, Sydney and Adelaide.

No real trend when examining Sydney, Australia data going back 178 years. Image: Ashcroft et al 2019.

Moreover, the authors found a “moderate and relatively stable relationship between El Niño–Southern Oscillation (ENSO) and annual variations of total rainfall and the number of raindays.”

EDITORIAL: A CLIMATE-CHANGE DRUBBING IN AUSTRALIA

by GWPF from WallStreetJ, May 19, 2019


The right in Australia won on the sharp contrast with the left on taxes, growth and climate change.

If American Democrats want a warning about the consequences of embracing the Green New Deal, look no further than Saturday’s election shocker in Australia. The opposition center-left Labor Party had led in the polls for months but lost as voters rejected its move left on taxes, spending and above all on climate change.

The ruling Liberal-National Coalition had been divided and tossed out two prime ministers during its nearly six years in power. Scott Morrison, the compromise choice as Prime Minister last year, managed to unite conservatives around a platform that stressed economic growth, tax cuts and support for the country’s energy producers.

Labor leader Bill Shorten promised to raise taxes on the “wealthy,” but his main theme was curbing climate change. Labor promised to cut carbon emissions nearly in half by 2030 compared to 2005 levels while subsidizing wind and solar. Mr. Shorten and Labor refused to support a job-producing coal mine in Queensland, and their candidates were routed in the resource-rich province.

Bill Shorten, leader of the Labor Party of Australia, reacts as he concedes defeat during the Labor party election night event in Melbourne, Australia, on Saturday, May 18, 2019. PHOTO: CARLA GOTTGENS/BLOOMBERG NEWS

The next ‘Ferrari of shale’ may be hiding in Australia’s outback

by Bloomberg Business,  May 3, 2019, in theJapantimes


In a corner of the Australian Outback, a drilling crew will soon try tapping shale rocks that could hold more than three times the world’s annual consumption of natural gas.

Origin Energy Ltd. plans to drill two wells later this year in the Northern Territory’s Beetaloo Basin, after the local government ended a three-year ban on fracking — the practice of extracting oil and gas from layers of shale rock deep underground. With an estimated 500 trillion cubic feet (14 trillion cubic meters) of gas, Beetaloo has been compared to famed U.S. shale regions such as Marcellus and Barnett.

But its isolated location, lack of infrastructure and the likelihood of tough environmental opposition make Beetaloo a highly speculative investment.

“There are some big numbers being quoted, and people have to realize this is exploration,” said Mark Schubert, Origin’s head of integrated gas, noting that only some of the total reserves would be extractable.

Australia Surface Temperatures Compared to UAH Satellite Data Over the Last 40 Years

by Roy Spencer, April 3, 2019 in GlobalWarming


Summary: The monthly anomalies in Australia-average surface versus satellite deep-layer lower-tropospheric temperatures correlate at 0.70 (with a 0.57 deg. C standard deviation of their difference), increasing to 0.80 correlation (with a 0.48 deg. C standard deviation of their difference) after accounting for precipitation effects on the relationship. The 40-year trends (1979-2019) are similar for the raw anomalies (+0.21 C/decade for Tsfc, +0.18 deg. C for satellite), but if the satellite and rainfall data are used to estimate Tsfc through a regression relationship, the adjusted satellite data then has a reduced trend of +0.15 C/decade. Thus, those who compare the UAH monthly anomalies to the BOM surface temperature anomalies should expect routine disagreements of 0.5 deg. C or more, due to the inherently different nature of surface versus tropospheric temperature measurements.

Conclusions

The UAH tropospheric temperatures and BOM surface temperatures in Australia are correlated, with similar variability (0.70 correlation).
Accounting for anomalous rainfall conditions increases the correlation to 0.80. The Tsfc trends have a slightly greater warming trend than the tropospheric temperatures, but the reasons for this are unclear. Users of the UAH data should expect monthly differences between the UAH and BOM data of 0.6 deg. C or so on a rather routine basis (after correcting for their different 30-year baselines used for anomalies: BOM uses 1961-1990 and UAH uses 1981-2010).

The ‘trick’: How More Cooling Generates Global Warming

by Jennifer Marohasy, March 5, 2019 in WUWT


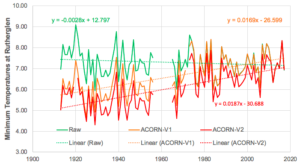
The Bureau of Meteorology has rewritten Australia’s temperature in this way for the second time in just six years – increasing the rate of warming by 23 percent between Version 1 and the new Version 2 of the official ACORN-SAT temperature record.

Temperatures from the Rutherglen research station in rural Victoria are one of the 112 weather stations that make-up ACORN-SAT. Temperature have been changed here by Blair Trewin, under the supervision of David Jones at the Bureau.


Annual average minimum temperatures at Rutherglen (1913 to 2017). Raw temperatures (green) show a mild cooling trend of 0.28 degrees Celsius per 100 years. This cooling trend has been changed to warming of 1.7 degrees Celsius per 100 years in ACORN-SAT Version 1 (orange). These temperatures have been further remodeled in ACORN-SAT Version 1 (red) to give even more dramatic warming, which is now 1.9 degrees Celsius.

CORAL REEFS CAN TAKE THE HEAT, UNLIKE EXPERTS CRYING WOLF

by Peter Ridd, December 26, 2018 in GWPF


Scientists from James Cook University have just published a paper on the bleaching and death of corals on the Great Barrier Reef and were surprised that the death rate was less than they expected, because of the adaptability of corals to changing temperatures.

It appears as though they exaggerated their original claims and are quietly backtracking.

To misquote Oscar Wilde, to exaggerate once is a misfortune, to do it twice looks careless, but to do it repeatedly looks like unforgivable systemic unreliability by some of our major science organisations.

The very rapid adaptation of corals to high temperatures is a well-known phenomenon; besides, if you heat corals in a given year, they tend to be less susceptible in the future to overheating. This is why corals are one of the least likely species to be affected by climate change, irrespective of whether you believe the climate is changing by natural fluctuations or because of human influence.

Corals have a unique way of dealing with changing temperature, by changing the microscopic plants that live inside them. These microscopic plants, called zooxanthellae, give the coral energy from the sun through photosynthesis in exchange for a comfortable home inside the coral. When the water gets hot, these little plants effectively become poisonous to the coral and the coral throws them out, which turns the coral white — that is, it bleaches.


‘Glimmer Of Hope’ For Great Barrier Reef As Study Shows Tolerance To Climate Change

by Nick Visser, December 10, 2018 in Huffpost


Last year’s oceanic heat wave wasn’t as destructive as one the year before, scientists said.

The Great Barrier Reef fared better during an oceanic heat wave last year than during sizzling weather a year earlier that caused hundreds of miles of corals to bleach, according to a study published Monday that suggests the massive structure may be growing more tolerant to climate change.

The report in the journal Nature Climate Change analyzed how corals along the Great Barrier fared in back-to-back mass bleaching events. The reef ― a UNESCO World Heritage Site and the largest living structure on the planet ― was cooked by overheated seawater in 2016 and again in 2017, with images of sickly white coral horrifying people around the globe.

See also here

Coral Adaptation and Epigenetics

by Rud Itsvan, November 17, 2018 in WUWT


WUWT has posted several excellent articles by Jim Steele on how global warming alarmism uses corals as the poster child for warming and acidifying oceans, none of which is scientifically justified. A brief review follows, calling attention to a recently discovered additional adaptation mechanism not covered AFAIK by Jim Steele’s posts. The motivation for this post was triggered by a recent lunch with newish neighbor Charles the Moderator (CtM), and his sharing many wonderful underwater photographs of the coral reef he now dives frequently off Pompano Beach (same reef system as off Fort Lauderdale, just a few miles further north and more conveniently onshore).

Evidence of the Medieval Warm Period in Australia, New Zealand and Oceania

by S. Lüning, January 9, 2018 in WUWT


The climate of the pre-industrial past is of greatest importance to the ongoing climate discussion. Current climate can only be understood when interpreting it in the paleoclimatological context of the past few thousand years. Until not too long ago it was thought that the pre-industrial climate was monotonous and constant. This idea was e.g. promoted by Mann et al. whose famous hockey stick curve featured prominently in the IPCC report of 2001. Over the last 15 years, however, a large number of studies changed this view by providing robust evidence for the existence of significant natural climate variability. Of particular interest are the past 1000 years which commenced with the generally warm ‘Medieval Climate Anomaly’ (MCA, aka ‘Medieval Warm Period’, MWP), that eventually passed into the ‘Little Ice Age’ (LIA), before returning to the warm climate of the current ‘Modern Warm Period’ of the 20th and early 21st centuries.

There have been controversial debates about the existence of the MWP, …