According to the most basic precepts of anthropogenic global warming (AGW), variations in CO2 concentrations exert significant control on sea surface temperatures, glaciers, sea levels, and generalized climate dynamics (i.e., precipitation patterns).
In particular, high CO2 concentrations, driven by human activity, are presumed to cause dangerously warming ocean waters, rapid glacier melt and sea level rise, and overall disruption to the Earth’s biosphere.
Newly published scientific papers wholly undermine this popularized conceptualization.
In fact, according to Bertrand et al. (2017), there has been a “marked cooling” of sea surface temperatures in the southernmost South America region during the last ~800 years — 3°C to 4°C colder than during the Medieval and Roman warm periods — that has continued unabated into “the most recent decades”.
Sometimes you have to wonder which are the biggest fraud: Germany’s claim that its cars are clean, or its claim of being a leader in climate protection. Both, it turns out, are very fake and even downright frauds.
While German Chancellor Angela Merkel and German activists like going around and scolding Donald Trump for his “irresponsible” stance on “greenhouse” gas emissions, it is coming to light that Germany’s climate posturing is indeed a total swindle.
In addition, we consider temperature dependent natural emission and absorption rates, by which the paleoclimatic CO2 variations and the actual CO2 growth rate can well be explained. The anthropogenic contribution to the actual CO2concentration is found to be 4.3%, its fraction to the CO2 increase over the Industrial Era is 15% and the average residence time 4 years.”
Though advocates of the dangerous anthropogenic global warming (AGW) narrative may not welcome the news, evidence that modern day global warming has largely been driven by natural factors – especially solar activity – continues to pile up.
Much of the debate about the Sun’s role in climate change is centered around reconstructions of solar activity that span the last 400 years, which now include satellite data from the late 1970s to present.
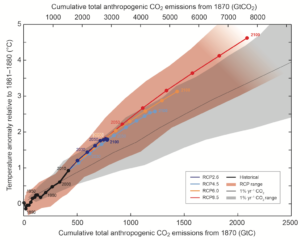
It started as a nice simple idea: There is a finite amount of Carbon that humanity can burn before the planet warms above 2C. This idea was based on AR5 Earth Systems Models (ESMs) ‘showing’ that the relationship between global temperatures and cumulative emissions was linear. At last the IPCC had something easy for world leaders to understand! This was all nicely summarised in Figure SPM-10, shown below. The Paris accord is essentially derived from this one figure.
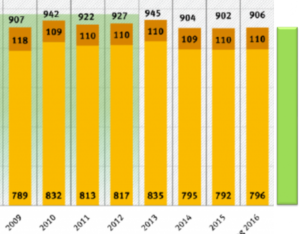
The annual assessment of global greenhouse gas (GHG) emissions by the JRC and the Netherlands Environmental Assessment Agency (PBL) confirms that CO2 emissions have stalled for the third year in a row.
The report provides updated results on the continuous monitoring of the three main greenhouse gases: carbon dioxide (CO2), methane (CH4) and nitrous oxide (N2O).
(…) It appears that the much larger changes predicted by other models arise from additional water vapor evaporated into the atmosphere and not from the CO2 itself (…)
(…) Assuming a doubling of CO2 by the late 21st century (assuming no positive water vapor feedback), we should likely expect to see no more than about 0.3-0.5°C global surface warming and certainly not the 2-5°C warming that has been projected by the GCMs [global circulation models (…)
by Hermann Harde, March 30, 2017 in Inter.J.Atm.Sciences
Including solar and cloud effects as well as all relevant feedback processes our simulations give an equilibrium climate sensitivity of = 0.7°C (temperature increase at doubled CO2) and a solar sensitivity of = 0.17°C (at 0.1% increase of the total solar irradiance). Then CO2 contributes 40% and the Sun 60% to global warming over the last century.
A recently highlighted paper published by atmospheric scientists Scafetta et al., (2017) featured a graph (above) documenting post-2000 trends in the published estimates of the Earth’s climate sensitivity to a doubling of CO2 concentrations (from 280 parts per million to 560 ppm).
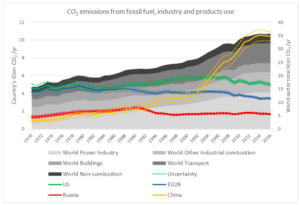
Dans quelle mesure les émissions anthropiques qui s’élèvent à 9 Giga Tonnes par an (dont 1,5 dues au changement d’utilisation des sols) perturbent le cycle du carbone contribuant à l’augmentation de la concentration de CO2 dans l’atmosphère?
Les émissions américaines de CO2 liées à l’énergie ont baissé de 1,7% en 2016. Elles ont toutefois encore atteint près de 5,2 milliards de tonnes l’an dernier, ce qui fait toujours des États-Unis le 2e émetteur mondial après la Chine.
by Nicole Jacobs, October 3, 2017 in ClimateChangeDispatch
The report, which bases its CO2 emissions estimates off International Energy Agency (IEA) and BP data through 2016, found the global CO2 levels essentially remained flat in 2015 and 2016. As BP noted earlier this year, the global trend is “well below the 10-year average growth of 1.6% and a third consecutive year of below-average growth” and that “during 2014-16, average emissions growth has been the lowest over any three-year period since 1981-83.”
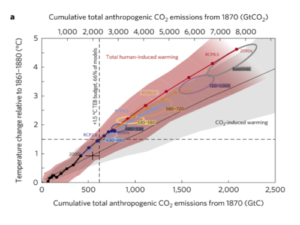
A number of authors, including the IPCC, have argued that climate models have systematically overstated the rate of global warming in recent decades. A recent paper by Millar et al. (2017) presented the same finding in a diagram of temperature change versus cumulative carbon emissions since 1870.
A trend toward greater discrimination under higher CO2 levels is broadly consistent with tree ring studies over the past century, with field and chamber experiments, and with geological records of C3 plants at times of altered atmospheric CO2, but increasing discrimination has not previously been included in studies of long-term atmospheric 13C/12C measurements. We further show that the inferred discrimination increase of 0.014 ± 0.007‰ ppm−1 is largely explained by photorespiratory and mesophyll effects.
by Arthur Viterio, 2016, in J Earth Science Climate Change
Earth’s climate is a remarkably “noisy” system, driven by scores of oscillators, feedback mechanisms, and radiative forcings. Amidst all this noise, identifying a solitary input to the system (i.e., HGFA MAG4/6 seismic activity as a proxy for geothermal heat flux) that explains 62% of the variation in the earth’s surface temperature is a significant finding.
Considering the likelihood of future presentations and discussions, an update of paleoclimatological information was overdue. I was amazed to bump into a full overview of the atmospheric CO2 content of the last 420 million years published much earlier this year. An important milestone in the history of climate on Earth
A natural global warming event that took place 56 million years ago was triggered almost entirely by volcanic eruptions that occurred as Greenland separated from Europe during the opening of the North Atlantic Ocean,
…
The amount of carbon released during this time was vast—more than 30 times larger than all the fossil fuels burned to date and equivalent to all the current conventional and unconventional fossil fuel reserves we could feasibly ever extract.” Ridgwell said.
An unexpected finding was that enhanced organic matter burial was important in ultimately sequestering the released carbon and accelerating the recovery of the Earth’s ecosystem without massive extinctions.
(…) “Nevertheless, we need to be clear that the changes in temperature are gradual, and that recovery can take hundreds of thousands of years. Given the rapid increase in the rate of global warming at present, this kind of wait is not an option for us”.
by Roger Andrews, August 23, 2017 in Energy Matters (blog)
Between 2007 and 2015 total annual US CO2 emissions decreased by 740 million tons (12%). An updated analysis shows that 35% of this decrease was caused by natural gas replacing coal in electricity generation, 30% by lower fuel consumption in the transportation sector, 28% by renewables replacing
La comparaison des fluctuations du CO2 atmosphérique retracées à partir de ces estimations avec des courbes des changements de température a révélé de fortes baisses du CO2 atmosphérique (200-300 ppm), couplées à de fortes hausses de la température moyenne à la surface du globe (5-8°C) à l’échelle de quelques millions d’années.
La géologie, une science plus que passionnante … et diverse