by P. Homewood, July 19, 2022 in NotaLotofPeopleKnowThat
Meanwhile the jokers at the Met Office don’t seem to have realised that their temperature records begin at the depth of the Little Ice Age, or appear to have heard about Urban Heat Islands
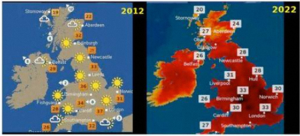
It is mid July 2022. We are currently experiencing a significant – at the time of writing provisionally record-breaking – heatwave for the UK. Red weather warnings for extreme heat are in force for large parts of England and forecasts indicated a real possibility of temperatures reaching up to 40°C in some areas. Indeed, this temperature has already been exceeded. Whether or not records are broken, a key part of the work that we do at the Met Office is climate monitoring, an important aspect of which is the ability to put current weather into historical context. Climate monitoring serves many functions: It can effectively communicate the relative severity of an event; it can indicate how frequently such extremes are likely to occur; and it can monitor how the character or frequency of extremes are changing over time. In order to properly understand the risks from climate change, a key research question climate monitoring can help us to answer is, ‘What are the current weather and climate hazards, risks and impacts that should be expected in the UK and globally?’. To address this question, we must look to the past, and the scientific effort goes back further than you might think.
Making history
In 1663, Robert Hooke stood before the relatively newly formed Royal Society and proposed ‘A method for making the history of the weather’. Hooke and other notable scientists of the time were actively developing instruments capable of making meteorological measurements of wind, rain, air pressure, humidity and temperature. These were the early anemometers, rain gauges, barometers and thermometers of the time1. In his paper, Hooke recommended what should be measured and how it should be recorded, including ‘a scheme at one view representing to the eye the observations of the weather for a month’ and implored his colleagues to undertake such measurements. From a modern climatologist’s point of view, arguably one of the most important advances by Hooke was his recognition that if systematic and consistent measurements were made across the country, or even across the world, then an international perspective on the weather could be obtained, for the benefit of humankind.
…

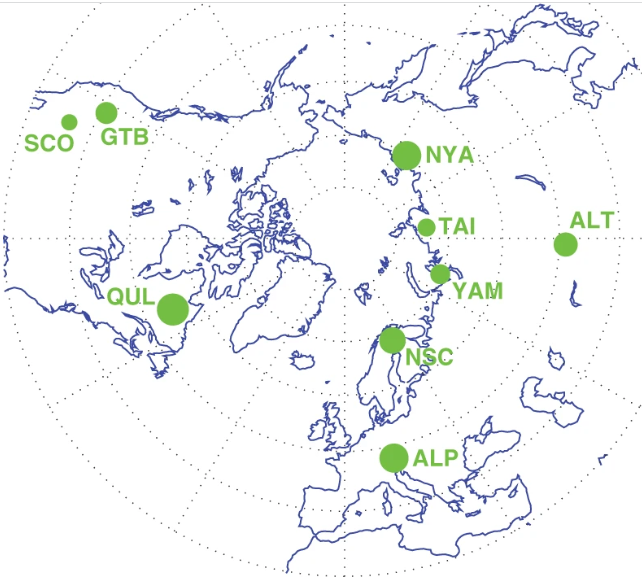 Cropped from Figure 1,