Archives par mot-clé : History

Climate Catastrophe In The 17thC – Geoffrey Parker

by P. Homewood, Apr 9, 2021 in NotaLotofPeoppleKnowThat


Amazon’s blurb sets the scene:

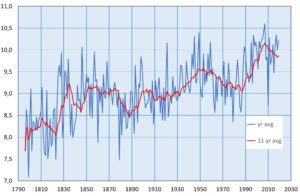
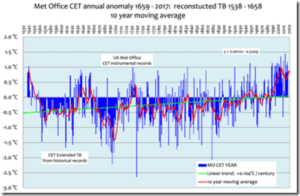
Revolutions, droughts, famines, invasions, wars, regicides – the calamities of the mid-seventeenth century were not only unprecedented, they were agonisingly widespread.  A global crisis extended from England to Japan, and from the Russian Empire to sub-Saharan Africa. North and South America, too, suffered turbulence. The distinguished historian Geoffrey Parker examines first-hand accounts of men and women throughout the world describing what they saw and suffered during a sequence of political, economic and social crises that stretched from 1618 to the 1680s. Parker also deploys scientific evidence concerning climate conditions of the period, and his use of ‘natural’ as well as ‘human’ archives transforms our understanding of the World Crisis. Changes in the prevailing weather patterns during the 1640s and 1650s – longer and harsher winters, and cooler and wetter summers – disrupted growing seasons, causing dearth, malnutrition, and disease, along with more deaths and fewer births. Some contemporaries estimated that one-third of the world died, and much of the surviving historical evidence supports their pessimism.


Amongst these catastrophic events, Parker lists:


Early 17thC

1) West Africa, from the Sahel in the north to Angola in the south, suffered a prolonged drought between 1614 and 1619.

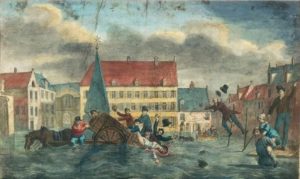
2) Catalonia suffered “the year of the flood” in 1617.

3) All Europe experienced an unusually cold winter in 1620/21, when many rivers froze so hard for 3 months that they could bear the weight of loaded carts; even the Bosphorus froze, an unheard of event.

4) Japan suffered its coldest spring of the century in 1616, while the sub tropical region of Fujian in China had heavy snowfall two years later, another extremely rare event.

5) Droughts in five years out of six between 1616 and 1621 almost the destroyed the new colonies in Virginia.

6) After a few better years, the summer of 1627 in Europe was the wettest for 500 years, followed by the “year without a summer” in 1628, when it was so cold that many crops never ripened.

7) Between 1629 and 1632, much of Europe suffered excessive rains, followed by drought.

8) Conversely, northern India suffered a “perfect drought” in 1630/31, followed the next year by catastrophic floods.

Parker notes that “all of these regions experienced dramatic falls in population

Long Term Changes on the Grindelwald Glacier

by P. Homewood, March 28, 2021 in IowaClimSciEducation


The Upper & Lower Grindelwald Glaciers in 1774 by Caspar Wolf

https://en.wikipedia.org/wiki/Caspar_Wolf

HH Lamb’s Climate, History and The Modern World tells us much about the history of Alpine glaciers. For instance, how they advanced rapidly between 800 and 400 BC. They then retreated before advancing again between AD 600 and AD 850, when they may have even reached Little Ice Age maximum extents.

We are probably all familiar with the terrifying glacier advances, which began in the 17thC, following centuries of a much warmer climate. These were catastrophic for anybody living nearby, as farming land was wiped out, and even the land that escaped being overrun was far too cold to farm. As a result, famine was rife in Switzerland and elsewhere, even in cities which relied on the countryside for food.

People living in those days would have been dumfounded to hear that there are some now who are worried that glaciers are getting smaller.


A paper by Zumbuhl et al, published in 2006, offers a detailed history of the Lower Grindelwald glacier, as well as the Mer de Glace in the Mont Blanc region:

Study Shows Arctic Sea Ice Reached Lowest Point On Modern Record… In The 1940s, Not Today!

by C. Rotter, Jan 24, 2021 in WUWT


Regular NoTricksZone author Kenneth Richards notes on Twitter

Apparently Arctic sea ice volume was as low in the 1940s as it has been in the 2000s.

And the highest sea ice volume of the last 100 years was about 1979 – the year the Arctic sea ice record begins.


Guillian Van Achter1, Leandro Ponsoni1, François Massonnet1, Thierry Fichefet1, and Vincent Legat2

  • 1Georges Lemaitre Center for Earth and Climate Research, Earth and Life Institute, Université Catholique de Louvain, Louvain-la-Neuve, Belgium
  • 2Institute of Mechanics, Materials and Civil Engineering, Applied Mechanics and Mathematics, Université Catholique de Louvain, Louvain-la-Neuve, Belgium

Correspondence: Guillian Van Achter (guillian.vanachter@uclouvain.be) Received: 04 Dec 2019 – Discussion started: 10 Dec 2019 – Revised: 17 Jul 2020 – Accepted: 09 Sep 2020 – Published: 21 Oct 2020

Abstract

We use model simulations from the CESM1-CAM5-BGC-LE dataset to characterise the Arctic sea ice thickness internal variability both spatially and temporally. These properties, and their stationarity, are investigated in three different contexts: (1) constant pre-industrial, (2) historical and (3) projected conditions. Spatial modes of variability show highly stationary patterns regardless of the forcing and mean state. A temporal analysis reveals two peaks of significant variability, and despite a non-stationarity on short timescales, they remain more or less stable until the first half of the 21st century, where they start to change once summer ice-free events occur, after 2050.

How to cite. Van Achter, G., Ponsoni, L., Massonnet, F., Fichefet, T., and Legat, V.: Brief communication: Arctic sea ice thickness internal variability and its changes under historical and anthropogenic forcing, The Cryosphere, 14, 3479–3486, https://doi.org/10.5194/tc-14-3479-2020, 2020.1

Claim: The Temperature Spike Just Prior to the Little Ice Age can Teach Us about Modern Global Warming

by E. Worall, Jan 7, 2021 in WUWT


According to Patric Seifert, a tropospheric researcher at the Leibniz Institute in Germany, a large scale temperature spike occurred just before the onset of the Little Ice Age. Seifert does not think global temperatures are about to crash, but he thinks conditions in Europe are similar enough to the 14th century that historical reconstructions of this medieval heatwave, the Dantean Anomaly, can help us understand what we will face as the world continues to warm.

Extreme 14th Century Droughts May Provide Insight Into Our Climate Change Crisis 

CARLY CASSELLA
9 JANUARY 2021

Scientists are studying a major, once-in-a-century drought from Medieval Europe to better understand how extreme weather events indicate rapid climate changes.

In the years leading up to the Little Ice Age, between 1302 and 1307, many regions on the European continent were facing exceptional heat and drought, according to historical records and data collected from tree rings and sediment cores.

These extreme natural events, while not driven by human emissions, hold similar characteristics to recent weather anomalies, and they could help us better predict the course of modern-day climate change.

“Even if it was a phase of cooling in the Middle Ages and we are now living in a phase of [hu]man-made warming, there could be parallels,” says Patric Seifert, a tropospheric researcher at the Leibniz Institute in Germany.

“The transitional period between two climate phases could be characterized by smaller temperature differences between the latitudes and cause longer-lasting large-scale weather patterns, which could explain an increase in extreme events.“

Today’s Iceland Colder, Icier Than In Last 8,000 Years (Except the 1800s)

by K. Richard, Dec 15, 2020 in ClimateChange Dispatch


A wealth of new research in glacier and sea ice extent shows modern Iceland is 2-4°C colder than all of the last 8,000 years except for a slightly colder late 19th century.

Even the 1700s were warmer with less ice than today in and around Iceland.

A new study (Geirsdóttir et al., 2020) now affirms peak Holocene warmth at least “∼3–4 °C above modern in Iceland” prevailed throughout much of the last 8,000 years.

Data from tree growth, glacier-induced soil erosion, algae productivity, sea ice biomarker proxies (IP25), and other climate indices affirm these conclusions.

Harning et al., 2020 report an overall 7°C Holocene cooling trend In Iceland’s surrounding sea surface temperatures (SST).

“In terms of foraminifera-reconstructed SST, there is an overall trend of cooling throughout the last 8 ka from ~10 °C to ~3 °C.”


It is only in the last few centuries of the modern era that temperatures sharply plummeted to their lowest values of the last 10,000 years (Geirsdóttir et al., 2020).

“The coolest climate of the last 10 ka occurred in the late 1800s CE.”

Consequent to the peak cooling, glaciers and sea ice reached their maximum extents of the Holocene just 150 years ago.

While Iceland’s glaciers and North Shelf sea ice extent did partially recover in the first half of the 20th century, the ice extents are still beyond what they were in the 1700s and earlier.

There is nothing to indicate modern warmth or ice recession in and around Iceland is unprecedented or even unusual.

Read more at No Tricks Zone

Claim: The climate changed rapidly alongside sea ice decline in the north

by University of Copenhagen, Dec 6, 2020 in WUWT


Researchers from the Niels Bohr Institute, University of Copenhagen have, in collaboration with Norwegian researchers in the ERC Synergy project, ICE2ICE, shown that abrupt climate change occurred as a result of widespread decrease of sea ice. This scientific breakthrough concludes a long-lasting debate on the mechanisms causing abrupt climate change during the glacial period. It also documents that the cause of the swiftness and extent of sudden climate change must be found in the oceans.

Scientific evidence for abrupt climate change in the past finally achieved

During the last glacial period, app. 10,000 – 110,000 years ago the northern hemisphere was covered in glacial ice and extensive sea ice, covering the Nordic seas. The cold glacial climate was interrupted by periods of fast warmup of up to 16.5 degrees Celsius over the Greenland ice sheet, the so called Dansgaard Oeschger events (D-O).

These rapid glacial climate fluctuations were discovered in the Greenland ice core drillings decades ago, but the cause of them have been hotly contested. D-O events are of particular significance today as the rate of warming seems to be very much like what can be observed in large parts of the Arctic nowadays. The new results show that the abrupt climate change in the past was closely linked to the quick and extensive decline in sea ice cover in the Nordic seas. Very important knowledge as sea ice is presently decreasing each year.

“Our, up until now, most extensive and detailed reconstruction of sea ice documents the importance of the rapid decrease of sea ice cover and the connected feedback mechanisms causing abrupt climate change”, says Henrik Sadatzki, first author of the study.

Sediment core and ice core data were combined in order to achieve the result

Roger Revelle – the backstory of the father of Atmospheric CO2 monitoring

by A. May, Oct 321, 2020 in WUWT


Roger Revelle was an outstanding and famous oceanographer. He met Al Gore, in the late 1960s, when Gore was a student in one of his classes at Harvard University. Revelle was unsure about the eventual impact of human carbon dioxide emissions on climate, but he did show that all carbon dioxide emitted by man would not be absorbed by the oceans. For an interesting discussion of Revelle’s work in this area see this post on “The Discovery of Global Warming,” by Spencer Weart (Weart, 2007). The original paper, on CO2 absorption by the oceans, published in 1957 by Roger Revelle and Hans Suess, is entitled: “Carbon Dioxide Exchange Between Atmosphere and Ocean and the Question of an Increase of Atmospheric CO2, during the Past Decades” (Revelle & Suess, 1957). This meant that human emissions of carbon dioxide would accumulate in the atmosphere and that the CO2 atmospheric concentration would increase, probably causing Earth’s surface to warm at some unknown rate. This is not an alarming conclusion, as Revelle well knew, but Al Gore turned it into one.

One of Revelle’s good friends was Dr. S. Fred Singer. Singer was a professor of environmental science at the University of Virginia and both Revelle and Singer had been science advisors in the U.S. Department of the Interior. They first met in 1957 and were more than professional colleagues, they were personal friends (Singer, 2003). Unfortunately, Revelle passed away in July 1991 and Singer passed away in April 2020, so we will refer to them and their friendship in the past tense. Both were leading Earth scientists and at the top of their fields, it was natural they would become friends. They also shared an interest in climate change and chose to write an article together near the end of Revelle’s life.


Indeed, ten years later, CO2 emissions were still increasing, but the world had started to cool as shown in Figure 1. This casts considerable doubt on the idea that human emissions somehow control global warming, since some other factor, presumably natural, is strong enough to reverse the overall warming trend for ten years. Revelle was correct to encourage the government to wait for ten more years. Just a year before their paper was published the IPCC reported that warming to date fell within the range of “natural variability” and that the detection of a human influence on climate was “not likely for a decade or more.” (IPCC, 1990, p. XII).

Figure 1. In 1990 and 1991, respectively, the IPCC and Roger Revelle and colleagues said it was too early to do anything about possible man-made climate change, they thought we would know more in 10 years. The plot is smoothed with a 5-year running average to reduce the effect of El Nino and La Nina events. This makes the longer term trends easier to see.

Scientists Find Peak 1940s Warmth, Post-1950s Cooling In The Same Western US Region Where Hockey Sticks Emerged

by K. Richard, Sep 24, 2020 in NoTricksZone


A new 1735-2015 temperature reconstruction (Heeter et al., 2020) using Western US tree ring proxies shows peak 1940s warmth and post-1950s cooling. This is the same region Dr. Michael Mann used tree ring data to construct his famous hockey stick graph.

A new Scandinavian temperature reconstruction (Seftigen et al., 2020) that’s “skillfull in characterizing past temperature changes over the past one to two millennia” finds there

The unfortunate ‘climate anomaly’ of the First World War revealed

by P. Homewood, Sep 4, 2020 in NotaLotofPeopleKnowThat


A new research paper states this anomalous weather coincided with battles where: “The mud and water‐filled trenches and bomb craters swallowed everything, from tanks, to horses and troops, becoming what eyewitnesses described as the ‘liquid grave’ of the armies.”

Prof Alexander F More, who led the research for Harvard, explained: “Atmospheric circulation changed and there was much more rain, much colder weather all over Europe for six years.” “It was a once in a 100-year anomaly.”

This anomaly wreaked havoc on battlefields beginning with the First Battle of Champagne in 1914 , where British, French, and German troops suffered flooded trenches and frostbite while mud “slowed down the movement of troops and artillery”.

The Somme and Verdun in 1916, and the Third Battle of Ypres-Passchendaele in 1917, were slogged out in quagmires caused by the freak downpours which increased casualties.

Royal Artillery signaller John Palmer described his trauma at seeing men “sinking into the slime, dying in the slime” on the Western Front.

WOW!! And no mention of CO2!

Que nous apprend l’Optimum Climatique Romain?

by A. Préat, 4 septembre 2020 in ScienceClimatEnergie


1/ Introduction

SCE a plusieurs fois rapporté que la période actuelle de réchauffement n’est pas exceptionnelle, qu’elle fait partie de cycles décennaux à pluriséculaires de refroidissement et réchauffement qui ont lieu dans des fourchettes de température fort modestes, de l’ordre de 0,15°C par 10 ans. SCE a aussi montré que le CO2 tant incriminé dans ces changements, et surtout l’actuel, n’avait pas de raison d’être, ce gaz venant après l’augmentation de température. Le ‘bouton CO2 ‘ à même d’expliquer ou de ‘justifier’ le battage médiatique quasi-quotidien est donc à ‘la remorque’ de la température et, l’hypothèse de l’effet de serre reste avant tout une hypothèse (exemple ici).

Centennial-Scale Temperature Change During the Common Era Revealed by Quantitative Temperature Reconstructions on the Tibetan Plateau

by Li X. et al., September 3, 2020 in Front.Earth.Sci.


Quantitative palaeotemperature reconstruction is crucial for understanding the evolution of Earth’s climate and reducing uncertainty in future climate predictions. Clarifying the temperature change over the Tibetan Plateau (TP) during the Common Era is critical because it plays a vital role in the prediction of cryosphere changes in such regions under a future warming climate. In this paper, we report a comprehensive synthesis of currently available quantitative temperature records to refine the temperature history of the TP during the Common Era. To date, Common Era quantitative temperature reconstructions are sparse and mainly concentrated in the northeastern TP. Considering seasonal bias of the available quantitative temperature reconstructions, three different composite temperature records for TP were derived, namely the “Standardization” composite, the “Mean annual air temperature anomaly” composite, and the “Mean summer temperature anomaly” composite individually. All the integrated temperature series reveal the Medieval Climate Anomaly and the Little Ice Age, but the start and end timings of these multi-centennial-scale periods and their temperature amplitudes differ. There is strong seasonality in temperature variations on this high plateau, and the 20th century warming was characterized by rapid winter temperature increases, while summer temperatures displayed weak variations. Spatial analysis suggests a relatively consistent signal marking a warm TP during 600–1400 CE and a cold plateau during 1400–1900 CE. Large-scale trends in temperature history for the TP resemble those for China and the Northern Hemisphere. Many factors, such as seasonality of temperature proxies, might lead to uncertainty in the reconstructed series. The results highlight that it is of crucial importance to develop more seasonal temperature reconstructions to improve the reliability of quantitative paleoclimatic reconstructions based on geological records across the TP.

Que nous apprend l’Optimum Climatique Romain?

by A. Préat, 4 septembre 2020 in ScienceClimatEnergie


SCE a plusieurs fois rapporté que la période actuelle de réchauffement n’est pas exceptionnelle, qu’elle fait partie de cycles décennaux à pluriséculaires de refroidissement et réchauffement qui ont lieu dans des fourchettes de température fort modestes, de l’ordre de 0,15°C par 10 ans. SCE a aussi montré que le CO2 tant incriminé dans ces changements, et surtout l’actuel, n’avait pas de raison d’être, ce gaz venant après l’augmentation de température. Le ‘bouton CO2 ‘ à même d’expliquer ou de ‘justifier’ le battage médiatique quasi-quotidien est donc à ‘la remorque’ de la température et, l’hypothèse de l’effet de serre reste avant tout une hypothèse (exemple ici).

Enfin SCE a souvent rappelé (ici et ici) que la concentration atmosphérique de CO2 n’a jamais été aussi basse dans l’histoire géologique de notre planète, qui a connu la plupart du temps des  concentrations jusqu’à 25 fois supérieures au cours du Phanérozoïque (à partir du Cambrien, il y a 541 millions d’années), et même encore bien plus élevées au cours du Précambrien. Nous partirons de ce dernier point, puisque les médias et scientifiques sont toujours  à nous rappeler, de manière assez dramatique, que la teneur actuelle est plus élevée que celle des ‘derniers’ millions d’années (articles médiatiques presque quotidiens, exemple ici parmi une pléthore d’articles). Est-ce bien le cas? et si oui –et toujours pour ces ‘derniers’ millions d’années– quid de la température ?

Extensively-Referenced Study Of Past Scientists’ Global Temperature Estimates Suggests ‘No Change’ In 100 Years

by K. Richard, August 13, 2020 in NoTricksZone


In the early 1900s, the globally-averaged distribution of calculated surface temperature estimates ranged between 14 and 15°C. For 1991-2018, HadCRUT, Berkeley, and NASA GISS also estimate today’s global temperature is about 14.5°C.

Scientists estimating Earth’s surface temperature has been an ongoing pursuit since the early 19th century.

A new study (Kramm et al., 2020) suggests the generally agreed-upon global temperature from 1877 to 1913 from dozens of calculated results was about 14.4°C.

Problematically, HadCRUT, Berkley, and NASA GISS also indicate the 1991-2018 had a global surface temperature of about 14.5°C.

This would suggest there has been “no change in the globally averaged near-surface temperature over the past 100 years”.

Le 20ème siècle a été anormalement chaud mais le 21ème siècle revient à la normale (1/2)

by Jean Van Vliet, 14 août 2020, in ScienceClimatEnergie


Introduction

Suite à la prise de conscience à la fin du 20ème siècle d’une hausse inhabituelle des températures terrestres, des chercheurs américains ont développé une théorie du réchauffement global basé sur l’effet de serre dû au CO2 [1], en soulignant la responsabilité possible de l’homme dans le réchauffement observé: la poursuite des émissions de CO2 conduirait à une éventuelle catastrophe planétaire. Ces  chercheurs ont présenté leur théorie au Congrès américain [2] et aux médias. Le monde politique international a réagi rapidement à cet alarmisme [3] en permettant à Assemblée Générale de l’ONU de décembre 1988 d’approuver la mise en place du GIEC [4].

Depuis plus de trente ans et malgré le manque persistant de preuve formelle, la peur du réchauffement global anthropique causé par le CO2 est propagée sans relâche par l’ONU et ses satellites PNUE, GIEC et OMM relayés par les ONG environnementales et les médias, suivis plus récemment par une fraction du monde académique occidental. Une puissante industrie des énergies renouvelables a été créée via des subsides et des certificats verts quitte à doubler ou tripler le prix de l’électricité. Cette industrie est prête à exploiter les nouvelles aubaines financières annoncées par l’Accord de Paris et le Green Deal de l’UE. Dans un tel contexte, le but avoué est que l’humanité change radicalement son comportement, fût-ce au prix d’une dictature environnementale: l’alarmisme médiatique est maximal, et même les enfants sont embrigadés dans le débat pour soi-disant “sauver la planète”.

Cette tentative rampante de prise du pouvoir a cependant buté contre un obstacle imprévu depuis le début de 2020, à savoir la pandémie du Coronavirus: le lockdown sanitaire a montré que la société pouvait changer son comportement de manière spectaculaire, mais au prix de conséquences économiques et sociales majeures. A la première attaque de la pandémie succède aujourd’hui une deuxième vague et il semble impossible de prévoir quand nous serons délivrés du virus.

Les ressources des Etats n’étant pas infinies, la question brûlante se pose aujourd’hui  de l’affectation des moyens humains et financiers disponibles en fonction nos priorités: devons-nous avoir davantage peur d’une pandémie et de ses conséquences sociales et économiques incontestables ou devons-nous supputer une explosion incontrôlable de la crise climatique amorcée au 20ème siècle et modifiant de manière drastique et irréversible notre environnement ?

Le but du présent article est d’apporter des éléments de réponse à cette question en examinant, dans une perspective scientifique large et basée sur les observations plutôt que sur les modèles, la “crise climatique” démarrée durant la seconde moitié du 20ème siècle en essayant de tirer des conclusions applicables au 21èmesiècle.

1/ La crise ‘climatique du 20ème siècle

Il existe de nombreuses sources fournissant des historiques de température, mais il existe peu de séries chronologiques comparables à celle de l’Observatoire d’Armagh en Irlande du Nord pour la période 1796-2002 [5]; cette série est disponible sur le site web du Met Office britannique pour la période allant de 2002 à aujourd’hui [6].

Figure 1 : Evolution des températures moyennes annuelles de 1796 à 2019 (courbe bleue) ainsi qu’une courbe lissée correspondant à la moyenne glissante rétrospective sur une période de 11 ans (courbe rouge).

Mercury Deposition, Climate Change and Anthropogenic Activities: A Review

by Li, F. et al. July 31, 2020 in Front. Earth.Sci.


As a toxic and harmful global pollutant, mercury enters the environment through natural sources, and human activities. Based on large numbers of previous studies, this paper summarized the characteristics of mercury deposition and the impacts of climate change and human activities on mercury deposition from a global perspective. The results indicated that global mercury deposition changed synchronously, with more accumulation during the glacial period and less accumulation during the interglacial period. Mercury deposition fluctuated greatly during the Early Holocene but was stable and low during the Mid-Holocene. During the Late Holocene, mercury deposition reached the highest value. An increase in precipitation promotes a rise in forest litterfall Hg deposition. Nevertheless, there is a paucity of research on the mechanisms of mercury deposition affected by long-term humidity changes. Mercury accumulation was relatively low before the Industrial Revolution ca. 1840, while after industrialization, intensive industrial activities produced large amounts of anthropogenic mercury emissions and the accumulation increased rapidly. Since the 1970s, the center of global mercury production has gradually shifted from Europe and North America to Asia. On the scale of hundreds of thousands of years, mercury accumulation was greater in cold periods and less in warm periods, reflecting exogenous dust inputs. On millennial timescales, the correspondence between mercury deposition and temperature is less significant, as the former is more closely related to volcanic eruption and human activities. However, there remains significant uncertainties such as non-uniform distribution of research sites, lack of mercury deposition reconstruction with a long timescale and sub-century resolution, and the unclear relationship between precipitation change and mercury accumulation.

New evidence that an extraterrestrial collision 12,800 years ago triggered an abrupt climate change for Earth

by C. Rotter, July 27, 2020 in WUWT


Christopher R. Moore, University of South Carolina

What kicked off the Earth’s rapid cooling 12,800 years ago?

In the space of just a couple of years, average temperatures abruptly dropped, resulting in temperatures as much as 14 degrees Fahrenheit cooler in some regions of the Northern Hemisphere. If a drop like that happened today, it would mean the average temperature of Miami Beach would quickly change to that of current Montreal, Canada. Layers of ice in Greenland show that this cool period in the Northern Hemisphere lasted about 1,400 years.

This climate event, called the Younger Dryas by scientists, marked the beginning of a decline in ice-age megafauna, such as mammoth and mastodon, eventually leading to extinction of more than 35 genera of animals across North America. Although disputed, some research suggests that Younger Dryas environmental changes led to a population decline among the Native Americans known for their distinctive Clovis spear points.

A collision from space would leave its mark on Earth. Vadim Sadovski/Shutterstock.com

What would an Earth impact leave behind?

Persistent warm Mediterranean surface waters during the Roman period

by Margaritelli G. et al., June20, 2020 in Nature OPEN ACESS


Abstract

Reconstruction of last millennia Sea Surface Temperature (SST) evolution is challenging due to the difficulty retrieving good resolution marine records and to the several uncertainties in the available proxy tools. In this regard, the Roman Period (1 CE to 500 CE) was particularly relevant in the socio-cultural development of the Mediterranean region while its climatic characteristics remain uncertain. Here we present a new SST reconstruction from the Sicily Channel based in Mg/Ca ratios measured on the planktonic foraminifer Globigerinoides ruber. This new record is framed in the context of other previously published Mediterranean SST records from the Alboran Sea, Minorca Basin and Aegean Sea and also compared to a north Hemisphere temperature reconstruction. The most solid image that emerges of this trans-Mediterranean comparison is the persistent regional occurrence of a distinct warm phase during the Roman Period. This record comparison consistently shows the Roman as the warmest period of the last 2 kyr, about 2 °C warmer than average values for the late centuries for the Sicily and Western Mediterranean regions. After the Roman Period a general cooling trend developed in the region with several minor oscillations. We hypothesis the potential link between this Roman Climatic Optimum and the expansion and subsequent decline of the Roman Empire.

See also  Roman Warm Period Was 3.6°F Warmer Than Today, New Study Shows

 See also here (GWPF)

Observations historiques d’inondations jusqu’à la fin du 19ème siècle (première partie)

by IRM, 2020


Nos observations historiques d’inondations font l’objet de trois articles. Voici le premier qui traite des inondations jusqu’à la fin du 19ème siècle.

En août 2019, nous avons introduit la possibilité d’envoyer vos propres observations via notre application météo. Cette nouvelle fonctionnalité semble avoir plu aux utilisateurs de notre app, puisque nous avons reçu près de 600.000 observations jusqu’à présent ! Etant donné ce succès, nous avons décidé en avril 2020 d’y ajouter deux nouveaux types d’observations à rapporter : les inondations et les phénomènes optiques. Ces phénomènes ont été observés de tous temps, c’est pourquoi nous avons décidé de nous plonger dans plus d’un millénaire d’anciennes observations de halos et d’arcs-en-ciel. Dans ce nouvel article, vous trouverez quelques observations d’inondations telles qu’elles ont été perçues et décrites dans d’anciens manuscrits, livres et journaux publiés en Europe de l’Ouest jusqu’au 19ème siècle.

Caricature représentant l’actuelle place Saint-Géry, lors de l’inondation de janvier 1820, Collection iconographique (ref. K-573), Archives de la Ville de Bruxelles.


See also Observations historiques d’inondations (deuxième partie)

and Observations historiques d’inondations (troisième partie)

Melting Glaciers Uncover Medieval Artefacts In Norway

by P. Homewood, April 16, 2020 in NotaLotofPeopleKnowThat


Melting glaciers in Norway have revealed ancient artefacts dropped by the side of a road more than 1,000 years ago.

Clothes, tools, equipment and animal bone have been found by a team at a lost mountain pass at Lendbreen in Norway’s mountainous region.

A haul of more than 100 artefacts at the site includes horseshoes, a wooden whisk, a walking stick, a wooden needle, a mitten and a small iron knife.

The team also found the frozen skull of an unlucky horse used to carry loads that did not make it over the ice.

The objects that were contained in ice reveal that the pass was used in the Iron Age, from around AD 300 until the 14th century.

Activity on the pass peaked around AD 1000 and declined after the black death in the 1300s, due as well to economic and climate factors.

The researchers say the melting of mountain glaciers due to climate change has revealed the historical objects, with many more to come.

https://www.dailymail.co.uk/sciencetech/article-8224817/Melting-ice-reveals-lost-Viking-mountain-path.html


Unfortunately neither the journalist nor the scientists seem to be capable of adding 2+2!


The existence of the Medieval Warm Period in Norway, followed by glacial advance in the Little Ice Age has been long known about, as HH Lamb wrote in 1982:

‘HO! FOR THE POLE!’ — DID DUTCH SHIPS REACH THE 89TH LATITUDE IN 1665 AND 1675?

by H. Hardrada, March 8, 2020 in Electroverse


I [Harry Hardrada] recently unearthed an intriguing piece of literature from a 19th century periodical named ‘Ho! For the Pole!’ in Littell’s Living Age, Volume 66 (1860).

The paper highlights various voyages to the North Pole throughout the 17th-18th centuries with meticulous detail. It appears, according to the article, that many wooden ships penetrated as far north as the 89th latitude in ‘open iceless seas’ during this time — as in 1665 and 1675.

A bit far-fetched?

Perhaps, on the face of it… but there is some good evidence out there which may suggest otherwise.

The Rise and Fall of Central England Temperatures; Part 3 2000-2019

by Tony Brown, February 15, 2020 in WUWT


This is the third examination of Central England Temperatures (CET) in a series that commenced in 2015 and which has charted the recent decline in temperatures from their highest values. The two previous articles in this series are referenced here;

The Rise and Fall of Central England Temperatures; Part 1 covering 2000 to 2015

https://judithcurry.com/2015/11/25/the-rise-and-fall-of-central-england-temperature/

The Rise and Fall of Central England Temperatures; Part 2 covering 2000 to 2017

https://wattsupwiththat.com/2018/03/04/the-rise-and-fall-of-central-england-temperatures-help-needed-to-find-missing-data/

When referencing any ‘decline’ we need to put that into context against CET’s overall substantial rise in recent decades. The official CET dataset used in this article, which is compiled by the UK Met office is linked here and shown in Figure A);

https://www.metoffice.gov.uk/hadobs/hadcet/

It should be noted that the values between 1538 and 1658 are my own reconstruction and are not used at all in this current paper.

Note: Weather comprises the day to day events that we all experience. Climate is officially the trend of the weather (often temperature and rainfall) taken over a continuous thirty year period. The two terms have sometimes been used in an interchangeable manner here, when a period of more than a year is being examined.

Figure A

According to the Met office; ‘Since 1974 the data have been adjusted to allow for urban warming: currently a correction of -0.2 °C is applied to mean temperatures.’

Climate Crisis Update–England As Warm As 1736 Last Month!

by P. Homewood, February 13, 2020 in NotaLotofPeopleKnowThat


https://www.metoffice.gov.uk/hadobs/hadcet/cet_info_mean.html

It’s been a mild start to the year here in England. In fact, according to the CET, it’s been the 14th warmest January since the start of records in 1659.

No doubt fingers will be pointed at global warming, but as the above chart shows, we have simply had mild weather of the commonly seen before. The difference is that it lasted virtually all month.

Moreover we have had warmer Januaries way back in the past. The warmest was in 1916, followed by 1921, 1796 and 1834.

https://www.metoffice.gov.uk/hadobs/hadcet/mly_cet_mean_sort.txt

Continuer la lecture de Climate Crisis Update–England As Warm As 1736 Last Month!