by F. Vahrenholt, Dec 14, 2021 in NoTricksZone
On November 3, 2021, the renowned scientific journal Climate published a paper on solar influence on climate.
The paper by the renowned solar researcher Dr. Frank Stefani from the Helmholtz Zentrum Dresden-Rossendorf is entitled: “Solar and Anthropogenic Influences on Climate: A Regression Analysis and Tentative Predictions” and concludes that the influence of CO2 on the development of global temperatures from 1860 until today was only about half as large as the last report of the Intergovernmental Panel on Climate Change (IPCC) assumed.
As a reminder, the IPCC concludes that 98% of the warming ( 1.07 degrees out of 1.09 degrees) is human-induced. According to Stefani’s analysis, the solar influence accounts for 30-70%.
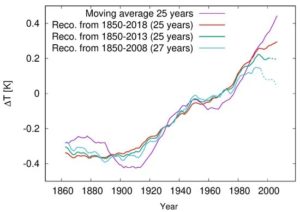
Stefani examined the course of the geomagnetic aa – index, which reflects the strength of the earth’s magnetic field. This index has been measured in Cambridge and Melbourne since 1844 and reflects the influence of solar activity. In earlier publications, Stefani had already been able to prove that the 11-year solar cycle is triggered by the gravitational forces of Venus, Earth and Jupiter, which are in orbital resonance every 11.07 years (here, here and here).
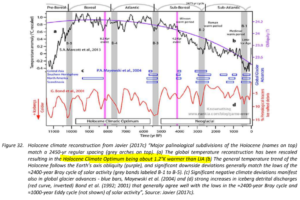
Since the Sun – influenced by all the planets (especially Jupiter and Saturn) – also moves around the center of gravity of the solar system, solar cycles arise that have become known in temperature history as the 193-year Suess-de Vries cycle and the 90-year Gleissberg cycle.
…

 is a
is a