by Dr. Judith Curry, August 27, 2020 in WUWT
Reposted from Dr. Judith Curry’s Climate Etc.
Posted on August 25, 2020
by Ross McKitrick
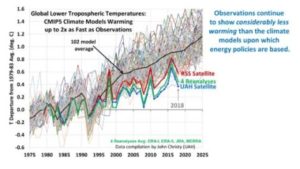
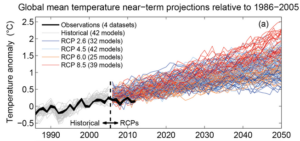
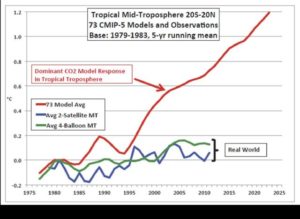
Two new peer-reviewed papers from independent teams confirm that climate models overstate atmospheric warming and the problem has gotten worse over time, not better.
The papers are Mitchell et al. (2020) “The vertical profile of recent tropical temperature trends: Persistent model biases in the context of internal variability” Environmental Research Letters, and McKitrick and Christy (2020) “Pervasive warming bias in CMIP6 tropospheric layers” Earth and Space Science. John and I didn’t know about the Mitchell team’s work until after their paper came out, and they likewise didn’t know about ours.
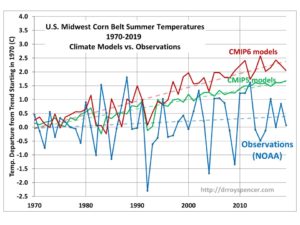
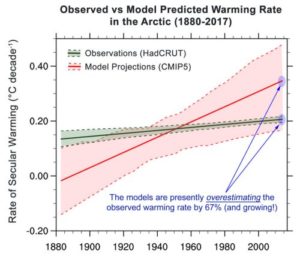
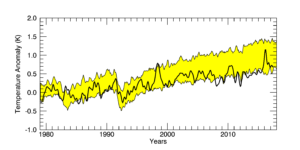
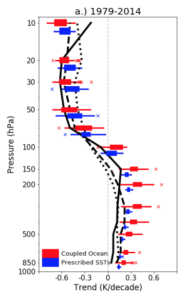
Mitchell et al. look at the surface, troposphere and stratosphere over the tropics (20N to 20S). John and I look at the tropical and global lower- and mid- troposphere. Both papers test large samples of the latest generation (“Coupled Model Intercomparison Project version 6” or CMIP6) climate models, i.e. the ones being used for the next IPCC report, and compare model outputs to post-1979 observations. John and I were able to examine 38 models while Mitchell et al. looked at 48 models. The sheer number makes one wonder why so many are needed, if the science is settled. Both papers looked at “hindcasts,” which are reconstructions of recent historical temperatures in response to observed greenhouse gas emissions and other changes (e.g. aerosols and solar forcing). Across the two papers it emerges that the models overshoot historical warming from the near-surface through the upper troposphere, in the tropics and globally.
Mitchell et al. 2020
Mitchell et al. had, in an earlier study, examined whether the problem is that the models amplify surface warming too much as you go up in altitude, or whether they get the vertical amplification right but start with too much surface warming. The short answer is both.
…