Archives par mot-clé : Sun

Solar variability manifestations in weather and climate characteristics

by Zherebtsov G.A. et al., April 2019 in J.Atm&SolarTerrestrialPhysics


Abstract

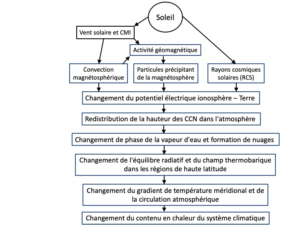
We discuss the issues of primary importance to understand the nature of climate changes in the 20th century and main physical processes responsible for these changes and present a physical model for the solar activity (SA) effect on climate characteristics. A key concept of this model is the heliogeophysical disturbance effect on the Earth climate system parameters driving the long-wave radiation flux moving away from the Earth out into space in high-latitude regions. We address the solar activity effect on the changes in the temperature of the atmosphere and of the World Ocean. The aa–index of the geomagnetic activity (GA) was used as an SA proxy index. We discuss the results of analyzing the regularities and peculiarities of the tropospheric and sea surface temperature (SST) responses to both separate heliogeophysical disturbances and long-term changes in solar and geomagnetic activity. The structure of the tropospheric and SST temperature responses was shown to feature a spatial time irregularity. We revealed the regions, where long-term SST changes are determined mainly by SA variations.

Indications Point To Upcoming Solar Cycle 25 Being Among The Weakest In 200 Years

by F. Bosse and F. Vahrenholt, March 29, 2019 in NoTricksZone


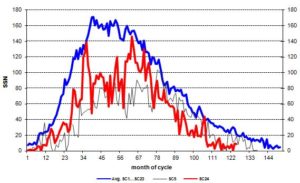
The sun was also very sub-normally active in February. Although we are in the middle of the minimum, the sunspot number of 0.8 for the 123rd month into the cycle is very low. On 26 days of the month no spots were visible, only on 2 days was there a little, symmetrically distributed over both solar hemispheres.The only exciting question currently: When will the minimum be finished and will solar cycle 25 begin? Although 6 spots of the new cycle were already visible in February with a significantly higher resolution, estimates are difficult.March again was dominated by some spots of the “old” SC24.  The rule: “weaker cycles often last longer than stronger cycles” could hold.

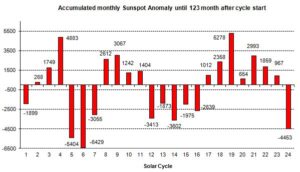
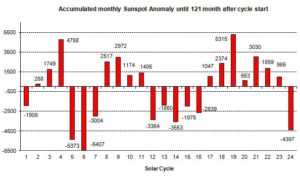
Figure 2: The strength of the sunspot activity of each cycle in comparison. The numbers in the diagram are obtained by adding up the monthly deviations between the observed values and the mean value (blue in Fig.1) up to the current 123rd cycle month.

Figure 2 shows that five cycles (No. 8, 15, 16, 18, 22) did not have a month 123 at all. Instead the following cycle started. In this respect, the picture is now somewhat distorted towards the end of the cycle.

See also here in GWPF

Monster solar storm that hit Earth discovered in the past

by Anthony Watts, March 12, 2019 in WUWT


Something this big today would surely fry electrical grids, GPS, and communications. It may be bigger than the Carrington Solar event of 1859.

Scientists have found evidence of a huge blast of radiation from the Sun that hit Earth more than 2,000 years ago. The result has important implications for the present, because solar storms can disrupt modern technology.

The team found evidence in Greenland ice cores that the Earth was bombarded with solar proton particles in 660BC. The event was about 10 times more powerful than any since modern instrumental records began.

The Sun periodically releases huge blasts of charged particles and other radiation that can travel towards Earth.

The particular kind of solar emission recorded in the Greenland ice is known as a solar proton event (SPE). In the modern era, when these high-energy particles collide with Earth, they can knock out electronics in satellites we rely on for communications and services such as GPS.

Henrik Svensmark: Force Majeure – The Sun’s Role In Climate Change (PDF)

in GWPF, March 11, 2019


London, 11 March: A new report from the Global Warming Policy Foundation reveals that the solar influence on climate is is much larger than is generally recognised.

The report, by Professor Henrik Svensmark of the Danish National Space Institute, outlines some of the remarkable correlations between solar activity and past climate changes. It also shows that the output of the Sun alone – the so-called total solar irradiance – cannot explain them.

“Changes in total solar irradiance are actually quite small”, says Professor Svensmark. “They would have to be nearly 10 times larger to explain how the oceans warm and cool over the 11-year solar cycle.”

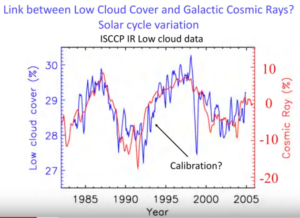
New research suggests that other mechanisms can amplify the effect of solar activity. The New report reviews the possible candidates, concluding that the most likely of these is the effects of galactic cosmic rays on cloud formation. This idea is plausible in theory and has received substantial empirical support in recent years.

However, Professor Svensmark says that insufficient attention is being paid to this research area:

“Galactic cosmic rays seem to be very important drivers of the Earth’s climate. But they are mostly being ignored at the moment because they are seen as distracting from conventional global warming research. Science needs to do better if we want to make progress in understanding the actual impact of natural factors of climate change.”

Henrik Svensmark: Force Majeure – The Sun’s Role In Climate Change (PDF)

About the author
Prof Henrik Svensmark is a physicist and a senior researcher in the Astrophysics and Atmospheric Physics Division of the National Space Institute (DTU Space) in Lyngby, Denmark. Svensmark presently leads the Sun–Climate Research group at DTU Space.
A Month Without Sunspots

by Dr Tony Phillips, March 6, 2019 in SpaceWeatherArchive


March 1, 2019: There are 28 days in February. This year, all 28 of them were spotless. The sun had no sunspots for the entire month of Feb. 2019. This is how the solar disk looked every day:

How does this affect us on Earth? The biggest change may be cosmic rays. High energy particles from deep space penetrate the inner solar system with greater ease during periods of low solar activity. Indeed, NASA spacecraft and space weather balloons are detecting just such an increase in radiation. Cosmic rays can alter the flow of electricity through Earth’s atmosphere, trigger lightning, potentially alter cloud cover, and dose commercial air travelers with extra “rads on a plane.”

As February ended, March is beginning … with no sunspots. Welcome to Solar Minimum!

NASA hides page saying the Sun was the primary climate driver, and clouds and particles are more important than greenhouse gases

by P. Homewood, February 18, 2019 i


Here’s the text from the original page (my bolding).

NASA 2010: What are the primary forcings of the Earth system?

The Sun is the primary forcing of Earth’s climate system. Sunlight warms our world. Sunlight drives atmospheric and oceanic circulation patterns. Sunlight powers the process of photosynthesis that plants need to grow. Sunlight causes convection which carries warmth and water vapor up into the sky where clouds form and bring rain. In short, the Sun drives almost every aspect of our world’s climate system and makes possible life as we know it.

Earth’s orbit around and orientation toward the Sun change over spans of many thousands of years. In turn, these changing “orbital mechanics” force climate to change because they change where and how much sunlight reaches Earth. (Please see for more details.) Thus, changing Earth’s exposure to sunlight forces climate to change. According to scientists’ models of Earth’s orbit and orientation toward the Sun indicate that our world should be just beginning to enter a new period of cooling — perhaps the next ice age.

Repost from JoNova

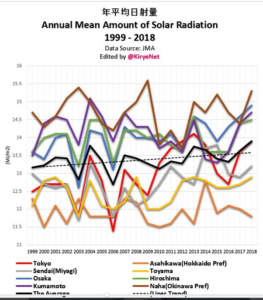
Land Of The Warming Sun: Japan Has Seen Solar Radiation Rise 10% Over Past 60 Years!

by P. Gosselin, February 17, 2019 in NoTricksZone


Today any warming found anywhere almost always gets blamed on heat supposedly getting trapped by rising atmospheric CO2 concentrations. Moreover, activist scientists insist we ignore all other powerful factors such as solar and oceanic cycles.

In fact these activists have become so extreme that they insist that record cold today is caused by warming.

But as people learned already in the first grade, the earth’s surface warms when the sun shines on it, and tends to cool when clouds obstruct the sun.

Solar radiation at the surface has risen over the past decades

In Japan, the Japanese Meteorology Agency (JMA) has 8 stations that measure solar radiation reaching the surface, and many other for recording temperature.

Data from the 8 stations recording solar radiation are plotted since 1999 (i.e. 20 years) as follows:

Data source: JMA

Solar Cycle 24 Going Down As Quietest In Almost 200 Years, May Put The Brakes On Warming

by Von Frank Bosse & F. Vahrenholt, January 30, 2019 in WUWT


Our sun was also very sub-normally active in December last year. We are writing the 121st month since the beginning of cycle number 24, in December 2008, and since 2012 (when we started the blog here) we could only reformulate the opening sentence once: In September 2017 when the sun was 13% more active than the long-term (since 1755) average.

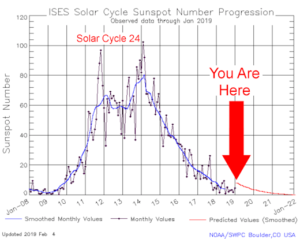
All other months were below average. With the sunspot number (SSN) of 3.1 for the monthly average for December and a total of 24 days without any spot (throughout the second half of the month the sun was spotless) we are in the middle of the cycle minimum.

Fig. 2: The sunspot activity of our sun since cycle 1 (1755). The numbers are calculated by adding the monthly differences with respect to the mean (blue in Fig.1) up to the current cycle month 121.

.

Munich Conference: Leading Danish Astrophysicist Says Solar Activity Has Significant Impact On Global Climate

by Prof. H. Svensmark, January 22, 2019 in NoTricksZone


Danish Professor Henrik Svensmark is a leading physicist of cosmic radiation. At the end of last year he made a presentation at the 12th International Climate Conference in Munich, where he demonstrated that the climate is indeed modulated in large part by cloud cover, which in turn is modulated by solar activity in combination with cosmic rays.

His theory is that cosmic rays, which are extremely fast-flying particles – which originate from dying supernovae – travel through the cosmos, strike the Earth’s atmosphere and have a major impact on cloud cover and thus climate on the Earth’s surface.

This, Svensmark says, has been confirmed in numerous laboratory experiments.

Current Solar Cycle The Third Quietest In More Than 250 Years Of Observation

by F. Bosse & Prof. F. Vahrenholt, December 27, 2018 in ClimateChangeDispatch


The sun was much less active in November than normal, comparing all solar cycles 1-23 up to month no. 120 since the beginning of the systematic survey in 1755, the first year of solar cycle 1.

The latest observed SSN (sunspot number) was a meager 5.9 for the monthly average.

On 16 days the sun was completely “spotless.” The maximum number over the days of November was 15, which does not mean that there were 15 spots – no, the number indicates that 5 spots were observed in a maximum of 1 spot group.

So there was very low spot activity, only 20% of the average value.

92 New Papers (2018) Link Solar Forcing To Climate . . . Some Predict Solar-Induced Global Cooling By 2030!

by K. Richard, December 27, 2018 in NoTricksZone


When it comes to the Sun’s influence on climate, one conclusion is certain: there is no widespread scientific agreement as to how and to what extent solar activity and its related parameters (i.e., galactic cosmic rays, geomagnetic activity, solar wind flux) impact changes in the Earth’s temperature and precipitation.

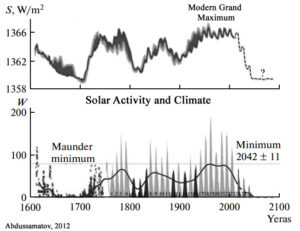
The disagreement is so chasmic and the mechanisms are so poorly understood that scientists’ estimates of the influence of direct solar irradiance forcing between the 17th century and today can range between a negligible +0.1 W m-2 to a very robust +6 W m-2 (Egorova et al., 2018Mazzarella and Scafetta, 2018).

There is no consensus on the amplitude of the historical solar forcing. The estimated magnitude of the total solar irradiance difference between Maunder minimum and present time ranges from 0.1 to 6 W/m2 making uncertain the simulation of the past and future climate.”  (Egorova et al., 2018)


My experience at the German Bundestag’s Environment Committee in a pre-COP24 discussion

by Dr Shaviv, December 7, 2018 in ScienceBits


Three minutes is not a lot of time, so let me be brief. I’ll start with something that might shock you. There is no evidence that CO2 has a large effect on climate. The two arguments used by the IPCC to so called “prove” that humans are the main cause of global warming, and which implies that climate sensitivity is high, are that: a) 20th century warming is unprecedented, and b) there is nothing else to explain the warming.

These arguments are faulty. Why you ask?

We know from the climate-gate e-mails that the hockey stick was an example of shady science. The medieval warm period and little ice ages were in fact global and real.  And, although the IPCC will not admit so, we know that the sun has a large effect on climate, and on the 20th century warming in particular.

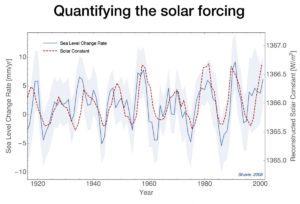
In the first slide we see one of the most important graphs that the IPCC is simply ignoring. Published already in 2008, you can see a very clear correlation between sea level change rate from tide gauges, and solar activity. This proves beyond any doubt that the sun has a large effect on climate. But it is ignored.


Dr. Willie Soon versus the Climate Apocalypse

by WUWT, December 2, 2018


More honesty and less hubris, more evidence and less dogmatism, would do a world of good

Dr. Jeffrey Foss

“What can I do to correct these crazy, super wrong errors?” Willie Soon asked plaintively in a recent e-chat. “What errors, Willie?” I asked.

“Errors in Total Solar Irradiance,” he replied. “The Intergovernmental Panel on Climate Change keeps using the wrong numbers! It’s making me feel sick to keep seeing this error. I keep telling them – but they keep ignoring their mistake.”

Astrophysicist Dr. Willie Soon really does get sick when he sees scientists veering off their mission: to discover the truth. I’ve seen his face flush with shock and shame for science when scientists cherry-pick data. It ruins his appetite – a real downer for someone who loves his food as much as Willie does.

Solar forcing and climate variability during the past millennium as recorded in a high altitude lake: Lake Salda (SW Anatolia)

by I.B. Bauhi & S. Akçer-Ön, August 30, 2018 in QuaternaryInternational


Abstract

Climate variability is a well-known phenomenon and has been frequently, though complex, linked to solar forcing on different time scales. The importance of solar forcing related climate variability is crucial in our understanding of paleoclimate and future climate changes, as well as building climate models. Here in, we present the late Holocene (last ca 1400) climate records from Lake Salda in SW Anatolia using high-resolution micro X-ray Fluorescence (μ-XRF), magnetic susceptibility (MS), stable isotopes13C and δ18O) and TOC-TIC measurements. The age model is constructed by using radionuclide (210Pb, 137Cs and 14C) dating methods. The lake’s high-resolution multiproxy results revealed lake water level fluctuations associated with humid and dry spells during the last 1400 years. Periods of higher lake levels are consistent with solar maxima in total solar irradiance and vice versa. Moreover, the Lake Salda records clearly show dry Dark Ages Cold Period (DACP), humid Medieval Climatic Anomaly (MCA), dry Little Ice Age (LIA), and humid Modern Warm Period (MoWP). These records suggest that the solar forcing, through its influence on the atmospheric circulation, is the main mechanism of climate change during the DACP, MCA, LIA and MoWP in this region.

Earth’s upper atmosphere cooling off dramatically and cosmic rays continue to increase as deep solar minimum approaches

by Paul Dorian, November 5, 2018 in PerspectaWeather


Overview

The sun is blank again today and has been without sunspots about 60% of the time this year as the current historically weak solar cycle heads towards the next solar minimum. Solar cycle 24 is currently on pace to be the weakest sunspot cycle with the fewest sunspots since cycle 14 peaked in February 1906. Solar cycle 24 continues a recent trend of weakening solar cycles which began with solar cycle 21 that peaked around 1980. The last time the sun was this blank in a given year on a percentage basis was 2009 during the last solar minimum when 71% of the time was spotless. That last solar minimum actually reached a nadir in 2008 when an astounding 73% of the year featured a spotless sun – the most spotless days in a given year since 1913. All indications are that the fast-approaching next solar minimum may be even quieter than the last one which was the deepest in nearly a century.

One of the natural consequences of a solar minimum is for the upper part of the Earth’s atmosphere to cool down. Another natural impact of decreasing solar activity is the weakening of the ambient solar wind and its magnetic field which, in turn, allows more cosmic rays to penetrate the solar system. The intensification of cosmic rays can have important consequences on such things as the safety of airline passengers and astronauts in space, Earth’s cloud cover and climate, and possibly even on lightning.

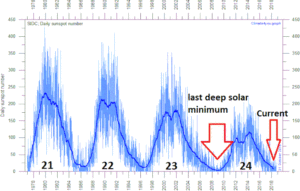
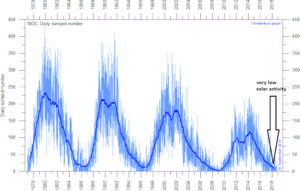
Daily observations of the number of sunspots since 1 January 1977 according to Solar Influences Data Analysis Center (SIDC). The thin blue line indicates the daily sunspot number, while the dark blue line indicates the running annual average. The recent low sunspot activity is clearly reflected in the recent low values for the total solar irradiance. Compare also with the geomagnetic Ap-index. Data source: WDC-SILSO, Royal Observatory of Belgium, Brussels. Last day shown: 31 October 2018. Last diagram update: 1 November 2018.

The Millennial Turning Point – Solar Activity and the Coming Cooling

by Norman Page, November 2, 2018 in WUWT


When analyzing complex systems with multiple interacting variables it is useful to note the advice of Enrico Fermi who reportedly said “never make something more accurate than absolutely necessary”.

My recent paper presented a simple heuristic approach to climate science which plausibly proposed that a Millennial Turning Point (MTP) and peak in solar activity was reached in 1991.

Zharkova et al 2015 DOI:10.10381/srep15683 says ” Dynamo waves are found generated with close frequencies whose interaction leads to beating effects responsible for the grand cycles (350-400 years) superimposed on a standard 22 year cycle. This approach opens a new era in investigation and confident prediction of solar activity on a millenium timescale. ”
Svalgaard concluded in his essay on WUWT 10/27 2018:

The temperature increase since about 1650 is clearly chiefly due to the up- leg in the natural solar activity millennial cycle as shown by Lean 2018 “Estimating Solar Irradiance Since 850 AD” Fig 5

Why Some Scientists Say Global Warming Is Out And Global Cooling Is In

by J. Haskins & H.S. Burnett, October 23, 2018 in ClimateChangeDispatch


In a world riddled with climate-change doomsday predictions, a small but growing number of scientists are saying the highly touted climate models predicting steadily increasing global temperature due to humans’ carbon-dioxide emissions are wrong and that Earth could soon face something even direr: global cooling.

One such climate scientist is Valentina Zharkova, an astrophysicist at Northumbria University in the United Kingdom.

Zharkova and her team of researchers say that based on mathematical models of the Sun’s magnetic activity, it’s likely Earth will experience decreasing magnetic waves over a 33-year period beginning in 2021.

Zharkova is not alone.

Weak sun and El Nino events may create a colder and snowier than normal winter season in much of the eastern half of the USA

by Anthony Watts, October 22, 2018 in WUWT


The fast approaching solar minimum and its potential impact on the upcoming winter season

By Meteorologist Paul Dorian

Overview

In the long term, the sun is the main driver of all weather and climate and multi-decadal trends in solar activity can have major impacts on oceanic and atmospheric temperatures. In addition, empirical observations have shown that the sun can have important ramifications on weather and climate on shorter time scales including those associated with the average solar cycle of around 11-years. For example, there is evidence that low solar activity during solar minimum years tend to be well-correlated with more frequent “high-latitude blocking” events compared to normal and this type of atmospheric phenomenon can play an important role in the winter season.

his plot shows the daily observations of the number of sunspots during the last four solar cycles back to 1 January 1977 according to Solar Influences Data Analysis Center (SIDC). The thin blue line indicates the daily sunspot number, while the dark blue line indicates the running annual average. The current low sunspot activity is indicated by the arrow at the lower right of the plot. Last day shown: 30 Sep 2018. Data source: climate4you.com.

La baisse de l’activité solaire conduit la NASA à annoncer un refroidissement climatique

by Anne Dolhein, 2 october 2018 in Reinformation.TV


La NASA – peu suspecte de climato-scepticisme – s’appuie sur de nouveaux résultats d’observations de température aux confins de l’atmosphère terrestre pour annoncer un refroidissement notable dans ces zones, lié à l’un des minima solaires les plus importants de l’ère spatiale. Il s’agit très clairement d’un refroidissement climatique entraîné par la baisse de l’activité solaire, confirmant le rôle important sinon prépondérant du soleil sur les variations de température de la planète.

« Nous constatons une tendance au refroidissement », vient ainsi de déclarer Martin Mlynczak, chercheur principal associé du centre de recherches Langley de la NASA. « Très loin de la surface de la terre, près du bord de l’espace, notre atmosphère perd de l’énergie calorifique. Si les tendances actuelles se poursuivent, on pourrait bientôt atteindre un record de froid pour notre ère spatiale », a-t-il affirmé.

Environmental “Time Bomb”…China To Dump 20 Million Tonnes Of Solar Panel Waste Into Environment

by P. Gosselin, September 30, 2018 in NoTricksZone


We have to face it: The West has done our planet no favor by moving industrial production and manufacturing to China. Trump is right, many of factories and industries are better back home, even if it means paying a bit more for products.

Not only does the China use the oceans as a global dump for much of its plastic trash, the country now is gearing up to turn parts of the planet into a toxic solar panel waste dump.

According to French science magazine Futura here, we are looking at a “solar panel time bomb”.

Futura describes how China is installing “gigantic” solar panel farms in remote places like Tibet and how 30 years from now the country will have “mountains of solar panels reaching their end of their lives and that nothing is planned for their collection and recycling.”

Hunger Stones and Tree Ring evidence suggests solar cycle influence on climate

by Francis Tucker Manns Ph.D., September 30, 2018 in WUWT


Conclusions

Extreme weather events, mostly drought are considered, but floods as well, correspond to solar minima in more than 75% (18 out of 24 of the cases known).

Current concentrations of carbon dioxide cannot be invoked for extreme weather in the historical past.

The sun controls the climate of the Earth.

During summer it is inevitable that lightning storms ignite fires and produce heavy rain. The intensity of what we have come to call extreme weather is magnified by standing Rossby waves.

Sunspot research tends to emphasize sunspot peaks and sunspot numbers; more may be gained by evaluating trough events and peak and trough frequencies.

NASA: The chill of solar minimum is being felt in our atmosphere – cooling trend seen

by Anthony Watts, September 28, 2018 in WUWT


These results come from the SABER instrument onboard NASA’s TIMED satellite. SABER monitors infrared emissions from carbon dioxide (CO2) and nitric oxide (NO), two substances that play a key role in the energy balance of air 100 to 300 kilometers above our planet’s surface. By measuring the infrared glow of these molecules, SABER can assess the thermal state of gas at the very top of the atmosphere–a layer researchers call “the thermosphere.”

When the thermosphere cools, it shrinks, literally decreasing the radius of Earth’s atmosphere. This shrinkage decreases aerodynamic drag on satellites in low-Earth orbit, extending their lifetimes. That’s the good news. The bad news is, it also delays the natural decay of space junk, resulting in a more cluttered environment around Earth.

How constant is the “solar constant?”

by Andy May, September 19, 2018 in WUWT


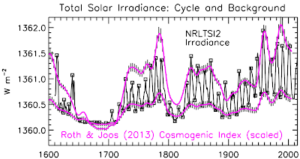
The IPCC lowered their estimate of the impact of solar variability on the Earth’s climate from the already low value of 0.12 W/m2 (Watts per square-meter) given in their fourth report (AR4), to a still lower value of 0.05 W/m2 in the 2013 fifth report (AR5), the new value is illustrated in Figure 1. These are long term values, estimated for the 261-year period 1750-2011 and they apply to the “baseline” of the Schwabe ~11-year solar (or sunspot) cycle, which we will simply call the “solar cycle” in this post. The baseline of the solar cycle is the issue since the peaks are known to vary. The Sun’s output (total solar irradiance or “TSI”) is known to vary at all time scales (Kopp 2016), the question is by how much. The magnitude of short-term changes, less than 11 years, in solar output are known relatively accurately, to better than ±0.1 W/m2. But, the magnitude of solar variability over longer periods of time is poorly understood. Yet, small changes in solar output over long periods of time can affect the Earth’s climate in significant ways (Eddy 1976) and (Eddy 2009).

Harmonic Analysis of Worldwide Temperature Proxies for 2000 Years

by H.J. Lüdecke and C.O. Weiss, April 27, 2017 in TheOpenAtm.Sci.J.


Abstract

The Sun as climate driver is repeatedly discussed in the literature but proofs are often weak. In order to elucidate the solar influence, we have used a large number of temperature proxies worldwide to construct a global temperature mean G7 over the last 2000 years. The Fourier spectrum of G7 shows the strongest components as ~1000-, ~460-, and ~190 – year periods whereas other cycles of the individual proxies are considerably weaker. The G7 temperature extrema coincide with the Roman, medieval, and present optima as well as the well-known minimum of AD 1450 during the Little Ice Age. We have constructed by reverse Fourier transform a representation of G7 using only these three sine functions, which shows a remarkable Pearson correlation of 0.84 with the 31-year running average of G7. The three cycles are also found dominant in the production rates of the solar-induced cosmogenic nuclides 14C and 10Be, most strongly in the ~190 – year period being known as the De Vries/Suess cycle. By wavelet analysis, a new proof has been provided that at least the ~190-year climate cycle has a solar origin.

IPCC’s Kangaroo Science…To Ignore Over 600 Papers Confirming Major Solar Impact On Climate

by P. Gosselin, July 17, 2018 in NoTricksZone


The upcoming 6th IPCC Sixth Assessment Report will be a “comprehensive assessment of the science” related to climate change and published in 2022. However, don’t expect it to be “comprehensive” at all as hundreds of scientific publications showing profound impacts by sun and oceans will go ignored.

Climate science has turned into a religion that centers on a single act of faith. Human CO2 is changing our climate.

In the past it was always understood that climate was impacted by a vast array of factors, such oceanic cycles, solar cycles, aerosols, cloud cover, etc. to name a few.

Images: NASA (public domain)