On June 8th, the California Department of Forestry and Fire Protection (Cal Fire) made its first official announcement via press release that 12 big Northern California wildfires in October 2017 were caused by problems associated with electric utility power lines.
The October 2017 Fire Siege involved more than 170 fires and burned at least 245,000 acres in Northern California. About 11,000 firefighters from 17 states and Australia helped battle the blazes. They concluded that 12 Wildfires in Mendocino, Humboldt, Butte, Sonoma, Lake, and Napa Counties were caused by Pacific Gas & Electric (PG&E) “power and distribution lines, conductors and the failure of power poles.”
The words “global warming” and “climate change” were conspicuously absent from the announcement even…
A team of researchers from the U.K. Met Office, Sweden and Australia has found that three periods of global warming slowdown since 1891 were likely due to natural causes rather than disruptions to the factors causing global warming. In their paper published on the open access site Science Advances, the group describes their study of global mean surface temperatures (GMST) since the late 19th century and what they found.
In this new paper, the researchers looked at GMST as registered by multiple sources around the globe over the past 127 years, noting the slow march of temperature increases. More specifically, they noted the three previously identified slowdowns in GMST increases—the time periods from 1896 to 1910, from 1941 to 1975, and then from 1998 to 2013. They then looked at factors that could have contributed to these slowdowns and found natural causes for each. (…)
Thanks to GWPF for publishing posthumously Bill Gray’s understanding of global warming/climate change. The paper was compiled at his request, completed and now available as Flaws in applying greenhouse warming to Climate Variability This post provides some excerpts in italics with my bolds and some headers. Readers will learn much from the entire document (title above is link to pdf).
The Fundamental Correction
The critical argument that is made by many in the global climate modeling (GCM) community is that an increase in CO2 warming leads to an increase in atmospheric water vapor, resulting in more warming from the absorption of outgoing infrared radiation (IR) by the water vapor (…)
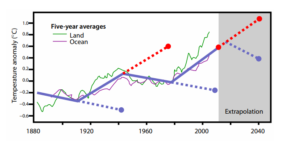
Figure 14: Global surface temperature change since 1880. The dotted blue and dotted red lines illustrate how much error one would have made by extrapolating a multi-decadal cooling or warming trend beyond a typical 25-35 year period. Note the recent 1975-2000 warming trend has not continued, and the global temperature remained relatively constant until 2014.
During 2017, there were 150 graphs from 122 scientific papers published in peer-reviewed journals indicating modern temperatures are not unprecedented, unusual, or hockey-stick-shaped — nor do they fall outside the range of natural variability. We are a little over 4 months into the new publication year and already 81 graphs from 62 scientific papers undermine claims that modern era warming is climatically unusual.
Years ago, Dr. Roger Pielke Sr. explained why sea surface temperatures (SST) were the best indicator of heat content gained or lost from earth’s climate system. Enthalpy is the thermodynamic term for total heat content in a system, and humidity differences in air parcels affect enthalpy. Measuring water temperature directly avoids distorted impressions from air measurements. In addition, ocean covers 71% of the planet surface and thus dominates surface temperature estimates.
More recently, Dr. Ole Humlum reported from his research that air temperatures lag 2-3 months behind changes in SST. He also observed that changes in CO2 atmospheric concentrations lag behind SST by 11-12 months. This latter point is addressed in a previous post Who to Blame for Rising CO2?
Meanwhile, other scientists have been busy determining that only about 50% of the warming and sea ice losses for the Arctic region are anthropogenic, or connected to the rise in CO2 concentrations.
The rest of the warming and ice declines can be attributed to unforced natural variability.
La Global Warming Policy Foundation (GWPF) a publié son rapport sur l’état du climat pour 2017. Etabli par Ole Humlum, Professeur émérite à l’Université d’Oslo, ce rapport est un examen complet du climat mondial.
En voici les 10 principales conclusions :
1. Il est probable que 2017 ait été une des années les plus chaudes depuis le début des mesures instrumentales en 1850, moins chaude cependant que 2016.
2. À la fin de l’année 2017, la température moyenne à la surface de la planète avait retrouvé les niveaux antérieurs à l’épisode El Niño. Cela montre que la hausse récente des températures mondiales a été causée principalement par ce phénomène océanographique dans le Pacifique. Cela suggère aussi que le « hiatus » se poursuivra dans les années à venir.
by P. Homewood, April 5, 2018 in NotaLotofPeopleKnowThat
Hadcrut now have numbers out for February, giving an anomaly of 0.523C, measured against the 1961-90 baseline, slightly down on January’s 0.556C.
This means that the last six months have been below 0.59C.
It is clear that temperatures are settling down at a similar level to the period between 2002 and 2007, following the record El Nino of 2015/16. Bear in mind as well that the degree of accuracy, according to the Hadley Centre, is about +/-0.1C. As such, it cannot be said that there has been any statistically measurable warming since 2001, or indeed previously.
It is possible temperatures may drop further in coming months, with weak La Nina conditions established, although these are predicted to disappear by the summer.
by Paul Homewood, March 27, 2018 in NotaLotofPeopleKnowThat
The GWPF has published its State of the Climate 2017 Report, written by Ole Humlum, former Professor of Physical Geography at the University Centre in Svalbard, Norway, and Emeritus Professor of Physical Geography, University of Oslo, Norway.
by P Homewood, January 27, 2018 in NotaLotofPeopleKnowThat
I see that reality is beginning to intrude upon the dangerous global warming team. They say ” it is plausible, if not likely, that the next 10 years of global temperature change will leave an impression of a ‘global warming hiatus’.”
Climate is controlled by natural cycles. Earth is just past the 2003+/- peak of a millennial cycle and the current cooling trend will likely continue until the next Little Ice Age minimum at about 2650.See the Energy and Environment paper at http://journals.sagepub.com/doi/full/10.1177/0958305X16686488 and an earlier accessible blog version at http://climatesense-norpag.blogspot.com/2017/02/the-coming-cooling-usefully-accurate_17.html
It is clear that 2017 was a very warm year. Tomorrow, NOAA, NASA and the UK Met Office will announce by how much. It won’t be a record-breaker, but it will be in the top five, and that has already started comments about why it has been so hot. After all, the record-setting El Niño temperatures of the 2015-16 are over – so why did it remain so hot? The reason, according to some, is clear: the resurgence of global warming. The year 2017 is the hottest non-El Niño year ever and therefore signifies a dramatic increase of global warming after 20-years or so when the global temperature hasn’t done very much.
Climate Myths: We keep reading about how the extreme weather of 2017 is the “new normal” thanks to global warming — even if the weather in question is frigid air. But the data don’t show any trend in extreme weather events in the U.S. for decades. Science, anyone?
Though advocates of the dangerous anthropogenic global warming (AGW) narrative may not welcome the news, evidence that modern day global warming has largely been driven by natural factors – especially solar activity – continues to pile up.
Much of the debate about the Sun’s role in climate change is centered around reconstructions of solar activity that span the last 400 years, which now include satellite data from the late 1970s to present.
by Hermann Harde, March 30, 2017 in Inter.J.Atm.Sciences
Including solar and cloud effects as well as all relevant feedback processes our simulations give an equilibrium climate sensitivity of = 0.7°C (temperature increase at doubled CO2) and a solar sensitivity of = 0.17°C (at 0.1% increase of the total solar irradiance). Then CO2 contributes 40% and the Sun 60% to global warming over the last century.
The period from 2000 to 2016 shows a modest warming trend that the advocates of the anthropogenic global warming theory have labeled as the “pause” or “hiatus.” These labels were chosen to indicate that the observed temperature standstill period results from an unforced internal fluctuation of the climate (e.g. by heat uptake of the deep ocean) that the computer climate models are claimed to occasionally reproduce without contradicting the anthropogenic global warming theory (AGWT) paradigm. In part 1 of this work, it was shown that the statistical analysis rejects such labels with a 95% confidence because the standstill period has lasted more than the 15 year period limit provided by the AGWT advocates themselves.
L’incroyable nouvelle a été annoncée par Mathieu Vidard dans l’émission La Tête au carrésur France Inter, le 20 septembre 2017 (ici, très brièvement, à partir de 10’, il faut bien viser) :
Maintenir le réchauffement climatique en dessous de 1,5°C, c’est encore possible, c’est l’objectif qui avait été fixé par les Accords de Paris à l’issue de la COP 21. La bonne nouvelle vient d’une équipe de recherche internationale. D’après leurs analyses, l’ampleur du réchauffement climatique qui a déjà eu lieu a été surestimée et la quantité de carbone que l’humanité peut émettre à partir de 2015 en restant en-dessous de ce seuil de 1,5°C serait trois fois supérieure à ce qui avait été annoncé.
In the press release for a newly published and controversial peer-reviewed scientific paper, Australian scientist Dr. Jennifer Marohasy unveiled one of climate science’s better-kept secrets.
She and her colleagues are well aware that the post-1940s Northern Hemisphere (NH) proxy evidence from tree-rings, bore holes, pollen, etc., consistently fails to affirm sharply rising temperatures from the late 20th century onwards.
Prof. Quansheng Ge and his group from the Institute of Geographic Sciences and Natural Resources Research, Chinese Academy of Sciences, collected a large number of proxies and reconstructed a 2000-year temperature series in China with a 10-year resolution, enabling them to quantitatively reveal the characteristics of temperature change in China over a common era.
Few things illustrate the poor state of the communication of climate science better than the reaction to Environmental Protection Agency Administrator Scott Pruitt’s comments about global temperatures in the past 20 years. It was made in written comments to the Senate following his confirmation hearing. He wrote, “over the past two decades satellite data indicates there has been a leveling off of warming.” Has the temperature increase of the Earth’s surface and lower atmosphere “stalled” in the past 20 years or so? Does this change our view of climate change?
The China Meteorological Administration (CMA) has recently developed a new global monthly land-surface air temperature data set called CMA GLSAT. Using it researchers from the administration reanalysed the change in global annual mean land-surface air temperature during three time periods (1901–2014, 1979–2014 and 1998–2014) to see if there was any evidence of a hiatus or pause in recent surface global warming.
The researchers find very clear evidence for the recent warming hiatus. Their results show linear trends of 0.104 °C per decade, 0.247 °C per decade and 0.098 °C per decade for the three periods, respectively. The trends were statistically significant except for the period 1998–2014, the period that is also known as the ‘‘warming hiatus”.
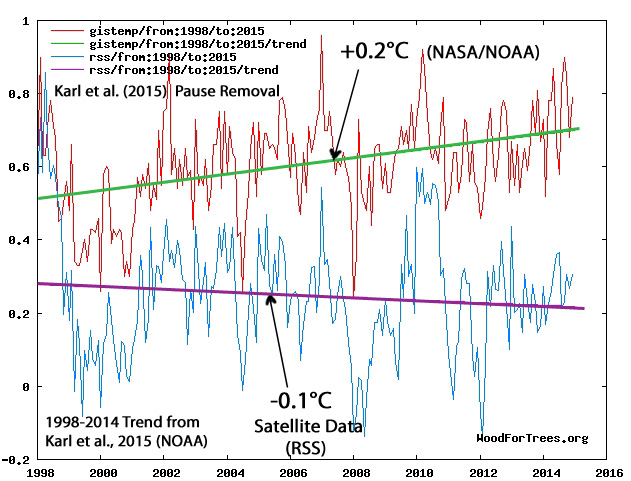
Between the start of 1997 and the end of 2014, average global surface temperature stalled. This 18-year period is known as the global warming pause, also sometimes referred to as the global warming hiatus. The rise in global temperatures that alarmed climate campaigners in the 1990s had slowed so much that the trend was no longer statistically significant. It has been the subject of much research and debate in peer-reviewed scientific journals.
One of the many conundrums facing climate alarmists — who predict that dangerous future global warming will result from increasing concentrations of atmospheric CO2 — is the existence of the aptly-named “warming hiatus.” Also referred to as the “warming pause,” this phenomenon describes a nearly two-decade-long leveling off of global temperatures despite a ten percent increase in atmospheric CO2 concentration since 1998. The significance of these observations resides in the fact that all climate models project that temperatures should not be levelling off, but should be increasing (despite interannual variability) in direct consequence of the ongoing rise in atmospheric CO2.
Some are adamant that the “hiatus” does not and never has existed, and will never change their minds. But the evidence is irrefutable. As a large number of influential climate scientists have just said in the journal Nature Geoscience, since the turn of the century there has been a substantial slowdown in warming that computer climate models did not predict or can explain. In fact, such models predict a warming twice that observed.
Un papier scientifique publié cette semaine par Nature Geoscience du groupe « Nature », peu suspect de complaisance à l’égard des climatoceptiques, constate que le réchauffement climatique a été surestimé par les modèles de prédiction qui justifient l’action concertée contre les émissions de gaz à effet de serre. L’article a la particularité d’avoir pour auteur principal Ben Santer, l’un des pionniers du mouvement qui accuse l’activité humaine du réchauffement climatique.
La géologie, une science plus que passionnante … et diverse

