by P. Gosselin, September 23, 2018 in NoTricksZone
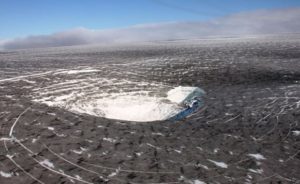
Last year, August, 2017, a massive rockslide occurred on the north flank of the Piz Cengalo (3369 m) in the Swiss Alps, above the village of Bondo, located near the border to Italy.
…
No data suggesting warming is behind rock slides
In total some 4 million tonnes of rock and mud came tumbling down. The dramatic incident highlighted the hazards posed by rock slides for villages located near the picturesque mountains of the European Alps.
Though rockslides are not unusual, there has been growing scrutiny behind their causes lately. Unsurprisingly climate alarmists are opportunistically pointing the finger at climate warming.
SPOTLIGHT: Bureaucracies put their trust in other bureaucracies.
BIG PICTURE: A few weeks back, Joanne Nova perfectly captured the position of the British Broadcasting Corporation (BBC) regarding the scandalous UN entity known as the Intergovernmental Panel on Climate Change (IPCC).
A recent internal document gives BBC journalists advice about how to report on climate matters. In Nova’s words, it declares that the “IPCC is God, can not be wrong.”
Environmental officials warned 30 years ago the Maldives could be completely covered by water due to global warming-induced sea level rise.
That didn’t happen. The Indian Ocean did not swallow the Maldives island chain as predicted by government officials in the 1980s.
In September 1988, the Agence France-Presse (AFP) reported a “gradual rise in average sea level is threatening to completely cover this Indian Ocean nation of 1196 small islands within the next 30 years,” based on predictions made by government officials.
Then-Environmental Affairs Director Hussein Shihab told AFP “an estimated rise of 20 to 30 centimetres in the next 20 to 40 years could be ‘catastrophic’ for most of the islands, which were no more than a metre above sea level.”
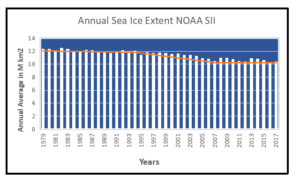
by Ron Clutz, September 22, 2018 in ScienceMatters
People are overthinking and over-analyzing Arctic Ice extents, and getting wrapped around the axle (or should I say axis). So let’s keep it simple and we can all readily understand what is happening up North.
I will use the ever popular NOAA dataset derived from satellite passive microwave sensors. It sometimes understates the ice extents, but everyone refers to it and it is complete from 1979 to 2017. Here’s what NOAA reports (in M km2):
Alternate Title: Yes, We Have No Anthropocene, We Have No Anthropocene Today! (Sung to the tune of Yes, We Have No Bananas)
…
Figure 4 from Finney & Edwards. “Workflow for approval and ratification of a Global Standard Stratotype Section and Point (GSSP) proposal. Extensive discussion and evaluation occurs at the level of the working group, subcommission, and International Commission on Stratigraphy (ICS) Bureau. If approved at these successive levels, a proposal is forwarded to the International Union of Geological Sciences (IUGS) for ratification. This process is also followed for other ICS decisions on standardization, such as approval of names of formal units, of revisions to the units, and to revision or replacement of GSSPs.”
One final gem from Davis’ work is a pronouncement that follows a discussion on the lack of correlation between CO2 and temperature across the historical record, where he aptly reminds us that “correlation does not imply causality, but the absence of correlation proves conclusively the absence of causality.” Consequently, there should be no more doubt regarding the ineffectiveness of atmospheric CO2 to control or drive climate change. It is simply nothing more than a bit player, whose influence has been continually overestimated by climate alarmists. The big question now is whether or not 500 million years of these data will convince them otherwise!
The Katla volcano, hidden beneath the ice cap of Mýrdalsjökull glacier in Iceland, has historically erupted violently once every 40-80 years. In-as-much as it’s last such eruption took place one hundred years ago, in 1918, Katla’s next eruption is long overdue.
An eruption in Katla would dwarf the 2010 Eyjafjallajökull eruption, scientists have warned.
A new study by Icelandic and British geologists showed that Katla is emitting enormous quantities of CO2 – at least 20 kilotons of CO2 every day. Only two volcanoes worldwide are known to emit more CO2, Evgenia Ilyinskaya a volcanologist with the University of Leeds told the Icelandic National Broadcasting Service RÚV.
…
N ICE CAULDRON IN MÝRDALSJÖKULL Geothermal activity in the volcano’s caldera melts the glacier, creating cauldrons in the ice. Photo/Fréttablaðið
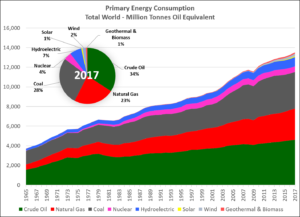
One of my favorite sayings is, “We didn’t leave the Stone Age because we ran out of stones.” Technically we never left the Stone Age because we use more rocks now than we did in the Stone Age.
And we never left the “Wood Age.” There was no energy transition from biomass (wood) to fossil fuels. Coal piled on top of biomass, oil piled on top of coal and natural gas piled on top of oil
by P. Gosselin, September 21, 2018 in NoTricksZone
Despite all the signals being sent from every direction suggesting global warming is leading to more frequent and intense hurricanes, even the warmist NOAA is forced to confess that this has not been the long-term case.
by M. Bastasch, September 19, 2018 in ClimateChangeDispatch
Hurricane Florence made landfall on Friday in North Carolina, bringing heavy rains and flooding. But before the storm touched down in the U.S., scientists and news outlets were already linking the storm to global warming.
However, not all scientists agree that man-made warming is making hurricanes, including Florence, bigger, slower and wetter as is often claimed in the media.
Climatologist Judith Curry called efforts by the “mainstream climate community” to link Florence to man-made global warming “woefully inadequate and misleading to scientists, the public and policymakers.”
Nearly seven years ago, on December 7th, 2011, the Free Market Environmental Law Clinic’s (FME Law) sought public records from the University of Arizona related to the Mann-Bradley-Hughes temperature reconstruction that looks like a hockey stick, and development of an Intergovernmental Panel on Climate Change (IPCC) report. They refused much of the request and FME Law sued. Now (on September 18th, 2018) legal counsel for the University informed FME Law that they were done, that they would be withdrawing their appeal of the trial court’s decision, end the case and disclose the records.
Included in the release will be emails that, for example, provide the full context of the discussions between Michael Mann and colleagues and Chick Keller on whether there was a medieval warm period and a little ice age. Mann, Bradley and Hughes (MBH) were the authors of the “hockey stick” graph that became the icon of climate alarmism. Dr. Keller was, at the time, Director of the Institute of Geophysics and Planetary Physics at the Los Alamos National Lab and affiliated with the University of California at San Diego, and wanted to reconcile data which appeared to refute the MBH papers. Also within this collection will be the full discussion on events surrounding an effort to remove editors of journals willing to publish peer-reviewed papers that contradicted the MBH and related papers on which climate alarmism was built. This collection of emails is particularly important in that they will provide the full context of Climategate emails that have been described as “cherry picking.”
by P. Gosselin, September 19, 2018 in ClimateChangeDispatch
The German ADAC association, the equivalent of America’s AAA, carried a CO2 comparison for a variety e-autos and combustion engine cars. The results were very surprising, says German magazine Autobild here.
Today’s electric cars are being pushed as a clean and environmentally friendly alternative, while diesel and gasoline burning engines are being villainized as polluters and climate killer …
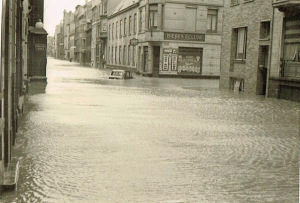
Les côtes de Flandre n’ont pas toujours été aussi paisibles qu’aujourd’hui, et je n’oublie pas le raz-de-marée du 31 janvier 1953 qui toucha les Pays-Bas et notre littoral, faisant plus de 1800 morts et des dégâts considérables. (photo : à Ostende).
Pêchés dans diverses chroniques et ouvrages (notamment “La Flandre mystérieuse” de Saint Hilaire), j’en ai fait une compilation qui n’a bien entendu aucune prétention scientifique ou historique, mais ces événements avaient laissé une trace dans la mémoire populaire, trace qui a hélas fortement tendance à s’effacer.
J’y ajoute quelques événements survenus en France et aux Pays-Bas, dont on peut raisonnablement penser au vu de leur localisation, qu’ils eurent des conséquences sur nos côtes
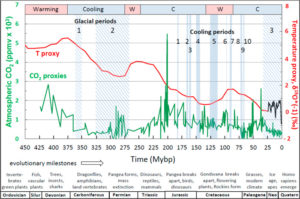
The IPCC lowered their estimate of the impact of solar variability on the Earth’s climate from the already low value of 0.12 W/m2 (Watts per square-meter) given in their fourth report (AR4), to a still lower value of 0.05 W/m2 in the 2013 fifth report (AR5), the new value is illustrated in Figure 1. These are long term values, estimated for the 261-year period 1750-2011 and they apply to the “baseline” of the Schwabe ~11-year solar (or sunspot) cycle, which we will simply call the “solar cycle” in this post. The baseline of the solar cycle is the issue since the peaks are known to vary. The Sun’s output (total solar irradiance or “TSI”) is known to vary at all time scales (Kopp 2016), the question is by how much. The magnitude of short-term changes, less than 11 years, in solar output are known relatively accurately, to better than ±0.1 W/m2. But, the magnitude of solar variability over longer periods of time is poorly understood. Yet, small changes in solar output over long periods of time can affect the Earth’s climate in significant ways (Eddy 1976) and (Eddy 2009).
Everyone will be familiar with the difficulty of listening to a conversation held with a friend in a crowded room with many other conversations going on at the same time. So it is with many fields of scientific investigation where it is difficult to tease a particular trend out from masses of data. In the first case, we could call the friend’s conversation ‘The Signal’, and the background conversations ‘The Noise’.
In looking at climate data, trends (the signal) can be graphically represented by a (generally) smooth curve, usually flanked by a range of experimentally predicted or actually measured values (the noise). Joining up every point on a graph of such data would give a jagged line which could be thought of as a combination of many alternating functions over a wide range of frequencies.
Yes… I know entropy falls under the Second Law of Thermodynamics… But I doubt the author of the Clean Technica article does. [Author’s note: By “falls under the Second Law of Thermodynamics, I don’t mean decreases; I mean it falls under the “jurisdiction” of the Second Law of Thermodynamics.]
Michael Bloomberg est un milliardaire américain (pas un petit : l’une des vingt plus grosses fortunes mondiales), membre du parti démocrate, ancien maire de New York. C’est naturellement un farouche défenseur de l’environnement, ce qui lui a valu d’être nommé par le Secrétaire Général des Nations-Unies « envoyé spécial pour l’action climatique ». On ne peut pas le soupçonner de minorer le développement des énergies propres.
LES INVESTISSEMENTS DANS L’ÉNERGIE « PROPRE » SONT EN DÉCLIN
Le rapport1 que publie l’entreprise qu’il dirige (en fait une filiale consacrée aux énergies nouvelles) montre que les investissements dans « l’énergie propre », définie comme l’éolien et le photovoltaïque, ont diminué dans la plupart des pays du globe au cours des années 2010. Le point haut a été atteint en 2011. Depuis cette date, les investissements stagnent ou diminuent, à des taux divers selon les pays et les années.
La COP21, en 2015, devait sauver le monde grâce à des investissements massifs dans ces domaines. Elle n’a rien fait de tel. Au contraire, les années 2016, 2017 et 2018 sont marquées par une accélération de la baisse des investissements.
This article claim ships will “be able to sail right over the North Pole” by 2050 due to warming, but at the same time say ship tracks will make more clouds and cool the Arctic. Of course, anything is possible with the help of climate models.
More ships and more clouds mean cooling in the Arctic
With sea ice in the Arctic melting at an alarming rate, opportunities for trans-Arctic shipping are opening up, and by mid-century ships will be able to sail right over the North Pole – something not previously possible for humankind.
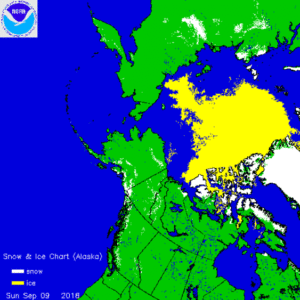
by Ron Clutz, September 17, 2018 in ScienceMatters
One week ago on day 252 MASIE reported the lowest daily extent of the year at 4.43M km2. One week later the image above shows how the ice edges have refrozen and extended. Note also the significant snowfall both in Canada and Russia
by J.C. Maurin, 16 septembre 2018, in Science,Climate,Energie
Dans les années 80, la découverte dans les archives glaciaires d’une corrélation entre température et taux de CO2 permit de soupçonner une influence anthropique sur le climat: les taux mesurés depuis 1958 étaient supérieurs aux taux des archives glaciaires.
L’IPPC (GIEC) fut créé en 1988 par 2 organismes: United Nations Environment Programme (UNEP) et World Meteorological Organization (WMO). Le GIEC attribue l’intégralité de la hausse du taux de CO2 depuis un siècle à l’influence humaine. Pour les dernières décennies, nous examinerons ici les mesures disponibles, les corrélations CO2 / température, enfin le modèle anthropique GIEC sera confronté à un modèle concurrent.
Even before Hurricane Florence made landfall somewhere near the border of North and South Carolina, predicted damage from potentially catastrophic flooding from the storm was already being blamed on global warming.
Writing for NBC News, Kristina Dahl contended, “With each new storm, we are forced to question whether this is our new, climate change-fueled reality, and to ask ourselves what we can do to minimize the toll from supercharged storms.”
The theory is that tropical cyclones have slowed down in their speed by about 10 percent over the past 70 years due to a retreat of the jet stream farther north, depriving storms of steering currents and making them stall and keep raining in one location. This is what happened with Hurricane Harvey in Houston last year.
But like most claims regarding global warming, the real effect is small, probably temporary, and most likely due to natural weather patterns …
There is no doubt that there is merit in the widely accepted Milankovitch theory that Ice Ages and their terminations are controlled by solar input to the NH in mid-summer. It is also clear that relying on the solar input to the NH alone, does not adequately account for the occurrence of terminations of Ice Ages. The variation of solar input to high latitudes is modulated by precession, which produces continual up-lobes and down-lobes in solar input with a ~ 22,000-year period. While every termination is accompanied by the 5,500-year rising portion of an up-lobe in the solar input to high latitudes, many strong up-lobes do not produce a termination….
The end of the Little Ice Age in the European Alps has long been a paradox to glaciology and climatology. Glaciers in the Alps began to retreat abruptly in the mid-19th century, but reconstructions of temperature and precipitation indicate that glaciers should have instead advanced into the 20th century. We observe that industrial black carbon in snow began to increase markedly in the mid-19th century and show with simulations that the associated increases in absorbed sunlight by black carbon in snow and snowmelt were of sufficient magnitude to cause this scale of glacier retreat. This hypothesis offers a physically based explanation for the glacier retreat that maintains consistency with the temperature and precipitation reconstructions.
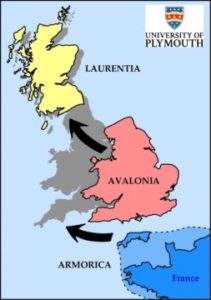
The British mainland was formed from the collision of not two, but three ancient continental land masses, according to new research.
Scientists have for centuries believed that England, Wales and Scotland were created by the merger of Avalonia and Laurentia more than 400 million years ago.
However, geologists based at the University of Plymouth now believe that a third land mass — Armorica — was also involved in the process.
The findings are published in Nature Communications and follow an extensive study of mineral properties at exposed rock features across Devon and Cornwall …
Credit: University of Plymouth
La géologie, une science plus que passionnante … et diverse