Most estimates of Chinese regional Surface Air Temperatures since the late-19th century have identified two relatively warm periods – 1920s–40s and 1990s–present. However, there is considerable debate over how the two periods compare to each other. Some argue the current warm period is much warmer than the earlier warm period. Others argue the earlier warm period was comparable to the present. In this collaborative paper, including authors from both camps, the reasons for this ongoing debate are discussed. Several different estimates of Chinese temperature trends, both new and previously published, are considered. A study of the effects of urbanization bias on Chinese temperature trends was carried out using the new updated version of the Global Historical Climatology Network (GHCN) – version 4 (currently in beta production)
Over millennia, the reef has adapted to sudden changes in environment by migrating across the sea floor as the oceans rose and fell.
The study published today in Nature Geoscience, led by University of Sydney’s Associate Professor Jody Webster, is the first of its kind to reconstruct the evolution of the reef over the past 30 millennia in response to major, abrupt environmental change.
The 10-year, multinational effort has shown the reef is more resilient to major environmental changes such as sea-level rise and sea-temperature change than previously thought but also showed a high sensitivity to increased sediment input and poor water quality. (…)
This manntastic event looms large. With the irascible Dr. Mann pitted against Moore and Curry, fireworks are almost guaranteed. Titley is a lightweight and he’ll be overshadowed by Mann’s huge ego and need to control the conversation. Their idea to hear a “collegial and balanced” discussion may very well be a pipe dream, especially after what happened the last time when Mann and Curry were testifying before congress.
BIG PICTURE: The Population Bomb was first published in May 1968 – 50 years ago this month. Page one of my copy, printed in 1970, describes its author as “a qualified scientist.” The back cover provides further detail: (…)
A landmark paper by warmist scientists in Nature Geosciencenow concedes the world has indeed not warmed as predicted, thanks to a slowdown in the first 15 years of this century. One of its authors, Michael Grubb, professor of international energy and climate change at University College London, admits his past predictions of runaway warming were too alarmist.
“When the facts change, I change my mind. We are in a better place than I thought.”
ANOTHER author, Myles Allen, professor of geosystem science at Oxford, confessed that too many of the mathematical models used by climate scientists to predict future warming “were on the hot side” — meaning they exaggerated.
“We haven’t seen that rapid acceleration in warming after 2000 that we see in the models.”
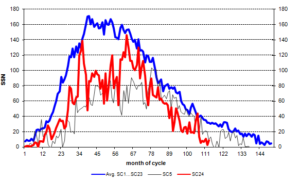
The sun was inactive in April, as we currently find ourselves in the minimum between solar cycle (SC) 24 and the coming solar cycle 25.
The recorded mean sunspot number (SSN) for April was 8.9, which is only 28% of what is usual 113 months into a solar cycle. In April, 16 days were spotless. The following chart shows sunspot activity (…)
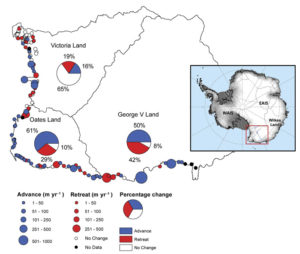
In describing their findings, Lovell et al. state that “between 1972 and 2013, 36% of glacier termini in the entire study area advanced and 25% of glacier termini retreated, with the remainder showing no discernible change outside of the measurement error (± 66 m or ± 1.6 m yr-1) and classified as ‘no change'” (see figure below). Although there were some regional differences in glacier termini changes, these regions over the last four decades were more closely linked to non-climatic drivers, such as terminus type and geometry, than any obvious climatic or oceanic forcing.”
By Field Museum, May 24, 2018 in ScienceDaily (CurrentBiology)
Sixty-six million years ago, the world burned. An asteroid crashed to Earth with a force one million times larger than the largest atomic bomb, causing the extinction of the dinosaurs. But dinosaurs weren’t the only ones that got hit hard — in a new study, scientists learned that the planet’s forests were decimated, leading to the extinction of tree-dwelling birds.
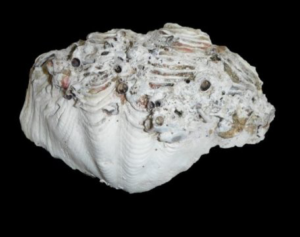
A highly precise method to determine past typhoon occurrences from giant clam shells has been developed, with the hope of using this method to predict future cyclone activity.
A team of researchers led by Tsuyoshi Watanabe of Hokkaido University has discovered that giant clams record short-term environmental changes, such as those caused by typhoons, in their shells. Analyzing the shell’s microstructure and chemical composition could reveal data about typhoons that occurred before written records were available… (…)
The whole Tridacna maxima valve. The shell was cut in two sections along the maximum growth axis.
Credit: Komagoe T. et al., Journal of Geophysical Research: Biogeosciences, April 19, 2018
Scientists claim that the ocean’s global mean surface pH may have declined (i.e., became less alkaline and thus more “acidic”) by -0.08 in the last 265 years — from 8.13 during pre-industrial times to 8.05 today. That’s an overall, long-term pH change rate of -0.0003 per year.
By way of comparison, from one season to the next, or over the course of less than a year, pH levels naturally change by twice that amount (±0.15 pH units). On a per-decade scale, oceanic pH can naturally fluctuate up and down by up to 0.6 units within a span of a decade (as shown in red below).
Writing as background for their study, Duvat et al. (2017) state that “it has commonly been considered that atoll reef islands would disappear under climate change, as a result of sea-level rise and induced accelerating shoreline erosion,” citing the works of Connell (2003), Dickinson (2009) and McAdam (2010). This perception is based on model predictions, which have been hyped all over the globe, especially among politicians and the media, some of whom demand reparations for small island States who they fear will be forced to abandon their islands within decades.
But how much faith should one place in such projections and concerns?
Have you been keeping an eye on Sol lately? One of the top astronomy stories for 2018 may be what’s not happening, and how inactive our host star has become.
The strange tale of Solar Cycle #24 is ending with an expected whimper: as of May 8th, the Earthward face of the Sun had been spotless for 73 out of 128 days thus far for 2018, or more than 57% of the time. This wasn’t entirely unexpected, as the solar minimum between solar cycle #23 and #24 saw 260 spotless days in 2009 – the most recorded in a single year since 1913.
Cycle #24 got off to a late and sputtering start, and though it produced some whopper sunspots reminiscent of the Sol we knew and loved on 20th century cycles past, it was a chronic under-performer overall. Mid-2018 may see the end of cycle #24 and the start of Cycle #25… or will it?
The well has been drilled through the Lower Bowland shale at a depth of approximately 2,700m (8,860 ft) below ground and extends laterally 800m (2,620 ft).
Francis Egan, chief executive officer of Cuadrilla, said the government’s recent announcement underlined the “national importance of shale gas”.
“We are now very close to demonstrating that Lancashire shale gas can be commercially developed in a safe and environmentally responsible manner.”
The firm said drilling on a second horizontal shale gas exploration well at the site is due to be complete soon when it will lodge a second fracking application.
It said it expects to start fracking both wells later this year.
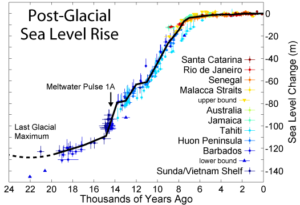
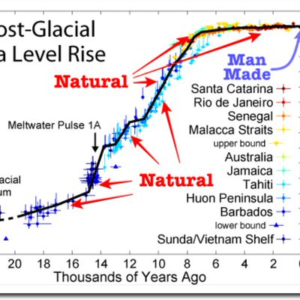
In Figure 29 of that paper, Hansen claims to show that sea level rise has been accelerating, from 0.6 mm/year from 1900 to 1930, to 1.4 mm/year from 1930 to 1992, and 2.6 mm/year from 1993 to 2015.
When marine algae die, they usually float in slow motion to the ocean’s depths. However, during an expedition with the research icebreaker Polarstern to the Arctic in the spring of 2015, scientists from the Alfred Wegener Institute, Helmholtz Centre for Polar and Marine Research (AWI) discovered a phenomenon that significantly accelerate this transport: tiny gypsum crystals, which form during the freezing of salt in the porous spaces of Arctic sea ice, weigh down the phytoplankton like heavy ballast, pulling them to the bottom within a matter of hours. The effect is like an express elevator for the carbon they contain. “This mechanism was previously completely unknown,” says marine bio-geologist Dr Jutta Wollenburg … (…)
by Li M. et al., 2017 in CO2Science/Int.J.Biometeorology
In discussing the characteristics of their three-century temperature proxy, the authors report the existence of two prominent decadal-scale cold periods (1801-1833 and 1961-2003) and two prominent decadal-scale warm periods (1730-1800 and 1928-1960). They also note that “fifteen extreme cold years (< -1.5σ) were identified and most occurred within 1-2 years after major volcanic eruptions,” contrasting with the finding that the two decadal-scale warm periods both occurred during “gaps in volcanic activities.”
Perhaps the most significant observation made by the authors, however, is that “none of the extreme warm years [< 1.5σ] or decades occurred in the most recent 30 years,” which fact runs counter to anthropogenic global warming claims that temperatures of the past few decades have been the warmest of the past thousand years (…)
Iran’s deputy environment chief Karim Shafie has warned that Iran’s participation in the Paris Agreement is at risk if they don’t get their climate money.
by Tony Heller, May 22, 2018 in TheDeplorableClimateScienceBlog
Settled science at NASA means constantly rewriting the past. Here are a few of the NASA Reykjavik, Iceland temperature graphs I have captured over the past six years.
by Andrea Ayemoba, May 21, 2018 in AfricaBusinessCommunities
Shell Nigeria Gas (SNG) Limited has increased its domestic gas distribution capacity by 150% over the last six months. The increase in capacity will enable the company to distribute more than 100 million standard cubic feet of gas per day (MMscf/d) to businesses in its western operations.
There is a strong possibility that Poland will build a floating Liquefied Natural Gas (LNG) terminal in Gdańsk, according to Fred H. Hutchison, who says “a lot of gas” can come to Central European markets this way.
Fred H. Hutchison is president and CEO of LNG Allies, an industry association working to expedite and maximise US exports of liquefied natural gas (LNG). In Bratislava, Hutchinson gave a speech at the Energy Committee of the American Chamber of Commerce.
Imports of natural gas from Russia have increased over the years and represented 34% of EU’s supply in 2016 according to ACER. Given the cheap price of Russian gas, do you see a window of opportunity for Amercian LNG on the European market?
Al Gore wrote in the Huffington Post (August 28, 2014) that the need for “bold action” to curtail “old dirty sources of energy … is obvious and urgent.” The proper scientific response to an assertion like that is why? How can I test this idea? Science is not a belief, it is a method of testing ideas. We use an idea to make predictions and then we gather data to see if the predictions are correct. If the predictions are accurate, the idea survives. If any of the predictions fail, the idea is disproven, and it must be modified or simply rejected.
