We’re Not Gonna Drown! Analyses Show COASTAL SEA LEVEL RISE Is Only 1.69 mm Per Year!

by P. Gosselin, March 23, 2021 in NoTricksZone


UPDATE: Sea level rise near the coasts where people actually live is found to be 1.69 mm/yr. But when crunching the data for the entire ocean, as Willis Eschenbach has shown, a figure of just 1.52 mm/year is computed. 

Hot shot data analyst Zoe Phin at her site examines sea level rise.

There she notes, “Climate alarmists are worried that the sea level is rising too fast and flooding is coming soon. You can find many data images like this on the net:”

Sea Level and the Jersey Shore

by Kip  Hansen, March 22, 2021 in WUWT


Dr. Judith Curry has been writing about Sea Levels and New Jersey [and here], spurred on by a request for an evaluation of the topic from the New Jersey Business & Industry Association(NJBIA).  The NJBIA is concerned because a study by a team of sea level researchers at Rutgers University has called for “draconian policies unsupported by science” that would “harm our economy today” by overreacting to “legitimate concerns about climate change, sea level rise, and flooding”.   Dr. Curry’s full report is titled: “Assessment of projected sea level rise scenarios for the New Jersey Coast”.

Dr. Curry’s CFAN report contains this summary:

The summary conclusions of the CFAN Review are:

—  The sea level projections provided by the Rutgers Report are substantially higher than those provided by the IPCC, which is generally regarded as the authoritative source for policy making. The sea level rise projections provided in the Rutgers Report, if taken at face value, could lead to premature decisions related to coastal adaptation that are unnecessarily expensive and disruptive.

—  Scenarios out to 2050 for sea level rise and hurricane activity should account for scenarios of variability in multi-decadal ocean circulation patterns.

—  Best practices in adapting to sea level rise use a framework suitable for decision making under deep uncertainty. The general approach of Dynamic Adaptive Policy Pathways is recommended for sea level rise adaptation on the New Jersey coast.

I wrote a piece here at WUWT a year ago, titled “Atlantic City:   I’ll meet you tonite…..”, prompted by the Governor of New Jersey’s executive order stating that  “New Jersey has set a goal of producing 100 percent clean energy by 2050.” and  “New Jersey will become the first state to require that builders take into account the impact of climate change, including rising sea levels, in order to win government approval for projects.”  The sea level rise part of this executive order was based on an earlier draft of  the same  study by researchers at Rutgers University.

End of Snow? Finland Thinks Their Winter Snow Might Not Melt This Summer

by Eric Worall, March 22, 2021 in WUWT


Finland thinks that piles of snow accumulated from road clearing this year are so large, some of the snow will still be frozen when winter returns.

In Finnish capital region, snow piles built up this winter may not melt during summer

FINLAND  15 MARCH 2021

THE CAPITAL REGION of Finland has received so much snow this winter that the metres-high piles hauled to designated snow dump areas may not melt during the course of the summer, reports Helsingin Sanomat.

In Uusimaa, for example, the amount of snow was 1.7 times higher than last year in January, according to Foreca.

Helsingin Sanomat on Friday wrote that the piles of snow stand almost as high as 20 metres at the dump area in Herttoniemi, eastern Helsinki. In Maununneva, a north-western neighbourhood of the city, lorries have dumped roughly 16,000 loads of snow at the dump area, revealed Tero Koppinen, a production manager at Helsinki City Construction Services (Stara).

The snow ploughed from roads forms a large structure, nicknamed by the locals as the Alps, also at the only snow dump area in Espoo, in Vanttila.

Read more: https://www.helsinkitimes.fi/finland/finland-news/domestic/18867-snow-piles-built-up-this-winter-may-not-melt-during-summer-in-finnish-capital-region.html

The Fins mostly seem to be treating this as a joke, maybe a chance to cool off on warm Summer days. And most likely this event will have no long term consequences.

But history teaches that when ice ages strike, they can strike abruptly, with very little warning.

12,800 years ago, the world abruptly froze. Temperatures plunged back to ice age conditions, and stayed cold for over 1000 years.

CLIMATE CHANGE, COVID-19, AND THE GREAT RESET

by A. MacRae, March 2021 in Elecroverse


The below treatise was sent to Canadian and American politicians and the media – but most of them won’t understand it, because they have no scientific competence and have been utterly deceived – programmed for decades by false climate scares and green energy frauds.

SUMMARY

We published in 2002 that there was NO catastrophic human-made global warming /climate change crisis, and green energy schemes were NOT green and produced little useful (dispatchable) energy. Dangerous global warming and climate change have NOT HAPPENED and green energy schemes have proved to be COSTLY, UNRELIABLE AND INEFFECTIVE. Global warming is NOT a threat, but global cooling IS dangerous. In 2002 we predicted that global cooling would start circa 2020, based on low solar activity, and that prediction is increasingly supported by the evidence.

Politicians foolishly accepted very-scary global warming falsehoods and brewed the perfect storm, crippling our energy systems with costly and unreliable green energy schemes that utterly fail due to intermittency, at a time when we will need more reliable, dispatchable energy due to increased energy demand and imminent global cooling. The good people of Australia, Britain, Germany, California and Texas have all suffered and died due to green energy failures that were PREDICTABLE AND PREDICTED.

THE GREENS’ PREDICTIVE CLIMATE AND ENERGY RECORD IS THE WORST

Twice as much carbon flowing from land to ocean than previously thought

by Institute for Basic Science, March 18, 2021 in WUWT 


Every year 600-900 million tons of carbon flow through rivers to the ocean either as particles or in dissolved form. Researchers have known for a long time that this does not represent the total amount of carbon that gets transported from the land to the ocean. But the remaining contributors mostly from coastal ecosystems, such as carbon-rich mangrove forests, and from groundwater discharge into the ocean have been notoriously difficult to measure.

A new study published in the journal Global Biogeochemical Cycles and spearheaded by Dr. Eun Young Kwon, project leader at the IBS Center for Climate Physics South Korea provides new estimates of this elusive component of the global carbon cycle. The study makes use of the existence of two stable carbon isotopes, 12C and 13C, with the latter being slightly heavier, because it has one more neutron in its nucleus. The concentration ratio between these two carbon isotopes (referred to as ?13C) provides a means to track carbon through the different components of the carbon cycle, including the atmosphere, oceans, river systems and the biosphere. Knowing the typical ?13C value of land biosphere and for coastal vegetation, one can now track how this quantity gets diluted in the oceans. “The carbon isotope values act like an invisible dye that tells us something about the source where it came from and how much got released initially” says Dr. Kwon, lead author of the study.

False Alarm: IPCC Models Say A Warming Antarctica REDUCES Sea Levels -0.8 Of A Meter By 3000

by K. Richard, March 15, 2021 in NoTricksZone


The IPCC-endorsed anthropogenic global warming (AGW) paradigm finds a warming Antarctica results in more precipitation locked up as ice on the continent. This contributes to reducing sea levels: a -1.2 mm/year−1 mitigation of sea level rise over the next 80 years.

In the 4th IPCC report, Working Group 1 (the physical science) reported that as global temperatures rise,GCMs [models] indicate increasingly positive SMB for the Antarctic Ice Sheet as a whole because of greater accumulation.” This means that by 2100 Antarctica “would contribute 0.4 to 2.0 mm yr−1 of sea level fall.” Over the next 980 years, Antarctica’s ice accumulation will reduce sea levels by nearly a full meter (-0.8 m by 3000).

Clouds From Both Sides Now

by W. Eschenbach, March 15, 2021 in WUWT


Clouds are said to be the largest uncertainty in climate models, and I can believe that. Their representation in the models is highly parameterized, each model uses different parameters as well as different values for the same parameters, and so of course, different models give very different results. Or to quote from the IPCC, the Intergovernmental Panel on Climate Change:

In many climate models, details in the representation of clouds can substantially affect the model estimates of cloud feedback and climate sensitivity. Moreover, the spread of climate sensitivity estimates among current models arises primarily from inter-model differences in cloud feedbacks. Therefore, cloud feedbacks remain the largest source of uncertainty in climate sensitivity estimates.

The question of importance is this—if the earth heats up, will clouds exacerbate the warming or will they act to reduce the warming? The general claim from mainstream climate scientists and the IPCC is that the clouds will increase the warming, viz:

All global models continue to produce a near-zero to moderately strong positive net cloud feedback.

My own theory is that clouds and other emergent climate phenomena generally act to oppose any increases in surface temperature. So me, I’d expect the opposite of what the models show. I figured that there should be a negative cloud feedback that opposes the warming.

So I thought I’d take a look at answering the question using the CERES satellite dataset. As a prologue, here’s a short exposition about measuring the effect of clouds.

MAGMATIC MOVEMENTS REGISTERED UNDER FAGRADALSFJALL VOLCANO, ICELAND — 34,000 QUAKES IN TWO WEEKS, ERUPTION LIKELY

by Cap Allon, March 11, 2021 in Electroverse


A “seismic crisis” has been occurring in the area near Fagradalsfjall since late Feb 2021. This activity has been interpreted as intrusion of magma at shallow depths, which could lead to a new eruption.

Fadradalsfjall is a Pleistocene table mountain in the Reykjanes Peninsula, NE of Grindavik, Iceland.

Of today’s reawakening volcanoes, those located in Iceland are perhaps the most concerning.

It is this highly-volcanic region that will likely be home to the next “big one” (a repeat of the 536 AD eruption that took out the Roman Republic…?) — the one that will return Earth to another volcanic winter.

Volcanic eruptions are one of the key forcings driving Earth into its next bout of global cooling.

Volcanic ash (particulates) fired above 10km –and so into the stratosphere– shade sunlight and reduce terrestrial temperatures. The smaller particulates from an eruption can linger in the upper atmosphere for years, or even decades+ at a time.

Today’s worldwide volcanic uptick is thought to be tied to low solar activity, coronal holes, a waning magnetosphere, and the influx of Cosmic Rays penetrating silica-rich magma.

The COLD TIMES are returning, the mid-latitudes are REFREEZING in line with the great conjunction, historically low solar activitycloud-nucleating Cosmic Rays, and a meridional jet stream flow (among other forcings).

Both NOAA and NASA appear to agree, if you read between the lines, with NOAA saying we’re entering a ‘full-blown’ Grand Solar Minimum in the late-2020s, and NASA seeing this upcoming solar cycle (25) as “the weakest of the past 200 years”, with the agency correlating previous solar shutdowns to prolonged periods of global cooling here.

Furthermore, we can’t ignore the slew of new scientific papers stating the immense impact The Beaufort Gyre could have on the Gulf Stream, and therefore the climate overall.

Molecular and isotopic evidence reveals the end-Triassic carbon isotope excursion is not from massive exogenous light carbon

by C.P. Fox et al., Dec 1, 2020 in PNAS


Significance

The end-Triassic mass extinction that occurred ∼202 Ma is one of the “Big Five” biotic crises of the Phanerozoic Eon. It is also accompanied by an organic carbon isotopic excursion that has long been interpreted as the result of a global-scale carbon-cycle disruption. Rather than being due to massive inputs of exogenous light carbon into the ocean–atmosphere system, the isotopic excursion is shown here to reflect regional sea-level change that caused a transition from a marine ecosystem to a less saline, shallow-water, microbial-mat environment and resultant changes in the sources of organic matter. The mass extinction that occurred slightly later, caused by abrupt injection of volcanogenic CO2, is accompanied by only modest changes in organic carbon isotopic composition.

Abstract

The negative organic carbon isotope excursion (CIE) associated with the end-Triassic mass extinction (ETE) is conventionally interpreted as the result of a massive flux of isotopically light carbon from exogenous sources into the atmosphere (e.g., thermogenic methane and/or methane clathrate dissociation linked to the Central Atlantic Magmatic Province [CAMP]). Instead, we demonstrate that at its type locality in the Bristol Channel Basin (UK), the CIE was caused by a marine to nonmarine transition resulting from an abrupt relative sea level drop. Our biomarker and compound-specific carbon isotopic data show that the emergence of microbial mats, influenced by an influx of fresh to brackish water, provided isotopically light carbon to both organic and inorganic carbon pools in centimeter-scale water depths, leading to the negative CIE. Thus, the iconic CIE and the disappearance of marine biota at the type locality are the result of local environmental change and do not mark either the global extinction event or input of exogenous light carbon into the atmosphere. Instead, the main extinction phase occurs slightly later in marine strata, where it is coeval with terrestrial extinctions and ocean acidification driven by CAMP-induced increases in PCO2; these effects should not be conflated with the CIE. An abrupt sea-level fall observed in the Central European basins reflects the tectonic consequences of the initial CAMP emplacement, with broad implications for all extinction events related to large igneous provinces.

Michael Mann “Hockey Stick” Update: Now Definitively Established To Be Fraud

by F. Menton, Aug 26, 2021 in ManhattanContrarian


The Michael Mann “Hockey Stick” is suddenly back in the news. It’s been so long since we have heard from it, do you even remember what it is?

The “Hockey Stick” is the graph that took the world of climate science by storm back in 1998. That’s when Mann and co-authors Raymond Bradley and Malcolm Hughes published in Nature their seminal paper “Global-scale temperature patterns and climate forcing over the past six centuries.” A subsequent 1999 update by the same authors, also in Nature (“Northern Hemisphere Temperatures During the Past Millennium: Inferences, Uncertainties, and Limitations”) extended their reconstructions of “temperature patterns and climate forcing” back another 400 years to about the year 1000. The authors claimed (in the first paragraph of the 1998 article) to “take a new statistical approach to reconstructing global patterns of annual temperature . . . , based on the calibration of multiproxy data networks by the dominant patterns of temperature variability in the instrumental record.” The claimed “new statistical approach,” when applied to a group of temperature “proxies” that included tree ring samples and lake bed sediments, yielded a graph — quickly labeled the “Hockey Stick” — that was the perfect icon to sell global warming fear to the public. The graph showed world temperatures essentially flat or slightly declining for 900+ years (the shaft of the hockey stick), and then shooting up dramatically during the 20th century era of human carbon dioxide emissions (the blade of the stick).

Major February global temperature drop reveals the real climate control knob

by J. Bastardi, March 7, 2021 in CFACT


By now all of you know my belief ( bias) that it’s the oceans, and more so the tropical oceans, that are the biggest control knob of the weather and climate. If you really wanted to make this a controlled classroom experiment (nature is not a classroom with easy controls)  then I venture to say that the real way to know man’s influence is to have SST’s return to where they were in the 1970s, give it a couple of years for the water vapor adjustment, ( and if I am right. co2 will adjust as warmer oceans outsource it, so the outsourcing to the air will decrease) and see the difference there. And there you may be able to make an irrefutable argument for man’s contribution, Unfortunately for those who will not look at anything else,  that is likely to be quite small, but on the other hand, unlike the warming we have had which is really in the coldest driest places and more so at their coldest driest time of the year, you would likely find the lions share of what warming would be where life thrives.. As small as that has been, less than .25C of the numbers we see all the time that tell us that at. a bit over 59 degrees the planet is overheating, it is liable to be even less detectable and certainly as or more adaptable than what we seemed to have adapted to nicely here.

But the fear of course is runaway warming which is interesting since it counters Le Chateliers,  which I never hear anyone bring up, most likely because it’s a simple explanation. And a simple explanation would impact a lot of things relying on a done deal, complex explanation that the public must accept because they could never understand.

Danish Institute Data: Greenland Ice Melt Has Slowed Down Significantly Over Past Decade

by P. Gosselin, March 10, 2021 in NoTricksZone


The media and activists, among them a number of “Climate scientists”, have been declaring that Greenland ice melt has been accelerating.

Today the German Klimaschau climate news video reports, however, that this has not been the case over the recent years. All the recent talk about accelerating Greenland ice loss over the past years is false.

SMB on the rise

First a plot of Greenland’s surface mass balance SMB (blue curve below) shows that snow accumulation has occurred faster than snow and ice have melted over the past 35 years:

Chart: cropped from Klimaschau here

Though the annual SMB values declined from 1985 to 2012, the trend has rebounded since.

Loss through coastal discharge steady over the past 15 years

UAH Global Temperature Update for February 2021: +0.20 deg. C

by Roy Spencer, March. 3rd, 2021 in Global Warming


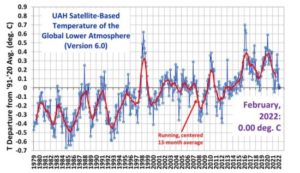
The Version 6.0 global average lower tropospheric temperature (LT) anomaly for February, 2021 was +0.20 deg. C, up from the January, 2021 value of +0.12 deg. C.

REMINDER: We have changed the 30-year averaging period from which we compute anomalies to 1991-2020, from the old period 1981-2010. This change does not affect the temperature trends.

The linear warming trend since January, 1979 remains at +0.14 C/decade (+0.12 C/decade over the global-averaged oceans, and +0.18 C/decade over global-averaged land).

Various regional LT departures from the 30-year (1991-2020) average for the last 14 months are:

California’s Energy Scorecard Fails On The World Stage – OpEd

by R. Stein, Sept 21, 2021 in EurasiaReview


California, with 0.5 percent of the world’s population (40 million vs 8 billion) professes to be the leader of everything and through its dysfunctional energy policies imports more electricity than any other state – currently at 32 percent from the Northwest and Southwest – and has forced California to be the only state in contiguous America thatimports most of its crude oil energy demands from foreign country suppliers to meet the energy demands of the state.

State energy policies have made California electricity and fuel prices among the highest in the nation which have been contributory to the rapid growth of “energy poverty” for the 18 million (45 percent of the 40 million Californians) that represent the Hispanic and African American populations of the state.

Access to electricity is now an afterthought in most parts of the world, so it may come as a surprise to learn that 16 percent of the world’s population — an estimated 1.2 billion people — are still living without this basic necessity. Lack of access to electricity, or “energy poverty”, is the ultimate economic hindrance as it prevents people from participating in the modern economy.

Almost half the world — over three billion people — live on less than $2.50 a day. At least 80 percent of humanity, or almost 6 billion, lives on less than $10 a day. Other nations and continents living in abject poverty without electricity realize California, and large parts of the U.S. buying into green new deals, renewable futures, and zero-carbon societies are left with the dystopic reality of mass homelessness, filth and rampant inequality that increasingly characterize the GND core values.

Shock News–China 5-Year Plan Will Increase Emissions

by P. Homewood, March 6, 2021 in NotaLotofPeopleKnowThat


China has set out an economic blueprint for the next five years that could lead to a strong rise in greenhouse gas emissions if further action is not taken to meet the country’s long-term goals.

The 14th five-year plan, published in Beijing on Friday, gave few details on how the world’s biggest emitter would meet its target of reaching net zero emissions by 2060, set out by President Xi Jinping last year, and of ensuring that carbon dioxide output peaks before 2030.

China will reduce its “emissions intensity” – the amount of CO2 produced per unit of GDP – by 18% over the period 2021 to 2025, but this target is in line with previous trends, and could lead to emissions continuing to increase by 1% a year or more. Non-fossil fuel energy is targeted to make up 20% of China’s energy mix, leaving plenty of room for further expansion of the country’s coal industry.

Swithin Lui, of the Climate Action Tracker and NewClimate Institute, said: “[This is] underwhelming and shows little sign of a concerted switch away from a future coal lock-in. There is little sign of the change needed [to meet net zero].”

Zhang Shuwei, chief economist at Draworld Environment Research Centre, said: “As the first five-year plan after China committed to reach carbon neutrality by 2060, the 14th five-year plan was expected to demonstrate strong climate ambition. However, the draft plan presented does not seem to meet the expectations. The international community expected China’s climate policy to ‘jump’, but in reality it is still crawling.”

Unusually, this five-year plan did not set out GDP targets for the whole five-year period, but allowed for annual targets, with the first for this year a target of 6% growth. The Centre for Research on Energy and Clean Air said that coupled with the emissions intensity target, this could allow the growth rate of China’s emissions to speed up even further, rather than slow down, as is needed.

https://www.theguardian.com/world/2021/mar/05/china-five-year-plan-emissions

From the non-sense of carbon neutrality

by Jeanne Marcq, March 5, 2021 in ScienceClimatEnergie


Carbon neutrality aiming to limit the rise in global temperature is a lure from the economic points of view and humanity. It is also the weakness of environmentalists, vegans and the “green” provided people of the northern hemisphere advocating worldly decay.

However, the food and energy resources exist in sufficiency  on earth but are poorly dispatched (see FAO data). Developing countries cannot be selfishly prevented from using fossil fuels to build their own economies instead of being plundered by new colonizers. No political regime has ever managed to erase socio-economic inequalities in society. With a world population currently growing until 2050 (FAO), any limitation of food production and economic development would be damaging to humanity.


Continuer la lecture de From the non-sense of carbon neutrality

Study: Medieval Climate Change Existed in Africa

by A. Watts, Feb 24, 2018 in WUWT


Mapping Medieval Climate Change in Africa:

Continental warming, coastal cooling and shifting rainbelts 1000 years ago

Global climate is currently undergoing major change. Experts agree that this change is driven by a combination of man-made and natural factors. However, full quantification of the anthropogenic and natural components is still a matter of debate. In order to better understand the contribution of natural climate variability and distinguish this from man-made influence, researchers worldwide have gone out to the field to study Earth’s pre-industrial climate history. Of particular interest are the past thousand years, which in Europe and North America have seen the transition from a rather warm medieval period to major cooling of the Little Ice Age, followed by the temperature rebound of the Current Warm Period which was further intensified by human greenhouse gas emissions. Our understanding of medieval climate outside this well-studied North Atlantic region is unfortunately still poor.

An international team led by geoscientist Sebastian Lüning wants to change this. Lüning is a professional resources geologist who in his sparetime works on paleoclimatological studies with the Switzerland-based Institute for Hydrography, Geoecology and Climate Sciences. Together with colleagues from Poland, Nigeria, Turkey and Germany they embarked on a journey through the scientific literature to shed light on the so-called ‘Medieval Climate Anomaly’, a period comprising of the years 1000-1200 AD. The initial focus region of their study was Africa. Lüning and his team crawled through hundreds of publications and mosaiced together a fascinating picture of African medieval climate change that tracks ancient heat waves, local cooling, drought and phases of amplified rainfall. Using modern database and visualization technology, the team managed to synthesize astonishing trends from the large amount of filtered data. Lüning explains the challenge:

….

No Mention Of CO2: New Study Shows African Climate Variability Strongly Linked To Natural Cycles

by C. Rotter, March 5, 2021 in WUWT


Africa climate variability linked to natural oceanic and solar cycles, a new study affirms. No mention of CO2. 

Understanding natural cycles the key to model projections

Sufficient rainfall is the basic condition for high-yield agriculture and food security for the population. Until recently, however, it was not possible to reliably predict rainfall several months in advance, which repeatedly led to unexpected crop failures. For some years now, however, progress has been emerging. The literature has repeatedly reported exciting correlations between temperature and air pressure patterns on the world’s oceans with rainfall and droughts in Africa and on other continents.

A group of researchers led by Horst-Joachim Lüdecke wanted to know more and meticulously searched for patterns in the monthly rainfall data of 49 African countries for the period 1901 to 2017 using statistical methods.

“Large number of robust correlations”

The scientists compared the rainfall fluctuations with five oceanic indices of natural origin that are firmly established in science, as well as with solar activity. The evaluation revealed a large number of robust correlations across the African continent with characteristic seasonal patterns. It has been known for some time that the Atlantic Ocean influences precipitation in Morocco and the Sahel via the so-called Atlantic Multidecadal Oscillation (AMO) and North Atlantic Oscillation (NAO). In East Africa, influences from the Indian and Pacific Oceans have been reported so far.

STATE OF THE POLAR BEAR REPORT 2020

by S. J. Crocfkord, Report 2020 in GWPF


Report 40, The Global Warming Policy Foundation

Preface v Executive summary vi

ISBN 978-1-9160700-7-3
© Copyright 2020, The Global Warming Policy Foundation

  1. Introduction 1
  2. Conservation status 1
  3. Population size 2
  4. Population trends 10
  5. Habitat status 11
  6. Prey base 15
  7. Health and survival 17
  8. Evidence of flexibility 22
  9. Human/bear interactions 23
  10. Discussion 28

Bibliography 30 About the Global Warming Policy Foundation

…Temperature Records…

by Donn Dears, March 2, 2021


There has been an unending stream of media reports about how the last few years have been the warmest on record.

They gloss over that they are only referring to the last 150 years, because temperatures have been higher than today on several occasions over the past 10,000 years, a period between glaciations know as the Holocene.

Recently, a presentation by Tony Heller caught my attention, in which he had facts, coupled with evidence, that shed light on the media’s hypocrisy. 

What follows uses some of the materials from Mr. Heller’s presentation, coupled with additional information. (Relevant links are itemized below.)

The first chart is Figure 3, from Dr. Roy Spencer’s evaluation of the heat island effect.

It shows that the urban heat island effect has skewed reported temperatures higher than where population density is low. Areas with low population density are representative of the vast majority of land surface areas.


Today’s temperatures are not the highest, or second highest, on record: Not for the past one-hundred-fifty years, or for the past 10,0000 years.

Links

Heller: https://bit.ly/2LrkLXf

Spencer:http://bit.ly/2N4fmpf

Real Climate Science:https://bit.ly/3cVlDhU

The first organism to use oxygen may have appeared surprisingly early

by R.F. Service, Feb 25, 2021 in ScienceAAAS


The first organisms to “breathe” oxygen—or at least use it—appeared 3.1 billion years ago, according to a new genetic analysis of dozens of families of microbes. The find is surprising because the Great Oxidation Event, which filled Earth’s atmosphere with the precious gas, didn’t occur until some 500 million years later.

“I was pretty thrilled to see this paper,” says Patrick Shih, an evolutionary biologist at the University of California (UC), Davis. The advent of proteins that can use oxygen, Shih and others say, marks a key step in the emergence of aerobic microbes, which are those able to harness oxygen. “The transition from a world that was mostly anaerobic to one that was mostly aerobic was one of the major innovations in life,” says Tim Lyons, a biogeochemist at UC Riverside.

Scientists broadly agree that Earth’s early atmosphere and oceans were all but devoid of oxygen gas. But there are signs that there was some oxygen around. Geochemists, for example, have found mineral deposits dated to about 3 billion years ago that they argue could only have formed in the presence of oxygen. And some evidence suggests cyanobacteria, the earliest photosynthetic organisms to release oxygen gas as a waste product—although not use it—may have arisen as early as 3.5 billion years ago.

“Acceleration” in Sea-Level Rise Found to Be False – An artifact of Switching Satellites

by P. Homewood, Feb 27, 2021 in NotaLotofPeopleKnwoThat


One of the most common arguments climate alarmists make is that rate of sea-level rise is “accelerating” or rising faster every year.

Sea-level data reported from satellites indicate seas are rising approximately of 3.3 mm/year (See Figure 1). By contrast, tidal stations have recorded a rise of approximately 1 to 2 mm annually, a rate which is little changed over the century or so for which we have adequate records. Indeed, as reported in Climate at a Glance: Sea Level Rise,  the oldest tide gauge in the USA, in New York City, shows no acceleration at all going back to 1850.

Why the large difference?

The answer it turns out is simple. When NASA and NOAA launched new satellites, the data they produced wasn’t the same as the data recorded by earlier satellites.

Figure 2. NOAA sea level data, showing the trend of each of the full individual satellite records and the overall trend. SOURCE: NOAA Excel Spreadsheet

Full post here.

The risks of communicating extreme climate forecasts

by COLLEGE OF ENGINEERING, CARNEGIE MELLON UNIVERSITY, Feb 24, 2021 in EurekaAlert!/AAAS


For decades, climate change researchers and activists have used dramatic forecasts to attempt to influence public perception of the problem and as a call to action on climate change. These forecasts have frequently been for events that might be called “apocalyptic,” because they predict cataclysmic events resulting from climate change.

In a new paper published in the International Journal of Global Warming, Carnegie Mellon University’s David Rode and Paul Fischbeck argue that making such forecasts can be counterproductive. “Truly apocalyptic forecasts can only ever be observed in their failure–that is the world did not end as predicted,” says Rode, adjunct research faculty with the Carnegie Mellon Electricity Industry Center, “and observing a string of repeated apocalyptic forecast failures can undermine the public’s trust in the underlying science.”

Rode and Fischbeck, professor of Social & Decision Sciences and Engineering & Public Policy, collected 79 predictions of climate-caused apocalypse going back to the first Earth Day in 1970. With the passage of time, many of these forecasts have since expired; the dates have come and gone uneventfully. In fact, 48 (61%) of the predictions have already expired as of the end of 2020.

Fischbeck noted, “from a forecasting perspective, the ‘problem’ is not only that all of the expired forecasts were wrong, but also that so many of them never admitted to any uncertainty about the date. About 43% of the forecasts in our dataset made no mention of uncertainty.”

Not a myth: State of the Polar Bear Report shows 2020 was another good year for polar bears

by C. Rotter Feb 27, 2021 in WUWT


The ‘State of the Polar Bear Report 2020’ is now available. Forget hand-wringing about what might happen fifty years from now – celebrate the fabulous news that polar bears had yet another good year.

Press release from the Global Warming Policy Forum


Cite as:

Crockford, S.J. 2021. The State of the Polar Bear Report 2020. Global Warming Policy Foundation Report 48, London.

London, 27 February: A prominent Canadian zoologist says that Facebook’s information is gravely out of date and 2020 was another good year for polar bears.

In the State of the Polar Bear Report 2020, published by the Global Warming Policy Foundation (GWPF) on International Polar Bear Day, zoologist Dr. Susan Crockford explains that while the climate change narrative insists that polar bear populations are declining due to reduced sea ice, the scientific literature doesn’t support such a conclusion.

Crockford clarifies that the IUCN’s 2015 Red List assessment for polar bears, which Facebook uses as an authority for ‘fact checking’, is seriously out of date. New and compelling evidence shows bears that in regions with profound summer ice loss are doing well.

Included in that evidence are survey results for 8 of the 19 polar bear subpopulations, only two of which showed insignificant declines after very modest ice loss. The rest were either stable or increasing, and some despite major reductions in sea ice. As a result, the global population size is now almost 30,000 – up from about 26,000 in 2015.

Dr. Crockford points out that in 2020, even though summer sea ice declined to the second lowest levels since 1979, there were no reports of widespread starvation of bears, acts of cannibalism, or drowning deaths that might suggest bears were having trouble surviving the ice-free season.

La géologie, une science plus que passionnante … et diverse