“I have met allies who can report that Russia, as part of their sophisticated information and disinformation operations, engaged actively with so-called non-governmental organisations – environmental organisations working against shale gas – to maintain European dependence on imported Russian gas.” — NATO’s then Secretary General Anders Fogh Rasmussen, The Guardian, June 19, 2014.
The mechanism, which can be summarized as follows: “Funds from the Russian government -> Shell company ‘incorporated’ in Bermuda -> American foundation -> American environmental organizations.” The advantage of Bermuda is that it does not require any disclosure that funds come from a foreign government, contrary to American law. Sea Change must disclose that it has received funds from abroad — in this instance a Bermuda company. Nothing more.
On March 11, 2022, US Representatives Jim Banks and Bill Johnson sent a letter to Treasury Secretary Janet Yellen, asking for an investigation into the reported Russian manipulation of American “green groups” that are seemingly funded with “dark money” (anonymous donations). “Russia spent millions promoting anti-energy policies and politicians in the U.S. … Unlike the Russia hoax, Putin’s malign influence on our energy sector is real and deserves further investigation,” Banks said to Fox News Digital.
Below Europe’s soil lie large reserves of shale gas, also known as bedrock gas. The exploitation of these European natural gas reserves would have substantially reduced Europe’s purchases of, and dependence on, Russia’s gas — in particular on its gas giant, Gazprom. The same is true of nuclear power, which offers Westerners an abundant, non-CO2-emitting energy source as an alternative to Russian gas.
Hence the interest, for the Russian government, in mounting a vast disinformation campaign against shale gas and nuclear power in the West, by massively financing the groups most likely “naturally” to oppose it: environmentalist organizations.
A general view shows the headquarters of the Russian natural gas monopoly giant Gazprom building in Moscow on January 7, 2009. All deliveries of Russian gas through Ukraine were halted on January 7, intensifying a bitter dispute between Moscow and Kiev, which risks depriving Europeans of gas amid freezing weather. In a new twist, Russian Prime Minister Vladimir Putin told state-run energy giant Gazprom on January 7 to cease all deliveries of natural gas into Ukraine. AFP PHOTO / YURI KADOBNOV (Photo by Yuri KADOBNOV / AFP) (Photo by YURI KADOBNOV/AFP via Getty Images)
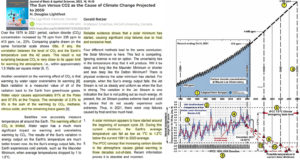
“The IPCC concept that increasing carbon dioxide in the atmosphere causes global warming is three decades out-of-date.” − Lightfoot and Ratzer (2022), Journal of Basic & Applied Sciences
In analyzing UAH global temperature and Mauna Loa CO2 records from 1979 to 2021, climate researchers Lightfoot and Ratzer (2022) report there has been “little, if any” correlation between these two variables during this period.
They assert that between 91 and 98% of Earth’s greenhouse gas effect is from water vapor, as CO2 and other trace gases contribute less than 5% to greenhouse gas forcing.
A solar minimum has just began in the current solar cycle 25. The declining solar output is projected to eventually lead to a ~1 to 1.2°C cooling over the next 30 to 40 years. Solar minimum periods are also accompanied by crop failures due to frost and weather extremes delivering excessive heat.
The authors conclude by suggesting the popularized conceptualization of CO2 as a driver of global warming has proven to be “obsolete and incorrect”.
by. P. Homewood, Mar 13, 2022 in NotaLotofPeopleKnowThat
This single chart from the US EIA explains just why oil prices are shooting up there:
https://www.eia.gov/petroleum/production/
…
The oil boom initiated by Trump saw crude oil output increase by a half between 2016 and 2019.
Output naturally collapsed in early 2020 as a result of the pandemic, which affected both supply and demand. But since then output has only slowly recovered, and is still 9% below 2019 levels.
It is worth pointing out that demand in 2021 was still not back to 2019 levels. Assuming it recovers this year, it is likely to put further upward pressure on prices, unless production increases as well.
To put the numbers into perspective, the US produces a sixth of the world’s crude oil. The increase US output between 2016 and 2019 was 205 million tonnes, and represents 5% of global output.
Small changes in supply have a disproportionate effect on international oil prices, because demand is so inelastic. An extra 5% on world production would have a significant impact on prices.
A rational look at the data and physics tell us there are no real signs that tornadoes are going to get more frequent and worse.
German Die kalte Sonne’s 2nd part of its most recent video looks at tornadoes, a ferocious and extremely destructive meteorological phenomenon that global warming alarmists claim will only get worse and worse. They want6 you to panic over it.
But Die kalte Sonne’s video report notes that a number of sources say that trend has yet to materialize. Many statistics in fact have shown the opposite is happening:
…
Ideal conditions for tornado formation could weaken
The ideal conditions that lead to the formation of tornadoes are lower warm moist air clashing with cold dry air moving above. The conditions are common in the springtime, when warm, humid air from southern USA clashes with a cold air mass blasting in from the north. Yet, should the these cold masses of air warm up, then this would lead to a smaller temperature gradient and thus be less favorable for tornadoes to form.
by P. Homewood, March 12, 2022 in NotaLotofPeopleKnowThat
As usual, he makes the amount of rainfall sound impossibly high by relating it to annual rainfall.
In fact, it is not uncommon to see more than 1000mm of rainfall in the first three months of the year in Brisbane. Indeed the record for January to March was set in 1974 when 1433mm fell.
Ice cores allow climate researchers to look 800,000 years back in time: atmospheric carbon acts as fertilizer, increasing biological production. The mechanism removes carbon from the air and thereby dampens the acceleration in global warming.
Even under ice age conditions will plants, plankton, and other life forms be able to increase production whenever atmospheric carbon concentrations rise. The mechanism will not prevent an ongoing trend of global warming, but at least dampen the acceleration. This conclusion stems from an international collaboration involving the Physics of Ice Climate Earth (PICE) center of Niels Bohr Institute, University of Copenhagen.
“Global biosphere production through photosynthesis is the strongest absorbing flux of atmospheric carbon dioxide. It is therefore essential to understand its natural variability for a better projection of the future carbon cycle,” says Postdoc researcher Ji-Woong Yang, PICE, continuing:
“Nowadays, as we have Earth observation satellites and other advanced equipment, the mechanism of carbon fertilization is well established. However, we were not sure that the same mechanism existed in past periods where the climate was very different and atmospheric carbon concentrations much lower. The new results confirm the existence of the strong correlation and allow us to model future developments with more confidence.”
Eight glacial cycles are covered
In collaboration with Laboratoire des Science du Climat et de l’Environnement, France, the PICE team has studied the ancient air trapped inside tiny air bubbles in an Antarctic ice core. The ice core represents the last 800,000 years of climatic development.
The scientists take advantage of the fact that the oxygen atom does not only exist in the most common form 16O with 8 protons and 8 neutrons but also as the isotopes 17O and 18O. The isotopic composition is a tracer for biosphere productivity. Uniquely, the method will show the global level of biological production in contrast to other methods which give more localized results.
Combining the air bubble measurements with modeling of oxygen behavior in both the biosphere and the stratosphere, the researchers were able to quantify the biosphere productivity evolution under both glacial periods (ice ages) and interglacial periods. In total, eight glacial cycles were covered.
“The results clearly demonstrate that productivity drops during glacial periods and increases during interglacial periods. Further, a strong correlation exists with past atmospheric carbon dioxide concentrations measured from multiple ice cores. In addition, the effect is more prominent during glacial periods where the level of carbon dioxide and the global biosphere productivity start to increase several thousand years before the ice caps begin to melt. This correlation is explained by the strong fertilization effect by atmospheric carbon dioxide,” says Ji-Woong Yang.
“No climate crisis” is, of course, not the spin the Intergovernmental Panel on Climate Change (IPCC) is putting on its new 3,676-page report released last month. “The choices we make in the next decade will determine our future,” the IPCC says. “Any further delay in concerted global action will miss a brief and rapidly closing window to secure a liveable future.”
It could hardly be plainer. The report is political advocacy barely masquerading as science.
The IPCC Working Group II report is not meant to be about policy; that’s the job of Working Group III, which has yet to produce its contribution to the sixth assessment report. “The focus of our new report is on solutions,” the IPCC says of the Working Group II report. “It highlights the importance of fundamental changes in society.” The solution to climate change, the IPCC claims, is renewable energy, circular economies, healthy diets, universal health coverage and social protection. The only surprise is that the IPCC didn’t include abolishing the Second Amendment in its climate catechism.
“Scientific evidence shows that addressing the risks and impacts of climate change successfully involves a more a diverse set of actors than previously thought” and involvespartnerships with “traditionally marginalized groups, including women, youth, Indigenous Peoples, local communities and ethnic minorities (high confidence).” How on earth did the IPCC exclude the LBGTQ+ community? “Different interests, values and worldviews can be reconciled if everyone works together,” the IPCC says. This isn’t science. It’s climate kumbaya.
Small islands were the poster child of net zero as they claimed they risked sinking beneath the waves thanks to rising sea levels. They successfully lobbied for the adoption of the target in the Paris climate agreement to limit the increase in global temperature to 1.5 degrees Celsius above pre-industrial levels. The IPCC therefore includes them in a list of global hotspots of high human vulnerability, asserting that their vulnerability will increase in the context of sea level rise. Yet only four years ago, the IPCC in its 1.5 degree Celsius special report stated that “observations, models and other evidence” indicate that unconstrained Pacific atolls have kept pace with sea level rises and that there had been “little reduction in size or net gain in land.”
In a blog post, Roger Pielke Jr. of the department of environmental studies at the University of Colorado Boulder notes that the IPCC lifts projections of future climate damages from studies that eliminate the choice of adapting to climate change, a practice Pielke calls “misleading at best.” Yet buried in the report is a study showing that adequate flood protection, i.e. adaptation, could avoid 95 percent of projected flood damages.
Scientists are turning to a combination of data collected from the air, land, and space to get a more complete picture of how climate change is affecting the planet’s frozen regions.
Trapped within Earth’s permafrost – ground that remains frozen for a minimum of two years – are untold quantities of greenhouse gases, microbes, and chemicals, including the now-banned pesticide DDT. As the planet warms, permafrost is thawing at an increasing rate, and scientists face a host of uncertainties when trying to determine the potential effects of the thaw.
A paper published earlier this year in the journal Nature Reviews Earth & Environment looked at the current state of permafrost research. Along with highlighting conclusions about permafrost thaw, the paper focuses on how researchers are seeking to address the questions surrounding it.
Infrastructure is already affected: Thawing permafrost has led to giant sinkholes, slumping telephone poles, damaged roads and runways, and toppled trees. More difficult to see is what has been trapped in permafrost’s mix of soil, ice, and dead organic matter. Research has looked at how chemicals like DDT and microbes – some of which have been frozen for thousands, if not millions, of years – could be released from thawing permafrost.
Then there is thawing permafrost’s effect on the planet’s carbon: Arctic permafrost alone holds an estimated 1,700 billion metric tons of carbon, including methane and carbon dioxide. That’s roughly 51 times the amount of carbon the world released as fossil fuel emissions in 2019. Plant matter frozen in permafrost doesn’t decay, but when permafrost thaws, microbes within the dead plant material start to break the matter down, releasing carbon into the atmosphere.
Regional consumption activities supported by domestic production and international trade have led to substantial aerosol-related emissions worldwide. Here we quantify sulfur dioxide emissions associated with consumption by developed and developing countries and assess the resulting climate impacts using an Earth system model. We find that although the consumption-associated emissions of developed countries are 40% less than those of developing countries, they lead to similar impacts on global mean surface air temperature and precipitation. This is because the effective radiative forcing induced per emission is greater for developed countries, which we attribute to the emissions being located at higher northern latitudes and being more evenly distributed zonally. Emissions from developing countries have a greater impact on temperature and precipitation over the tropical monsoon regions of China and India. Our results demonstrate the importance of trade and emission region in determining how consumption translates into global climate impact.
by P. Homewood, Mar 9, 2022 in NotaLotofPeopleKnowThat
Energy-related CO2 emissions grew to 36.3 Gt in 2021, a record high
Global CO2 emissions from energy combustion and industrial processes1 rebounded in 2021 to reach their highest ever annual level. A 6% increase from 2020 pushed emissions to 36.3 gigatonnes (Gt), an estimate based on the IEA’s detailed region-by-region and fuel-by-fuel analysis, drawing on the latest official national data and publicly available energy, economic and weather data.
The Covid-19 pandemic had far-reaching impacts on energy demand in 2020, reducing global CO2emissions by 5.2%. However, the world has experienced an extremely rapid economic recovery since then, driven by unprecedented fiscal and monetary stimulus and a fast – although uneven – roll-out of vaccines. The recovery of energy demand in 2021 was compounded by adverse weather and energy market conditions, which led to more coal being burnt despite renewable power generation registering its largest ever annual growth.
Emissions increased by almost 2.1 Gt from 2020 levels. This puts 2021 above 2010 as the largest ever year-on-year increase in energy-related CO2 emissions in absolute terms. The rebound in 2021 more than reversed the pandemic-induced decline in emissions of 1.9 Gt experienced in 2020. CO2 emissions in 2021 rose to around 180 megatonnes (Mt) above the pre-pandemic level of 2019.
The 6% increase in CO2 emissions in 2021 was in line with the jump in global economic output of 5.9%. This marks the strongest coupling of CO2 emissions with Gross domestic product (GDP) growth since 2010, when global emissions rebounded by 6.1% while economic output grew by 5.1% as the world emerged from the Global Financial Crisis.
IMAGE: LEAD AUTHOR SINJINI SINHA, A GRADUATE STUDENT AT THE UNIVERSITY OF TEXAS AT AUSTIN’S JACKSON SCHOOL OF GEOSCIENCES, EXAMINES IMAGES OF FOSSIL SPECIMENS IN THE SCANNING ELECTRON MICROSCOPE LAB. SINHA USED THE MICROSCOPE TO EXAMINE EXCEPTIONALLY PRESERVED FOSSILS AND LEARN MORE ABOUT THE FOSSILIZATION PROCESS.view more
CREDIT: THE UNIVERSITY OF TEXAS AT AUSTIN/JACKSON SCHOOL OF GEOSCIENCES.
Climate change can affect life on Earth. According to new research, it can also affect the dead.
A study of exceptionally preserved fossils led by a graduate student at The University of Texas at Austin has found that rising global temperatures and a rapidly changing climate 183 million years ago may have created fossilization conditions in the world’s oceans that helped preserve the soft and delicate bodies of deceased marine animals.
The fossils include squid-like vampyropods with ink sacs, ornate crustacean claws and fish with intact gills and eye tissue.
Despite being from different locations and marine environments, the fossils were all preserved in a similar manner. Geochemical analysis revealed that the conditions needed to preserve such captivating fossils could be connected to Earth’s climate.
“When I started the research, I had no idea if they would preserve the same way or a different way,” said lead author Sinjini Sinha, a graduate student at the UT Jackson School of Geosciences. “I was curious what led to the exceptional preservation.”
Baltic Sea surface temperatures may have reached 24°C 7,200 years ago compared to the current 12.7°C.
A new study (Weiss et al., 2022) indicates Baltic Sea regional surface temperatures ranged between 21-24°C from ~5.7 to 7.7 ka (thousand years ago). This period is referred to as the Baltic’s Holocene Thermal Maximum.
Temperatures dipped to 17.2°C at 1.373 ka. (The time span ranging from 0.0 ka to 3 ka is referred to in the study as the Modern Baltic, or M.B.)
The current (0.0 ka) surface temperature for the Baltic S is 12.7°C. This temperature is more than 11°C colder than the Baltic’s temperatures at 7.2 ka.
To hype up climate warming alarm, IPCC scientists like to exaggerate CO2’s power to trap heat and warm up the atmosphere. But with every assessment report that the IPCC issues, the estimated value by which CO2 warms the planet steadily gets reduced as the observed warming keeps lagging behind what earlier models predicted.
In his paper, Frank Stefani and his team at the Helmholtz Center, Institute of Fluid Dynamics in Dresden, Germany looked at the impacts by CO2 and solar activity.
On average 1.1°C warming
Using double regression, the scientists evaluated linear combinations of the logarithm of the carbon dioxide concentration and the geomagnetic aa index as a proxy for solar activity. They reproduced the sea surface temperature (HadSST) since the middle of the 19th and ended up with a a climate sensitivity (of TCR type) in the range of 0.6 K until 1.6 K per doubling of CO2. The midpoint of this range is 1.1°C, a value many critical climate scientists have already estimated earlier, and thus far below the IPCC scary estimates.
The devastating Russian invasion of Ukraine has captured global attention. While the world’s focus is rightly on the human toll and suffering, the crisis has highlighted the need to end reliance on Russian oil and gas. [bold, links added]
Every single day, the world spends more than a billion dollarson fossil fuels from Russia, according to Bloomberg reporting.
As Ukrainian Foreign Affairs Minister Dmytro Kuleba tweeted, that money is now paying for the “murder of Ukrainian men, women, and children.” We must end this reliance.
However, this has proved to be easier said than done: Over dozens of years, the world has exchanged trillions of dollars for fossil fuels from the Soviet Union and now from Russia. Our continued use of Kremlin-backed oil and gas reveals two inconvenient truths.
First, reliable energy maintains the foundation of modern society and few are willing to give up its benefits. Access to cheap, abundant, and dependable energy has been the cornerstone of the industrial revolution and humanity’s achievements.
In 2021 the ABC provided historical records showing a rapid series of floods is not unusual for Brisbane. In 2022, major flooding events in quick succession is proof the carbon demon walks among us.
One major avenue for policymakers to meet climate targets is by decarbonizing the power sector, one component of which is raising the share of renewable energy sources (renewables) in electricity generation.
However, promoting renewables –in liberalized power markets– creates a paradox in that successful penetration of renewables could fall victim to its own success. With the current market architecture, future deployment of renewable energy will necessarily be more costly and less scalable. Moreover, transition towards a full 100% renewable electricity sector is unattainable. Paradoxically, in order for renewable technologies to continue growing their market share, they need to co-exist with fossil fuel technologies. Ignoring these findings can slow adoption and increase the costs of deploying new renewable technologies.
This paper spots the incompatibility between electricity liberalization and renewable policy, regardless of the country, location or renewable technologies. The Paradox holds as long as market clear prices with short term marginal costs, and renewable technology’s marginal cost is close to zero and not dispatchable.
How has Vladimir Putin—a man ruling a country with an economy smaller than that of Texas, with an average life expectancy 10 years lower than that of France—managed to launch an unprovoked full-scale assault on Ukraine?
There is a deep psychological, political and almost civilizational answer to that question: He wants Ukraine to be part of Russia more than the West wants it to be free. He is willing to risk tremendous loss of life and treasure to get it. There are serious limits to how much the U.S. and Europe are willing to do militarily. And Putin knows it.
Missing from that explanation, though, is a story about material reality and basic economics—two things that Putin seems to understand far better than his counterparts in the free world and especially in Europe.
Putin knows that Europe produces 3.6 million barrels of oil a day but uses 15 million barrels of oil a day. Putin knows that Europe produces 230 billion cubic meters of natural gas a year but uses 560 billion cubic meters. He knows that Europe uses 950 million tons of coal a year but produces half that.
The former KGB agent knows Russia produces 11 million barrels of oil per day but only uses 3.4 million. He knows Russia now produces over 700 billion cubic meters of gas a year but only uses around 400 billion. Russia mines 800 million tons of coal each year but uses 300.
That’s how Russia ends up supplying about 20 percent of Europe’s oil, 40 percent of its gas, and 20 percent of its coal.
The math is simple. A child could do it.
The reason Europe didn’t have a muscular deterrent threat to prevent Russian aggression—and in fact prevented the U.S. from getting allies to do more—is that it needs Putin’s oil and gas.
The February and winter 2021/22, untampered JMA mean temperature data are in for Tokyo and its Hachijojima island
Tokyo
Here’s the latest plot of February mean temperatures for Tokyo, since 1987
…
Over the past 34 years, February mean temperatures in Tokyo have been steady, i.e. no warming. After the past 2 Februarys came in rather balmy, this most recent February has been the coldest since 1988!
Hachijojima
Moving away from the urban Tokyo and over to the city’s rural Pacific island of Hachijojima, some 275 km off the Japan mainland, we plot the latest February data going back to 1987
…
Here as well there’s been no warming in February since 1987. In contradiction to the predictions of warming, the island has in fact cooled off bit, according to the data from the Japan Meteorological Agency (JMA).
The past February has been among the coolest since 1987.
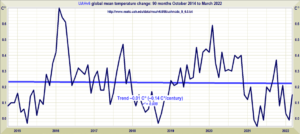
The drop from 0.03 K to 0.00 K from January to February 2022 in the UAH satellite monthly global mean lower-troposphere dataset has proven enough to lengthen the New Pause to 7 years 5 months, not that you will see this interesting fact anywhere in the Marxstream media
Another week and we get another dire report on the climate from the U.N. and again, there is no scientific data showing a direct link between oil use and temperatures, sea levels, and storm activity. [bold, links added]
Life in some locations on the planet is rapidly reaching the point where it will be too hot for the species that live there to survive, international climate experts said in a report Monday.
“With climate change, some parts of the planet will become uninhabitable,” said German scientist Hans-Otto Pörtner, co-chair of Working Group II for the Intergovernmental Panel on Climate Change (IPCC), which produced the report released in Berlin.
The report assesses scientific literature documenting the devastating effects of human-caused climate change on society and ecosystems worldwide.
And, as always, the media just reports these dire reports without asking any questions or doing any research. Five simple questions would be:
Why should we believe these predictions and base policies on these predictions when previous predictionshave been completely wrong?
Shouldn’t policies be based on actual scientific data instead of computer models that can easily be manipulated to get the results you want?
Should we destroy an industry based on computer models, especially one that has greatly improved the quality and length of life?
Has the UN ever accomplished anything that indicates it can control the climate?
One prediction we continuously see to scare the public, especially the children, into compliance, is how many species of fossil fuels and humans are causing them to go extinct.
What we never see is actual data from the previous 150 years of fossil-fuel use that have gone extinct.
by Roy Spencer, Mar 2, 2022 in ClimateChangeDispatch
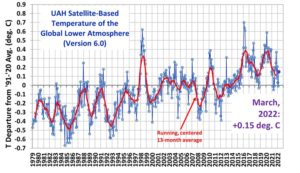
The Version 6.0 global average lower tropospheric temperature (LT) anomaly for February 2022 was 0.00 deg. C, down a little from the January 2022 value of +0.03 deg. C.
The linear warming trend since January 1979 still stands at +0.13 C/decade (+0.12 C/decade over the global-averaged oceans, and +0.18 C/decade over global-averaged land).
An initial thread on the IPCC AR6 WG2 report released today
Whereas WG1 received a mixed review in my areas of expertise (specifically: poor on scenarios, solid on extremes), my initial reaction to the WG2 report is that it is an exceedingly poor assessment
The first observation is that the report is more heavily weighted to implausible scenarios than any previous IPCC assessment report
In particular, RCP8.5 represents ~57% of scenario mentions
This alone accounts for the apocalyptic tone and conclusions throughout the report.
The IPCC has rushed out a new portion of the IPCC WGII Sixth Assessment Report: Climate Change 2022: Impacts, Adaptation and Vulnerability. The report itself and all of its summaries and chapters are available from the IPCC web site. I say rushed out because when I downloaded Chapter 15: Small Islandsat 5:00 pm EST on February 28th, the copy I received was still marked “Accepted Version Subject to Final Edits” and “Do Not Cite, Quote or Distribute”.
They are quite right to mark it “Do Not Cite, Quote or Distribute” — I would have suggested expanding that to “Do Not Cite, Quote, Distribute, or Read”. But, that would be a personal opinion. I am afraid I failed to follow my own best advice and have made the mistake of reading Chapter 15: Small Islands. So, having failed to “not read” I will follow up by failing to not cite, quote or distribute potions in this Opinion essay.
What exactly is the decline effect? Is it the fact that certain scientifically discovered effects decline over time the more they are studied and researched? Almost, but not really. The Wiki has this definition for us:
“The decline effect may occur when scientific claims receive decreasing support over time. The term was first described by parapsychologist Joseph Banks Rhine in the 1930s to describe the disappearing of extrasensory perception (ESP) of psychic experiments conducted by Rhine over the course of study or time. In its more general term, Cronbach, in his review article of science “Beyond the two disciplines of scientific psychology” [ also .pdf here ] referred to the phenomenon as “generalizations decay.”[1] The term was once again used in a 2010 article by Jonah Lehrer published in The New Yorker.”
Some hold that the decline effect is not just a decrease of support over time but rather that it refers to a decrease in effect size over time – or, according to some, both because of one or the other. That is, the support decreases because the effect sizes found decrease, or, because of decreasing support, reported effect sizes decrease. The oft cited cause of the decline effect are: publication bias, citation bias, methodological bias, and investigator effects. Part 1 of this series was an example of investigator effects.
Let’s be perfectly clear: In no case does the decline effect refer to an actual decline in real world effects of some physical phenomena, but only to effect sizes found and/or reported in research reports over time.