by P. Gosselin, June 11, 2019 in NoTricksZone
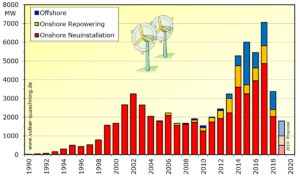
Despite all the talk about the need to transition over to green energies, Germany’s progress — in especially wind energy — has ground to a complete halt.
German news site iwr.de here reports that the expansion of wind energy in Germany has “come the a stop” as the government has scaled back subsidies and enacted stricter permitting laws.
“As in April 2019, only nine new wind turbines went into operation nationwide in May,” IWR reported. “The year 2019 threatens to be a disaster for the wind industry in Germany.”
The IWR reported further: “In the first five months of 2019, only around 60 new onshore wind turbines went into operation nationwide. This is the result of an IWR evaluation of data from the market master data register of the Federal Network Agency (BNetzA).”
“A catastrophe” for wind power
At Twitter green energy activist Prof. Volker Quaschning called the collapse a “catastrophe”, tweeting that the expansion of wind power “collapsed completely”. He added that “it will be impossible to meet the CO2 reduction targets” and that 40,000 jobs in the wind industry are “on the brink”.
…