Data Show Canadian Wildfires At Lowest Level In Decades

by A. Watts, Sep 29, 2020 in WUWT


Here’s something surprising from Paul Homewood, Not A Lot Of People Know That. While USA wildfires are running higher the last couple of years, according to Canada’s National Forestry Database, the number of forest fires in Canada has been at the lowest since 1990. Of course, Canada takes a management approach to forests compared to the USA’s “let it be or litigation” mess.

Source: http://nfdp.ccfm.org/en/data/fires.php

According to the Met Office, global warming is leading to record breaking fires in North America.

Canada, of course, is a large part of North America, so surely fires should be getting worse there too.

In fact wildfires this year are running at just 8% of the 10-year average:


Study: Global Warming Hiatus (aka “The Pause”) Was Real

by A. Watts, Sep 28, 2020 in WUWT


From the GWPF and the better late than never department: (the paper was published in late 2019 but seems pretty solid, using Oxygen18 isotope analysis) – Anthony

A new analysis of global air temperature by researchers from Tongji University in Shanghai has cast light on the much debated recent hiatus in global temperature.

Writing in the Journal of Earth Science the Chinese scientists say there was a rapid rise in global mean surface air temperature after the late 1970s but that this stalled and there was a relative stagnation and even slight cooling that lasted for about 15 years (1998–2012). They add that even though the slowdown was acknowledged by the Intergovernmental Panel on Climate Change Fifth Assessment Report (IPCC AR5) and termed as a hiatus (IPCC, 2013) there was a debate in the scientific community about whether there was a hiatus in global warming or not.

The researchers believe that the debate about the global warming hiatus poses a substantial challenge to our understanding of the global climate response to anthropogenic greenhouse gas emissions and natural variability. They say that the disagreements about the recent global warming hiatus mainly arise from different sources, among which differences across observational SAT datasets may be a key contributor to the contradictory conclusions. So they use an alternative set of data.

They use the ratio of two oxygen isotopes in precipitation, oxygen 16 and 18, which is a proxy for the temperature of precipitation and surface temperature. They are particularly interested in what they term a “robust correlation” between precipitation oxygen ratios and surface temperature over mid- and high-latitude regions. Twelve stations were selected of which ten are located in Europe, and the remaining two in Antarctica and North America, respectively. Using the data they constructed a composite isotope index spanning 1970–2016 by combining twelve precipitation oxygen isotope records collected over mid and high-latitude continents. With it they evaluate the recent global warming hiatus.

Continuer la lecture de Study: Global Warming Hiatus (aka “The Pause”) Was Real

OUT-OF-SEASON SNOW BLANKETS BOTH HEMISPHERES

by Cap Allon, Sep 29, 2020 in Electroverse


A merdional (wavy) jet stream flow is diverting brutal polar air to the mid-latitudes in BOTH hemispheres. Every continent on the planet is currently receiving out-of-season snow and anomalous cold, with a few of the worst hit nations being New Zealand, Australia, the United States, and France.


NEW ZEALAND

A spring weather bomb has battered New Zealand, closing roads, dumping snow on beaches and causing dozens of flight cancellations.

The NZ Met service has described the low-pressure system moving up the country from Antarctica as “very unusual in how widespread and severe the weather is” — they have called it a significant weather event.

The National Institute for Water and Atmospheric Research said parts of the South Island shivered through record-breaking lows of -20C (-4F) on Monday and Tuesday.

Flights were cancelled up and down the South Island due to heavy snow.

Disruptive flurries were even reported a sea-level: very unusual for spring:

11 SCIENTIFIC PREDICTIONS FOR THE UPCOMING GRAND SOLAR MINIMUM

by Cap Allon, Sep 18, 2020 in Electroverse


 There is ever-mounting evidence warning the next epoch will be one of sharp terrestrial cooling due to a relative flat-lining of solar output.

The exact time-frame and depth of this next chill of solar minimum is still anyone’s guess, and the parameters involved (i.e., galactic cosmic rays, geomagnetic activity, solar wind flux etc.) remain poorly understood. However, there are some great minds on the job, and below I’ve collated 11 best-guesses based on published scientific papers from respected researchers in the field. The list begins with eminent Russian astrophysicist K. Abdussamatov–though it is in no particular order.

BEACHED PILOT WHALES ARE A SIGN OF THE MAGNETIC POLE SHIFT AND WANING MAGNETOSPHERE

by Cap Allon, Sep 26, 2020 in Electroverse


Since 1850 Earth’s magnetic field has been weakening. At the turn of the millennium it then began reducing exponentially, at more than 10% per decade — this drop off is extreme and concerning, and here’s why.

Earth’s magnetic field protects us from space radiation. Our shields going down is very bad news for all life on our planet, and could possibly even lead to the next mass extinction.

“As the magnetic field weakens, the poles shift,” says David Mauriello of the ORP and MRN. For the past 100-or-so years, both north and south poles have been rapidly headed towards the equator (shown below), and their pace is increasing, warns Mauriello. The south pole is now off the Antarctic continent and making a beeline for Indonesia, and the north pole is shifting across the Arctic circle towards Siberia, it too headed for Indonesia–where the pair are likely to meet within the next few decades, perhaps around 2050.

This “meeting” will lead to one of two eventualities: 1) a full flip will take place (aka a “reversal” where the magnetic poles switch places), or 2) a “snap-back” will occur where the poles quickly return to their original starting points (aka an “excursion”).

A New Mass Extinction Event Has Been Discovered, And It Triggered The Rise of Dinosaurs

by M. Benton, Sep 25, 2020 in ScienceAlert


Huge volcanic eruptions 233 million years ago pumped carbon dioxide, methane, and water vapour into the atmosphere. This series of violent explosions, on what we now know as the west coast of Canada, led to massive global warming.

Our new research has revealed that this was a planet-changing mass extinction event that killed off many of the dominant tetrapods and heralded the dawn of the dinosaurs.

The best known mass extinction happened at the end of the Cretaceous period, 66 million years ago. This is when dinosaurs, pterosaurs, marine reptiles and ammonites all died out.

This event was caused primarily by the impact of a giant asteroid that blacked out the light of the sun and caused darkness and freezing, followed by other massive perturbations of the oceans and atmosphere.

Geologists and palaeontologists agree on a roster of five such events, of which the end-Cretaceous mass extinction was the last. So our new discovery of a previously unknown mass extinction might seem unexpected.

And yet this event, termed the Carnian Pluvial Episode (CPE), seems to have killed as many species as the giant asteroid did. Ecosystems on land and sea were profoundly changed, as the planet got warmer and drier.

On land, this triggered profound changes in plants and herbivores. In turn, with the decline of the dominant plant-eating tetrapods, such as rhynchosaurs and dicynodonts, the dinosaurs were given their chance.

In Parts Of Japan, Mean Maximum Temperatures May Be More Impacted By Remote Ocean Cycles Than By CO2

by P. Gosselin, Sep 26, 2020 in NoTricksZone


Today, according to government scientists, CO2 is supposed to be the dominant climate driver, overwhelming all the other power natural forces such as solar variability and oceanic cycles.

Map (right): JMA

Yet when we compare (untampered) datasets, we often find surprising parallels and underlying correlations with these now ignored natural factors, which tell us CO2 isn’t what the activists want us to believe it is and that things are really much messier than the simplistic CO2-temperature correlation.

Today we look at a plot of the annual mean daily maximum temperature from Uwajima, Japan, together with the plot of the Atlantic Multidecadal Oscillation (AMO) going back almost 100 years.

Data: data.jma.go.jp/ / psl.noaa.gov/

Of course, nothing in a complex system like climate is going to show a perfect correlation, yet the above general fit is quite remarkable, which thus suggests regions are climatically interconnected in many yet to be understood ways. Such things aren’t accidental.

In summary: climate science is far from being understood, let alone settled. Anyone suggesting otherwise is likely just trying to sell you a bridge in Brooklyn – or they simply don’t know much about the subject and only parroting media sound bites.

Global Warming Drives Wildfires Study–Ignores Pre 1979 Data

by P. Homewood, Sep 25, 2020 in WUWT


Climate change is driving the scale and impact of recent wildfires that have raged in California, say scientists.

Their analysis finds an “unequivocal and pervasive” role for global heating in boosting the conditions for fire.

California now has greater exposure to fire risks than before humans started altering the climate, the authors say.

Land management issues, touted by President Donald Trump as a key cause, can’t by themselves explain the recent infernos.

The new review covers more than 100 studies published since 2013, and shows that extreme fires occur when natural variability in the climate is superimposed on increasingly warm and dry background conditions resulting from global warming.

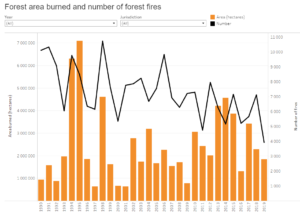
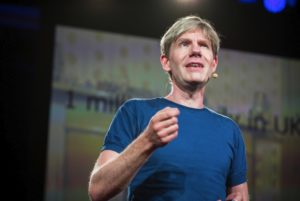
“In terms of the trends we’re seeing, in terms of the extent of wildfires, and which have increased eight to ten-fold in the past four decades, that trend is driven by climate change,” said Dr Matthew Jones from the University of East Anglia in Norwich, UK, who led the review.

“Climate change ultimately means that those forests, whatever state they’re in, are becoming warmer and drier more frequently,” he told BBC News.

“And that’s what’s really driving the kind of scale and impact of the fires that we’re seeing today.”

In the 40 years from 1979 to 2019, fire weather conditions have increased by a total of eight days on average across the world.

However, in California the number of autumn days with extreme wildfire conditions has doubled in that period.

The authors of the review conclude that “climate change is bringing hotter, drier weather to the western US and the region is fundamentally more exposed to fire risks than it was before humans began to alter the global climate”.

https://www.bbc.co.uk/news/science-environment-54278988

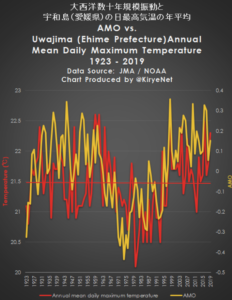
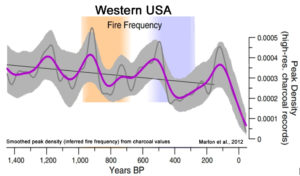
Now why should they start their study in 1979? After all, there is loads of data from earlier years.

A look at NOAA’s rainfall graph for California shows just why:

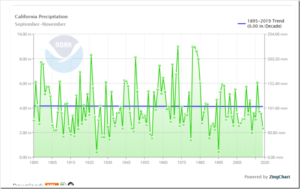
https://www.ncdc.noaa.gov/cag/national/time-series

Scientists Find Peak 1940s Warmth, Post-1950s Cooling In The Same Western US Region Where Hockey Sticks Emerged

by K. Richard, Sep 24, 2020 in NoTricksZone


A new 1735-2015 temperature reconstruction (Heeter et al., 2020) using Western US tree ring proxies shows peak 1940s warmth and post-1950s cooling. This is the same region Dr. Michael Mann used tree ring data to construct his famous hockey stick graph.

A new Scandinavian temperature reconstruction (Seftigen et al., 2020) that’s “skillfull in characterizing past temperature changes over the past one to two millennia” finds there

Curved rock etchings reveal which way dangerous faults ruptured—and how they might again

by P. Voosen, Sep 23, 2020 in AAAS Science


Many of the world’s most dangerous earthquake faults are a silent menace: They have not ruptured in more than a century. To gauge the hazard they pose to buildings and people, geologists cannot rely on the record of recent strikes, captured by seismometers. Instead, they must figure out how the faults behaved in the past by looking for clues in the rocks themselves, including slickenlines, scour marks along the exposed rock face of a fault that can indicate how much it slipped in past earthquakes.

Earthquakes don’t happen all at once. Rather, the slip between rocks begins at one spot on the face of the fault—the hypocenter—and travels along it, like a zipper being unzipped. As the rupture advances, the earthquake waves it generates pile up and intensify, like the siren of an approaching ambulance. Los Angeles lies at the northern terminus of the southern San Andreas fault, Ampuero notes. “If it breaks north, toward LA, that would be pretty bad.”

CLINTEL puts hard climate questions to Bill Gates

by D. Wojick, Sep 23, 2020 in CFACT


Bill Gates is throwing several billion dollars at climate change. Mind you he is not throwing it away, because it is mostly venture capital for new energy technologies, which could pay off handsomely without climate change.

Gates can do what he likes with his riches, but he is a leading figure and lately he has become a serious climate change scaremonger. This has prompted CLINTEL to put some hard questions to him, in the form of a registered letter.

On the scaremongering side, last month Gates published an article claiming that climate change will be far worse than the present Covid outbreak. He imagines many millions dying from climate change. The press spread his doomsday words far and wide.

Here are some doomful excerpts:

I am talking about COVID-19. But in just a few decades, the same description will fit another global crisis: climate change. As awful as this pandemic is, climate change could be worse.

I realize that it’s hard to think about a problem like climate change right now. When disaster strikes, it is human nature to worry only about meeting our most immediate needs, especially when the disaster is as bad as COVID-19. But the fact that dramatically higher temperatures seem far off in the future does not make them any less of a problem—and the only way to avoid the worst possible climate outcomes is to accelerate our efforts now. Even as the world works to stop the novel coronavirus and begin recovering from it, we also need to act now to avoid a climate disaster by building and deploying innovations that will let us eliminate our greenhouse gas emissions.”

The unfortunate ‘climate anomaly’ of the First World War revealed

by P. Homewood, Sep 4, 2020 in NotaLotofPeopleKnowThat


A new research paper states this anomalous weather coincided with battles where: “The mud and water‐filled trenches and bomb craters swallowed everything, from tanks, to horses and troops, becoming what eyewitnesses described as the ‘liquid grave’ of the armies.”

Prof Alexander F More, who led the research for Harvard, explained: “Atmospheric circulation changed and there was much more rain, much colder weather all over Europe for six years.” “It was a once in a 100-year anomaly.”

This anomaly wreaked havoc on battlefields beginning with the First Battle of Champagne in 1914 , where British, French, and German troops suffered flooded trenches and frostbite while mud “slowed down the movement of troops and artillery”.

The Somme and Verdun in 1916, and the Third Battle of Ypres-Passchendaele in 1917, were slogged out in quagmires caused by the freak downpours which increased casualties.

Royal Artillery signaller John Palmer described his trauma at seeing men “sinking into the slime, dying in the slime” on the Western Front.

WOW!! And no mention of CO2!

Life on Earth may have begun in hostile hot springs

by Jack L. Lee, Sep 245, 2020 in Sciencenews


At Bumpass Hell in California’s Lassen Volcanic National Park, the ground is literally boiling, and the aroma of rotten eggs fills the air. Gas bubbles rise through puddles of mud, producing goopy popping sounds. Jets of scorching-hot steam blast from vents in the earth. The fearsome site was named for the cowboy Kendall Bumpass, who in 1865 got too close and stepped through the thin crust. Boiling, acidic water burned his leg so badly that it had to be amputated.

Some scientists contend that life on our planet arose in such seemingly inhospitable conditions. Long before creatures roamed the Earth, hot springs like Bumpass Hell may have promoted chemical reactions that linked together simple molecules in a first step toward complexity. Other scientists, however, place the starting point for Earth’s life underwater, at the deep hydrothermal vents where heated, mineral-rich water billows from cracks in the ocean floor.

As researchers study and debate where and how life on Earth first ignited, their findings offer an important bonus. Understanding the origins of life on this planet could offer hints about where to search for life elsewhere, says Natalie Batalha, an astrophysicist at the University of California, Santa Cruz. “It has very significant implications for the future of space exploration.” Chemist Wenonah Vercoutere agrees. “The rules of physics are the same throughout the whole universe,” says Vercoutere, of NASA’s Ames Research Center in Moffett Field, Calif. “So what is there to say that the rules of biology do not also carry through and are in place and active in the whole universe?”

Claim: Svalbard glaciers lost their protective buffer in the mid-1980s and have been melting ever since

by B. Noel & M.  van den Broeke, Sep  23, 2020 in WUWT/U.Utrecht


The archipelago of Svalbard, a land of ice and polar bears, is found midway between mainland Norway and the North Pole. Its capital Longyearbyen on the main island of Spitsbergen is the world’s most northerly city, some 800 miles inside the Arctic Circle.

Svalbard is also home to some of the Earth’s northernmost glaciers, which bury most of the archipelago’s surface under no less than 200 metres of thick ice. Taken together, Svalbard glaciers represent 6% of the worldwide glacier area outside the large ice sheets of Greenland and Antarctica – if they totally melted, they would raise the sea level by 1.7cm.

Svalbard is roughly the size of Ireland or Sri Lanka, but largely covered in ice. Google Maps

Determined Scientists Add Phantom ‘Unprecedented’ Warmth To New Temperature Reconstructions

by K. Richard, Sep 21, 2020 in NoTricksZone


Paleoclimate reconstructions that find no unusual modern warming are nonetheless characterized as showing sharp temperature increases in recent decades anyway.

A new (Li et al., 2020) 1818-2012  temperature reconstruction determined 1955 (6.33 °C) and 2001 (7.17 °C) were the 1st and 5th coldest years in northeastern China in the last 200 years. The two warmest years were 1832 (9.63 °C) and 1900 (9.57 °C).

Further, the highest “continuous high decadal temperatures” recorded were in 1818–1844 and 1856–1873. The post-1950s temperatures were colder than nearly all of the first 100 years of the temperature record.

And yet in spite of the warmer 19th-century temperatures, the authors chracterize the slight temperature rise since the 1950s as heralding  in “unprecedented” warming. They make this claim (of “unprecedented” recent warmth) in both the paper’s textual and graphical abstracts.


Image Source: Li et al., 2020


Forbes et al. (2020) use thermometer data from an Alaskan airport for the last ~90 years of their temperature record. The instrumentals show surface temperatures cooled -0.7°C in winter (January) and warmed 0.8°C in summer (July) from the 1950s-’80s decades to the 1990s to 2010s.

For the summer temperature record (shown in red below), nearly all the warming occurred during a step-change from the mid-1970s to mid-1980s. Since about 1985, summer temperatures seem to have been stable to slightly declining.

A lack of net overall warming in the last 50 or 60 years does not advance the anthropogenic global warming (AGW) cause, of course.

A global-scale data set of mining areas

by Maus, V. Sep 8, 2020 in ScientificData OPEN ACCESS


Abstract

The area used for mineral extraction is a key indicator for understanding and mitigating the environmental impacts caused by the extractive sector. To date, worldwide data products on mineral extraction do not report the area used by mining activities. In this paper, we contribute to filling this gap by presenting a new data set of mining extents derived by visual interpretation of satellite images. We delineated mining areas within a 10 km buffer from the approximate geographical coordinates of more than six thousand active mining sites across the globe. The result is a global-scale data set consisting of 21,060 polygons that add up to 57,277 km2. The polygons cover all mining above-ground features that could be identified from the satellite images, including open cuts, tailings dams, waste rock dumps, water ponds, and processing infrastructure. The data set is available for download from https://doi.org/10.1594/PANGAEA.910894 and visualization at www.fineprint.global/viewer.

Solar panels generate mountains of waste

by D. Flanakin, Sep 19, 2020 in WUWT


They also heat the planet, blanket wildlife habitats and cause other ecological damage

The problem of solar panel waste is now becoming evident. As environmental journalist Emily Folk admits in Renewable Energy Magazine, “when talking about renewable energy, the topic of waste does not often appear.” She attributes this to the supposed “pressures of climate change” and alleged “urgency to find alternative energy sources,” saying people may thus be hesitant to discuss “possible negative impacts of renewable energy.”

Ms. Folk admits that sustainability requires proper e-waste management. Yet she laments, “Solar presents a particular problem. There is growing evidence that broken panels release toxic pollutants … [and] increasing concern regarding what happens with these materials when they are no longer viable, especially since they are difficult to recycle.”

This is the likely reason that (except in Washington state), there are no U.S. mandates for solar recycling. A recent article in Grist reports that most used solar panels are shipped to developing countries that have little electricity and weak environmental protections, to be reused or landfilled.

The near-total absence of end-of-life procedures for solar panels is likely a byproduct of the belief (and repeated, unsupported assertion) that renewable energy is “clean” and “green.” Indeed, Mississippi Sierra Club state director Louie Miller recently claimed that unlike fossil fuels and nuclear energy, “Sunshine is a free fuel.” Well, sunshine is certainly free and clean. However, there is a monumental caveat.

Harnessing sunshine (and wind) to serve humanity is not free – or clean, green, renewable or sustainable.

Undersea earthquakes shake up climate science

by C. Rotter, Sep 20, 2020 in WUWT


Despite climate change being most obvious to people as unseasonably warm winter days or melting glaciers, as much as 95 percent of the extra heat trapped on Earth by greenhouse gases is held in the world’s oceans. For that reason, monitoring the temperature of ocean waters has been a priority for climate scientists, and now Caltech researchers have discovered that seismic rumblings on the seafloor can provide them with another tool for doing that.

In a new paper publishing in Science, the researchers show how they are able to make use of existing seismic monitoring equipment, as well as historic seismic data, to determine how much the temperature of the earth’s oceans has changed and continues changing, even at depths that are normally out of the reach of conventional tools.

They do this by listening for the sounds from the many earthquakes that regularly occur under the ocean, says Jörn Callies, assistant professor of environmental science and engineering at Caltech and study co-author. Callies says these earthquake sounds are powerful and travel long distances through the ocean without significantly weakening, which makes them easy to monitor.

Wenbo Wu, postdoctoral scholar in geophysics and lead author of the paper, explains that when an earthquake happens under the ocean, most of its energy travels through the earth, but a portion of that energy is transmitted into the water as sound. These sound waves propagate outward from the quake’s epicenter just like seismic waves that travel through the ground, but the sound waves move at a much slower speed. As a result, ground waves will arrive at a seismic monitoring station first, followed by the sound waves, which will appear as a secondary signal of the same event. The effect is roughly similar to how you can often see the flash from lightning seconds before you hear its thunder.


IMAGE: AN ARTIST’S RENDERING OF UNDERSEA EARTHQUAKE WAVES. view more CREDIT: CALTECH

Censored: Australian scientists say suppression of environment research is getting worse

by D. Lewis, Sep 21, 2020 in Nature


Environmental scientists in Australia say that they are under increasing pressure from their employers to downplay research findings or avoid communicating them at all. More than half of the respondents to an online survey thought that constraints on speaking publicly on issues such as threatened species, urban development, mining, logging and climate change had become worse in recent years.1

The findings, published this month in Conservation Letters, reflect how politicized debates about environmental policy in Australia have become, says Saul Cunningham, an environmental scientist at the Australian National University in Canberra. “We need our publicly funded institutions to be more vocal in defending the importance of an independent voice based on research,” he says.

Australian scientists aren’t the only ones who have reported interference in science or pressure — particularly from government employers — to downplay research findings. Scientists in the United States, Canada and Brazil have also reported such intrusions in the past decade.

Scale of the problem

Two-hundred and twenty scientists in Australia responded to the survey, which was organized by the Ecological Society of Australia and ran from October 2018 until February 2019. Some of the respondents worked in government, others in universities or in industry, for example in environmental consultancies or non-governmental organizations.

The results show that government and industry scientists experienced greater constraints from their employers than did university staff. Among government employees, about half were prohibited from speaking publicly about their research, compared with 38% employed in industry and 9% of university staff. Three-quarters of those surveyed also reported self-censoring their work.

….

SANGAY VOLCANO ERUPTS TO 40,000 FT (12.2 KM)

by Cap Allon, Sep 21, 2020 in Electroverse


Ecuador’s active Sangay Volcano exploded in dramatic fashion over the weekend, firing volcanic ash high into the atmosphere — the explosion was a number of times stronger than those previously observed during the volcano’s recent uptick.

The ‘high-level’ eruption occurred at 04:20 local time on Sunday, September 20 and generated a dense, dark ash plume, but the ‘biggie’ was sandwiched between numerous other powerful blasts that occurred throughout the weekend:

More crucially though, particulates ejected to around 32,800 ft (10 km) –and into the stratosphere– can have a direct cooling effect across the planet.

Volcanic eruptions are one of the key forcings driving Earth into its next bout of global cooling. Their worldwide uptick (along with a seismic uptick) is tied to low solar activity, coronal holes, a waning magnetosphere, and the influx of Cosmic Rays penetrating silica-rich magma.

Sector by sector: where do global greenhouse gas emissions come from?

by H. Ritchie, Sep 18, 2020, in OurWorldlinData


To prevent severe climate change we need to rapidly reduce global greenhouse gas emissions. The world emits around 50 billion tonnes of greenhouse gases each year [measured in carbon dioxide equivalents (CO2eq)].

To figure out how we can most effectively reduce emissions and what emissions can and can’t be eliminated with current technologies, we need to first understand where our emissions come from.

In this post I present only one chart, but it is an important one – it shows the breakdown of global greenhouse gas emissions in 2016. This is the latest breakdown of global emissions by sector, published by Climate Watch and the World Resources Institute.,

The overall picture you see from this diagram is that almost three-quarters of emissions come from energy use; almost one-fifth from agriculture and land use  [this increases to one-quarter when we consider the food system as a whole – including processing, packaging, transport and retail]; and the remaining 8% from industry and waste.

To know what’s included in each sector category, I provide a short description of each. These descriptions are based on explanations provided in the IPCC’s Fifth Assessment Report AR5) and a methodology paper published by the World Resources Institute.,

HUNDREDS OF ALL-TIME LOW TEMPERATURE RECORDS TUMBLED OVER THE PAST 24HRS — MSM SILENT

by Cap Allon, Sep 20, 2020 in Electroverse


A nation-spanning mass of Arctic air has parked itself over the eastern half of North America of late, rewriting the record-books in many states, districts, and provinces, including in New York, Washington, and Ontario.

The city of Syracuse, NY tied an all-time record low of 34F (1.1C) on Saturday morning, just after 6AM, a feat originally achieved back in 1943–duringsolar minimum of cycle 17.

Buffalo also tied a low temperature record — the 38F (3.3C) registered on Saturday matched the record low for the day set back in 1995–solar minimum of cycle 22.


A 500-million-year survey of Earth’s climate reveals dire warning for humanity

by P. Voosen, May 22, 2019 in AAAS/Science


When it opens next month, the revamped fossil hall of the Smithsonian Institution’s National Museum of Natural History in Washington, D.C., will be more than a vault of dinosaur bones. It will show how Earth’s climate has shifted over the eons, driving radical changes in life, and how, in the modern age, one form of life—humans—is, in turn, transforming the climate.

To tell that story, Scott Wing and Brian Huber, a paleobotanist and paleontologist, respectively, at the museum, wanted to chart swings in Earth’s average surface temperature over the past 500 million years or so. The two researchers also thought a temperature curve could counter climate contrarians’ claim that global warming is no concern because Earth was much hotter millions of years ago. Wing and Huber wanted to show the reality of ancient temperature extremes—and how rapid shifts between them have led to mass extinctions. Abrupt climate changes, Wing says, “have catastrophic side effects that are really hard to adapt to.”

But actually making the chart was unexpectedly challenging—and triggered a major effortto reconstruct the record. Although far from complete, the research is already showing that some ancient climates were even more extreme than was thought.

Bjorn Lomborg: CA Fires Caused By Century Of Suppressing Controlled Burns

by R. Kraychik, Sep 18, 2020 in ClimateChangeDisptach


Ongoing forest fires in California are mostly a function of poor forest management, particularly insufficient controlled burns to clear away accumulated fuelwood, explained Bjorn Lomborg, presidentof the Copenhagen Consensus Center and author of False Alarm,offering his remarks on Thursday’s edition of SiriusXM’s Breitbart News Daily with host Alex Marlow.

“It has fairly little to do with climate change, and it has almost everything to do with the fact that we haven’t managed our forest well,” said Lomborg of California wildfires. “We haven’t done prescribed burning. We haven’t ensured that these fires won’t burn out of control.”

Lomborg added, “We’ve just simply allowed fuelwood to build up to cause almost uncontrollable fires in California.”

Prescribed burnings are necessary to reduce the risk of uncontrollable forest fires, Lomborg stated. “If we did prescribed burning, we could, in a few years, reduce the fire risk dramatically and actually get people’s lives back to — pretty close — to normal.”


Scientists: No Correlation Between Climate Change And Wildfires In California – Or Anywhere Else On Earth

by K. Richard, Sep 17,2020 in NoTricksZone


A “potential connection” between anthropogenic global warming and the frequency or intensity of wildfires in California has yet to emerge in the trend observations.

Scientists have found a “lack of correlation between late summer/autumn wildfires” and “summer precipitation or temperature” in coastal California. In fact, “there is no long-term trend in the number of fires over coastal California” in the last 50 years (Mass and Ovens, 2019).

mage Source: Marlon et al., 2012

As CO2 concentrations have risen from 300 ppm to 400 ppm (1900 to 2007), the decline in global burned area has been significant (Yang et al., 2014)