New Study Finds No Evidence Of A CO2-Driven Warming Signal In 60 Years Of IR Flux Data

by K. Richard, Jan 11, 2024 in NoTricksZone


“The real atmosphere does not follow the GHG [greenhouse gas] GE [greenhouse effect] hypothesis of the IPCC.” – Miskolczi, 2023

CO2 increased from 310 ppm to 385 ppm (24%) during the 60 years from 1948 to 2008. Observations indicate this led to a negative radiative imbalance of -0.75 W/m². In other words, increasing CO2 delivered a net cooling effect – the opposite of what the IPCC has claimed should happen (Miskolczi, 2023).

Also, there is “no correlation with time and the strong signal of increasing atmospheric CO2 content in any time series,” which affirms “the atmospheric CO2 increase cannot be the reason for global warming.”

“The Arrhenius type greenhouse effect of the CO2 and other non-condensing GHGs is an incorrect hypothesis and the CO2 greenhouse effect based global warming hypothesis is also an artifact without any theoretical or empirical footing.”

Hottest 12 Months for 125,000 Years Claim Lacks Any Scientific Evidence

by C. Morrison, Jan 7, 2023 in TheDailySceptic, 


Last year humanity lived through the hottest 12 months in at least 125,000 years, reported an hysterical CNN, a frame of mind replicated throughout much of the mainstream media. Scientists have compared 2023’s “climate change fallout” to a “disaster movie”, added the U.S. cable news channel. All poppycock, needless to say, with a political Net Zero motive, and little if any scientific evidence to back it up. Accurate temperature records barely started before the 20th century, and recent measurements by fixed thermometers have been heavily corrupted by growing urban heat. It is in fact possible using proxy measurements to get a good idea of general temperature movements over the last 125,000 years. All the evidence points to periods of much higher temperatures, notably between 10,000 to 5,000 years ago. The latest science paper examining this trend has just been published, and it points to summer temperatures at least 1.5°C higher around 5,000 years ago in the eastern Mediterranean, at a time when civilisation was developing rapidly.

Mount Pinatubo eruption caused the major East China flood in 1991

by C. Xing & F. Liu, Jan 2023 in InnovativeGeoscience


The devastating flood of 2020 along the Yangtze River serves as a painful reminder of the 1991 East China’s largest flood. The latter event profoundly impacted the Yangtze-Huaihe River basins (YHRBs), causing extensive damage to both human lives and property1. The flood engulfed numerous villages and cities across seven provinces in East China, affecting over 15,000,000 hectares of farmland and approximately 100 million people. In response, millions of individuals in Anhui and Jiangsu provinces were forced to evacuate, with some seeking refuge on the banks of the Huaihe River. Gaining a comprehensive understanding of the contributing factors to this historically significant flood will enhance our ability to predict the East Asian summer monsoon and mitigate related climate disasters. Over the past three decades, this pursuit has been a persistent challenge1,2,3.

The 1991 East China flood was attributed to prominent intraseasonal oscillations, as evidenced by three episodes of heavy rain occurring from mid-May to mid-July over the YHRBs2, primarily linked to the persistent Meiyu front during early July1. The stable western Pacific subtropical high (WPSH), which plays a crucial role in influencing the East Asian monsoon by altering the convergence of southeasterly and southwesterly, provided substantial support for the prolonged existence of the Meiyu front in 19911; However, the reason behind the prolonged stability of the WPSH during that specific period remains a mystery.

No internal climate variability modes were reported to be in their most flood-favorable conditions during 1991, and the effect of external forcing on this flood disaster was not taken into consideration at all. Half a month before the flood, the Mount Pinatubo (located at 120.4ºE, 15.1ºN) in Luzon, the Philippines, explosively erupted on June 15th, 1991, which later is known as one of the strongest volcanic eruption in the past century. This eruption released approximately 20 Tg of SO2 into the tropical stratosphere4, which can form stratospheric aerosol that impact the global radiative balance. The stratospheric volcanic aerosol acts as a major forcing on the climate by cooling the global surface and slowing down the water cycle on annual to decadal timescales5. However, it remains unclear whether explosive volcanic eruptions have short-term impacts on the climate, particularly on the intraseasonal timescale.

UK Rainfall In 2023

by P. Homewood, Jan 7 ,2024 in NotaLotofPeopleKonwThat


image

https://www.metoffice.gov.uk/hadobs/hadukp/data/monthly/HadEWP_monthly_totals.txt

Last year was a wet one in England & Wales, the 7th wettest on record. (The UK series has a similar result).

We routinely hear claims that the climate is wetter because a warmer atmosphere can hold more moisture, (while also being told we will get more droughts!). However the fact that we have had similarly wet years in the distant past, such as 1768, 1852, 1872, 1877, 1882, 1903 and 1960, rather demolishes that argument.

The major factor behind last year’s high rainfall was that the number of rain days was also one of the highest on record since 1931, when Met Office daily data begins. In short, annual rainfall was high because of weather, not climate.

Rising Maximum Temperatures

by K. Hansen, Jan5, 2024 in WUWT


Roger Pielke Jr. recently posted a piece at The Honest Broker titled:  “U.S. Climate Extremes: 2023 Year in Review   – A Very Normal Year” – which was subsequently reposted at WUWT.

In that post, he uses this graphic:

(I have increased the size of the titles for clarity – kh)

It is easy to see that the trends of both the Maximum January temperatures and the Maximum July temperatures have been rising — more so for January temperatures than July — though this is somewhat obscured by the different scales of the two graphs.   [Caveat:  The temperature record on which this graph is based is not scientifically reliable before about 1940.] Also, one has to be careful to note what exactly they are really measuring.

CET Daily Temperatures

by P. Homewood, Jan 4, 2023 in NotaLotofPeople KnowThat


https://www.metoffice.gov.uk/hadobs/hadcet/cet_info_max2023.html

I want to focus on the end of year CET graph, which gives the lie to the extreme temperature myth often bandied around.

The graph plots daily max CET temperatures, against the background of the percentiles of the 1961-90 climatology. The Met Office should of course be using 1991-2020 as the baseline, so the climatology should be shifted upwards by a half a degree or so. But we’ll leave that aside.

We can legitimately regard anything between the 5% and 95% bands as being “weather”. Only days outside this might be regarded as “extreme”. (I would actually argue anything outside 1% and 99%).

We see that apart from a handful of days, every day was within that “normal weather” band.

In a year there will be 36 days outside of that band on average. The Met Office do not supply the data for these percentiles to enable the number of days to be calculated, but this year it does not look to be excessive in terms of that average.

Moreover, although there were a few days in September which set record highs for that particularly day, none were records for the month as a whole. The highest temperature last September was 28.9C, but the record for September stands at 31.5C in 1906:


Of course most of the year had temperatures above the average. But we have a wide range of weather in Britain. We can have mild, wet winters, and cold, snowy ones; we can have cool, wet summers and sunny hot ones. But these are weather events, not climate, and they are dependent on weather patterns, the jet stream and so on.

A predominance of warmer weather is not climate change.

No Trends In Extratropical Cyclones – IPCC

by  P. Homewood, Jan 2, 2024 in NotaLotofPeopleKnowThat


image

We constantly hear that storms are getting worse because of global warming. These claims are not referring to hurricanes and tropical storms, but the sort of storm which hits the UK several times every winter.

These are known as Extratropical Storms. The clown Jim Dale made this very claim again this week after Strom Gerrit. According to him, it is all to do with warm oceans, which pep up these storms. If this was correct, there would never be any storms in the Arctic. But claims such as this show a basic misunderstanding of meteorology; astonishing for somebody who claims to be a meteorologist!

NOAA explain the difference between tropical and extratropical cyclones (ETCs):

61 NoTricksZone Articles On Studies, Datasets From 2023 Show Climate Models Are Rubbish

by P.  Gosselin,  Ec 31, 2023 in NoTricksZone


Most climate models are worse than garbage, a number of real measurements, peer-reviewed studies and data show. Their phony results are mainly used to spread fear. 


The outputs of model simulations often get confused by the media and public as real measurement results. But often they are generated nefariously to promote panic.

Recall the pandemic models showing showing 100s of millions would die if we didn’t lockdown. In reality COVID 19 was no worse than a regular flu.

What follows are 61 NTZ posts from 2023 that show that climate model results have nothing to do with reality. Their outputs are garbage. 

1. Typhoons are supposed to be getting more frequent and worse. They are not.

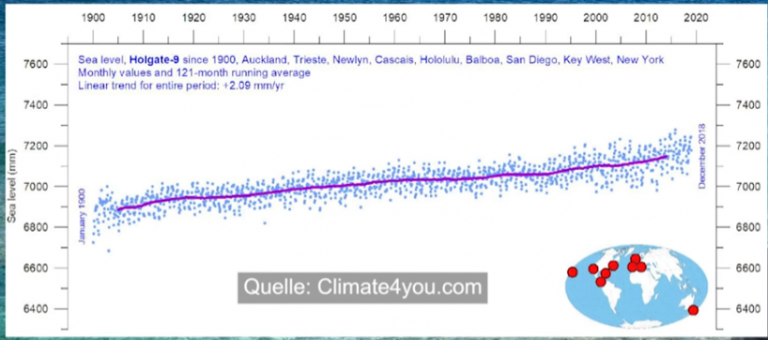
2. Sea levels rise is accelerating, models say. Fact: at many places they are falling.

3. It’s the hottest in 125,000 years. Wrong, e.g. it was fore example 4-7°C warmer in Austria 2000 years ago.

4. CO2 is the main driver. It is not. Models severely underestimate clouds.

5. Water vapor causes warming. But here’s a study that suggests the opposite.

6. CO2 leads to warming and drought. But the opposite is true: greening and cooling.

7. Winters in Tokyo are warming, the models tell us. But JMA data in fact show they are cooling.

8. Models show rapidly rising sea levels. But tide gauges and studies show it’s not true.

9. Models say Venice is gonna sink. It’s not happening, a study shows.

10. Models say that Holocene sea levels are higher than ever today. But mid-Holocene levels were 1-3 meters higher.


51. Remember how the models predicted Greenland would melt rapidly and cause sea levels to rise by meters? Well, since 1992, it has only contributed 1.2 CENTIMETERS!

52. Oops, also volcanic activity got neglected by the models too.

53. Two Portuguese scientists (Khmelinskii and Woodcock, 2023) identify at least 8 assumptions in the “greenhouse gas hypothesis” that lack scientific validation.  Models can’t work if the assumptions are grossly false.

54. Models got the aerosol forcings wrong too. ..10 times larger.

55. Antarctica has cooled. Models are wrong on that, too.

56. Models have been failing for 4 decades. Remember above how we remarked they worked better in the 1980s.

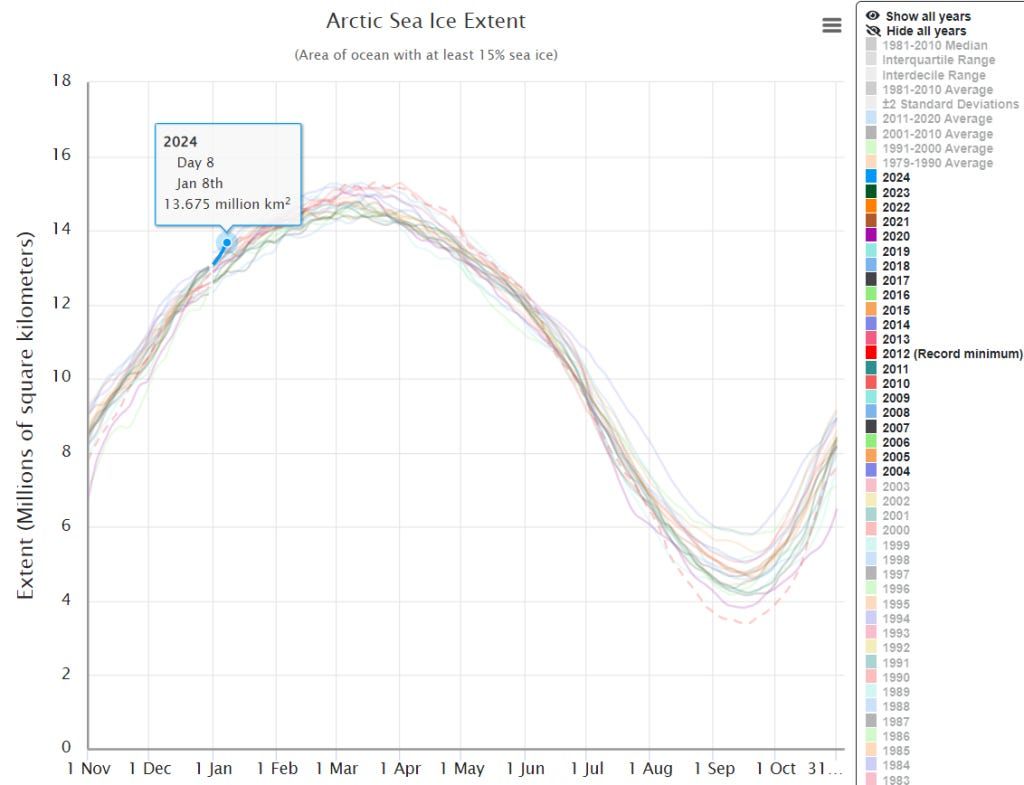
57. Modern sea ice extent is nearly the highest it’s been in 9000 years.

58. The rise of CO2 over the past 120 years hasn’t really altered the greenhouse effect. Someone tell the modelers.

59. A new paper finds that the models have it backwards: warming drives CO2!

60. Definitely today is NOT the warmest its been in 125,000 years, not even 10,000 years.

61. German Helmholtz UFZ ground moisture models insist the ground is still dry, even after weeks of heavy rains and floods.

Is the Low Snowpack this Year a Sign of Global Warming?

C. Mass, Jan1, 2024 in WUWT


El Nino

We are in a very strong El Nino and such events are highly correlated with warm winter temperatures and poor snowpack over the region.  Sea surface temperatures have been about 2C above normal over the past two months (see below).

According to NOAA/NWS, El Nino years are associated with warmer than normal October-November-Decembers (see below for a local climate division)