
by Cap Allon, July 5, 2019 in Electroverse
On the back of the well documented 3-days of heat last week, Germany is now setting multiple new record low temperatures as the anticipated and long-lasting Arctic front begins to take hold.
The mercury in Rotenburg, Lower Saxony plunged to 2.9C (37.2F) on Thursday morning — low enough to break the town’s all-time record cold temperature for the month of July which had stood since 1946, according to wetter.com.
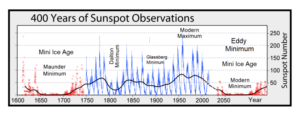
The new record low temperature comes just days after Germany logged an all-time record high — serving as further evidence of the swings-between-extremes brought on by low solar activity and the associated weakening of the jet stream.
SEE ALSO: The Changing Jet Stream
Along with Rotenburg, many other regions of Germany also registered record-low temperatures on Thursday morning.
I’ve listed a few below (data again courtesy of wetter.com):
- Quickborn: 4C (39.2F) — lowest July temperature since 1999.
- Göttingen: 4C (39.2F) — lowest July temperature since 1996.
- Soltau: 4.1C (39.4F) — lowest July temperature since 1986.
- Friesoythe: 4.7C (40.5F) –lowest July temperature since 1971.
- Lippstadt: 4.8C (40.6F) — lowest July temperature since 1990.
- Diepholz: 5.1C (41.2F) — lowest July temperature since 1971.
In addition, the village of Deutschneudorf in Saxony reported ground frost this week — an event that’s only occurred on six previous occasions throughout all of Germany during the month of July.
…

