COP21 does not define the scientific basis of the agreement for the warming effects of the anthropogenic emissions, but it refers to a scenario. This scenario has not been defined in the COP21, but it can be found. The scientific resource of United Nations as well as of the COP21 is IPCC. The exact specification of IPCC is (Summary for Policymakers. In: Climate Change 2014. Mitigation of Climate Change”): “Baseline scenarios, those without additional mitigation, result in global mean surface temperature increases in 2100 from 3.7 °C to 4.8 °C compared to pre-industrial levels (range based on median climate response; the range is 2.5 °C to 7.8 °C when including climate uncertainty)”. Even though IPCC refers to multiple scenarios in the text above, the surface temperature increase to the average value of 4.25 ⁰C means one scenario only.
A recent study published in an esteemed academic journal indicates that volcanic eruptions in the mid 500s resulted in an unusually gloomy and cold period. A joint research project of the Chronology Laboratory of the Finnish Museum of Natural History and Natural Resources Institute Finland (Luke) suggests that the years 536 and 541-544 CE were very difficult for many people.
The solar activity in the past millennia can only be reconstructed from cosmogenic radionuclide proxy records in terrestrial archives. However, because of the diversity of the proxy archives, it is difficult to build a homogeneous reconstruction. All previous studies were based on individual, sometimes statistically averaged, proxy datasets. Here we aim to provide a new consistent multi- proxy reconstruction of the solar activity over the last 9000 years, using all available long-span datasets of 10Be and 14C in terrestrial archives.
Global mean sea level (GMSL) has increased by about 8–9 inches since 1880, with about 3 inches occurring since 1993. As discussed in Part VI, scientists expect that GMSL will continue to rise well beyond the 21st century because of global warming that has already occurred and warming that is yet to occur.
The recent NOAA Report Global and Regional Sea Level Rise Scenarios for the United States has stated that even the relatively small increases in sea level over the last several decades have been associated greater storm impacts at many places along the U.S. coast. Further, the frequency of intermittent flooding associated with unusually high tides has increased rapidly in response to increases in local sea level, becoming a recurrent and disruptive problem.
by H.. Svensmark, June1 , 2016 in Principia.Sci.International
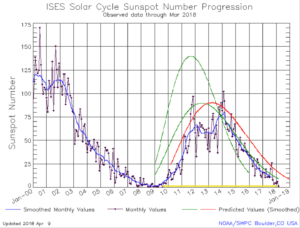
The star that keeps us alive has, over the last few years, been almost free of sunspots, which are the usual signs of the Sun’s magnetic activity. Last week [4 September 2009] the scientific team behind the satellite SOHO (Solar and Heliospheric Observatory) reported, “It is likely that the current year’s number of blank days will be the longest in about 100 years.” Everything indicates that the Sun is going into some kind of hibernation, and the obvious question is what significance that has for us on Earth.
If you ask the Intergovernmental Panel on Climate Change (IPCC) which represents the current consensus on climate change, the answer is a reassuring “nothing”. But history and recent research suggest that is probably completely wrong. Why? Let’s take a closer look.
The New York Times recently published an article penned by Erica Goode on the controversial Harvey et al paper, where 14 scientists (sophomorically) attacked polar bear researcher Susan Crockford and climate science skeptics.
Sloppy biased journalism
So it is no surprise that Erica Goode at the New York Times sided up with the 14 scientists of the Harvey publication to attack the so-called climate “denialists” in her most recent article. Unfortunately Goode made the fatal journalistic error of failing to keep a healthy distance from the alarmist side and as a result was blinded from seeing the glaring mountain of scientific research showing polar bears are in fact doing fine.
Dr. Willie Soon is an independent solar physicist at the Harvard-Smithsonian Center for Astrophysics who has been studying the Sun and its influence on the Earth’s climate for more than a quarter of a century. A short while ago, he had a conversation with Mr. Grégoire Canlorbe, an independent journalist who is also vice president of the French Parti National-Libéral (“National-Liberal Party,” conservative, nationalist, and free-marketist). Here Dr. Soon speaks for himself.
Canlorbe: You say polar bears are far less endangered by global warming than by environmentalists dreading ice melt. Could you expand?
Just to demonstrate that the American Association of Petroleum Geologists (AAPG) maintains an open mind about things, I thought I would share an recent AAPG Explorerarticle on the notion of establishing a formal geological epoch in honor of human beings…
(…)
I genuinely believe that these folks simply can’t grasp the concept of resolution. This is a pervasive problem in the climate “science” community and will continued to feed claims of “unprecedented” changes in [fill in the blank] until we have about 1,000 years of high resolution instrumental data.
Our resident solar physicist, Dr. Leif Svalgaard commented and provided a link to something reported by his colleagues, something that likely would not have been possible without the fantastic solar observations of NASA’s Solar Dynamic Observeratory (SDO).
It seems a small sunspot has been observed, that has the opposite polarity of cycle 24 sunspots.
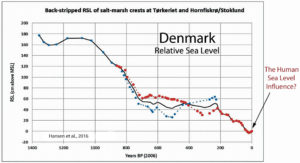
More than 70 recent scientific publications show that there is absolutely nothing unusual about the magnitude and rapidity of today’s sea level changes. These academically peer-reviewed papers show that sea levels were on average 2 meters higher earlier in the Holocene than they are today.
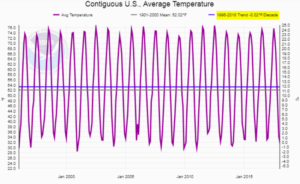
The chart above was produced by NOAA at their ‘Climate at a Glance’ web page. In the upper right corner of the chart, NOAA shows its calculated per decade trend of -0.02°F for a period that spans 1996-2018.
After posting this chart and an accompanying article, it just seemed that something was likely wrong with the trend calculation produced by NOAA’s web site.
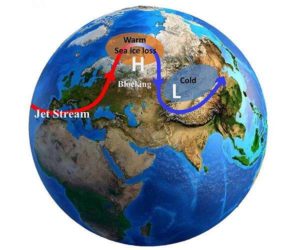
Yesterday’s “The Day After Tomorrow” climate explainer’s excuse for cold winters is back – research suggests that the North Atlantic current is weaker than anytime for the last 1000 years (…)
Right now, the sun is a cueball, as seen below in this image today from the Solar Dynamics Observatory (SDO) and has been without sunspots for 10 days. So far in 2018, 61% of days have been without sunspots (…)
Presenting this week (Monday 9 April 2018) at the European Geosciences Union (EGU) meeting in Vienna, an international team, led by British Antarctic Survey, describes how analysis of 79 ice cores collected from across Antarctica reveals a 10% increase in snowfall over the last 200 years. This is equivalent to 272 giga tonnes of water – double the volume of the Dead Sea.
Lead author and ice core scientist Dr Liz Thomas from British Antarctic Survey explains: (…)
Canada’s stable-to-increasing polar bear population extends its range slightly further south of the 55th parallel (York et al., 2016).
According to published geological evidence from the 1950s, remnants of wine grape vineyards have been unearthed in regions as far north as the polar-bear-inhabiting 55th parallel during the Medieval Warm Period (~800s to 1300s AD).
Monitoring temperature and creating regional and global temperature data sets is a tricky business. There are many factors that can induce spurious trends in the data; and there are multiple protocols to follow to ensure their proper construction. Consequently, many people (including scientists) have found themselves wondering which of all the temperature data sets is the most accurate for use in determining the impact of rising greenhouses gases on atmospheric temperature? Thanks to the recently published work of Christy et al. (2018), we now have a pretty good idea as to the answer.
Climate models play a central role in the attribution of global warming or climate change to human causes. The standard argument takes the following form: “We can get the model to do X, using human causes, but not without them, so human causes must be the cause of X.” A little digging reveals that this is actually a circular argument, because the models are set up in such a way that human causes are the only way to get change.
The finding is that humans are the cause of global warming and climate change is actually the assumption going in. This is circular reasoning personified, namely conclude what you first assume.
Polar bear specialists made global population numbers the focus of the world’s attention when they predicted a dramatic decline and possible extinction of the species.
But now that the numbers have increased slightly rather than declined, the same scientists say global numbers are meaningless: the public should give those figures no credence and anyone who cites global population numbers should be mocked.
CLAIM: “There isn’t any warming. All they’ve got is computer model predictions, folks. There isn’t yet any empirical evidence for their claim that greenhouse gases even cause temperatures to increase. There isn’t any empirical data for that.”
By Dr. Sebastian Lüning and Prof. Fritz Vahrenholt
(German text translated by P Gosselin)
Newspapers like to write about heat and melt records in the Arctic, which supposedly had never happened before. That really sparks fear among the citizens. However an examination of the facts regularly brings amazing things to light, for example weather records from a German station on Spitzbergen during World War 2 for the period of 1944-1945.
In the journal International Journal of Climatology Rajmund Przybylak and his colleagues evaluated the data. Summary: Back then it was similarly warm as it is today
by P. Homewood, April 8, 2018 in NotaLotofPeopleKnowThat
Bit by bit, some reality appears to be intruding into the make believe world of the Climate Change Act:
No credible scenario’ exists for hitting the UK’s 2050 decarbonisation targets without continued reliance on gas, the National Grid has warned.
In a new report, entitled The Future of Gas: How gas can support a low carbon future’, the grid says that it is not feasible to switch over to electric heating on the scale required to reduce greenhouse gas emissions to 80 per cent of 1990 levels by the middle of this century.
The addition of an esteemed Norwegian climate scientist to the London-based GWPF will help bring some sobriety back to a science that has all too often been immersed in alarmism.
The London-based Global Warming Policy Foundation (GWPF) recently announced Professor Ole Humlum of Norway was joining its Academic Advisory Council.
This brings another persuasive voice to the influential think tank.
According to its author Marc Morano, people have been snatching them up and a third printing has started. The book even made the Amazon top 100 best selling books for awhile.
It also ranked first in a number of categories. In his book, NoTricksZone gets mentioned 4 times and even took up one full page at one spot!
Weather Satellite Wanders Through Time, Space, Causing Stray Warming to Contaminate Data
In the late 1990s, the NOAA-14 weather satellite went wandering through time and space, apparently changing the record of Earth’s climate as it went.
Designed for an orbit synchronized with the sun, NOAA-14’s orbit from pole to pole was supposed to cross the equator at 1:30 p.m. on the sunlit side of the globe and at 1:30 a.m. on the dark side, 14 times each day. One of the instruments it carried was a microwave sounding unit (MSU), which looked down at the world and collected data on temperatures in Earth’s atmosphere and how those temperatures changed through time.
La géologie, une science plus que passionnante … et diverse