
by Hokkaido University, Nov 12, 2020 in EurekaAlert
Computational models suggest that melting water originating in the deep interior of Greenland could flow the entire length of a subglacial valley and exit at Petermann Fjord, along the northern coast of the island. Updating ice sheet models with this open valley could provide additional insight for future climate change predictions.
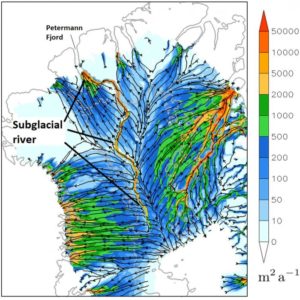
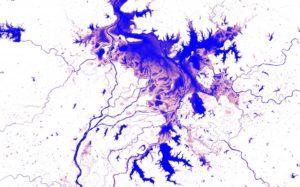
IMAGE: THE SUGGESTED VALLEY AND POSSIBLE RIVER FLOWING FROM THE DEEP INTERIOR OF GREENLAND TO PETERMANN FJORD DEEP BELOW GREENLAND’S ICE SHEET (500 METERS BELOW SEA LEVEL). (CHRISTOPHER CHAMBERS ET AL,… view more
CREDIT: CHRISTOPHER CHAMBERS ET AL, THE CRYOSPHERE, NOVEMBER 12, 2020.
Radar surveys have previously mapped Greenland’s bedrock buried beneath two to three thousand meters of ice. Mathematical models were used to fill in the gaps in survey data and infer bedrock depths. The surveys revealed the long valley, but suggested it was segmented, preventing water from flowing freely through it. However, the peaks breaking the valley into segments only show up in areas where the mathematical modelling was used to fill in missing data, so could not be real.
Christopher Chambers and Ralf Greve, scientists at Hokkaido University’s Institute of Low Temperature Science, wanted to explore what might happen if the valley is open and melting increases at an area deep in Greenland’s interior known for melting. Collaborating with researchers at the University of Oslo, they ran numerous simulations to compare water dynamics in northern Greenland with and without valley segmentation.
The results, recently published in The Cryosphere, show a dramatic change in how water melting at the base of the ice sheet would flow, if the valley is indeed open. A distinct subglacial watercourse runs all the way from the melting site to Petermann Fjord, which is located more than 1,000 kilometers away on the northern coast of Greenland. The watercourse only appears when valley segmentation is removed; there are no other major changes to the landscape or water dynamics.
“The results are consistent with a long subglacial river,” Chambers says, “but considerable uncertainty remains. For example, we don’t know how much water, if any, is available to flow along the valley, and if it does indeed exit at Petermann Fjord or is refrozen, or escapes the valley, along the way.”
If water is flowing, the model suggests it could traverse the whole length of the valley because the valley is relatively flat, similar to a riverbed. This suggests no parts of the ice sheet form a physical blockade. The simulations also suggested that there was more water flow towards the fjord with a level valley base set at 500 meters below sea level than when set at 100 meters below. In addition, when melting is increased only in the deep interior at a known region of basal melting, the simulated discharge is increased down the entire length of the valley only when the valley is unblocked. This suggests that a quite finely tuned relationship between the valley form and overlying ice can allow a very long down-valley water pathway to develop.
“Additional radar surveys are needed to confirm the simulations are accurate,” says Greve, who has been developing the model used in the study, called Simulation Code for Polythermal Ice Sheets (SICOPOLIS). “This could introduce a fundamentally different hydrological system for the Greenland ice sheet. The correct simulation of such a long subglacial hydrological system could be important for accurate future ice sheet simulations under a changing climate.”


