There have been recent discussions about ‘flattening the curve’ and some curves are easier to flatten than others. The Pages 2K Consortium calculates global mean temperature in a manner that flattens the long-term trend and makes present day temperatures appear warmer relative to past temperatures. Across the globe, temperature reconstructions show cooling millennial temperature trends with one exception, the Pages 2K global mean.
Millennial Temperature Trends Show Global Cooling
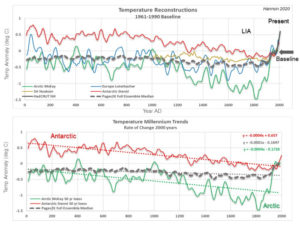
Global mean surface temperature anomalies were recently calculated by the Pages 2K Consortium led by Nuekom, 2019. Their statistical means are a conglomeration of seven different averaging methods for 7000 proxy records over the past 2000 years. The median across all global mean methods is plotted as a dashed line in Figure 1 and compared to Pages 2K’s published regional reconstructions. All means demonstrate similar trends as the median and will be simply be referred to as the global mean(s).
Regional temperature reconstructions are chosen that utilize similar proxy datasets used in the global mean calculation. The Arctic reconstruction by McKay incorporates a balance of proxy records consisting of ice cores, tree rings, lake and marine sediments north of 60 deg N. The Northern Hemisphere (NH) European reconstruction by Luterbacher is tree ring proxy based. And Stenni’s Antarctic reconstruction uses predominantly ice core isotopes.
The Pages 2K global mean appears to be reasonable compared to regional reconstructions from Present through the Little Ice Age (LIA) until about 1250 AD. Although it is difficult to see how the mean compares to regional reconstructions during the Present when using a 1961-1990 baseline as all reconstructions converge creating the “hockey stick” effect. Pre-1250 AD, the global mean appears to parallel NH Europe temperatures largely ignoring the Antarctic.
Figure 1: Top graph are surface temperature reconstructions with a 50-year loess filter plotted with Pages 2K global mean of the 7000-member ensemble across all methods. Bottom graph shows linear trends over the past 2000 years.
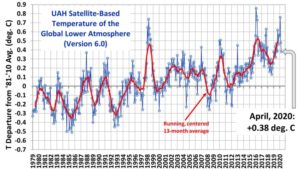
The Temperature of the Global Lower Atmosphere plunged 0.38C through March and April, halving its February above baseline high of 0.76C to 0.38C — the second-largest two-month drop in the UAH temperature dataset.
The largest two month drop remains the 0.69C observed back in 1987. And note how the global average temperature back in 1987 –before both the drop AND the inception of the global warming scare— is EXACTLY the same as it is now:
A continuation of this sharp downward plunge (seen in March and April, 2020) is highly probable over the coming months (with the odd bump on the way), and we can now consider a reading below baseline by the end of the year “likely”.
For a more in-depth look at the data check out this video from the Oppenheimer Ranch Project:
The northern hemisphere surface temperature was expected to drop substantiallyaccording to NCEP, but this of course will not keep global warming alarmists from sounding the warming alarms.
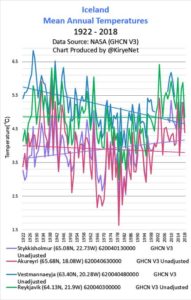
But a look at the unadjusted data from some rural US stations tells us that there has been no warming.
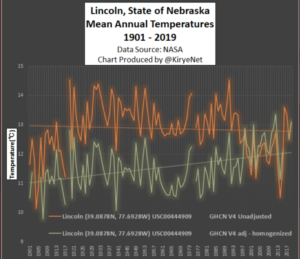
Today we look at temperature data from NASA of some stations along the northern US with a Brightness Index (BI) of 0, meaning rural locations with no urban heat island effects. We want to see the trend over the past 100 or so years.
Plotted are the USHCN Version 4 versus Version 4 adjusted.
The first plots are the data from Lincoln, Nebraska going back to 1901:
Note how a modest cooling trend was changed to a warming trend. Very ealy temperatures were cooled by 2°C!
Next we move to the Livingston, Montana station, where here as well a modest cooling trend was transformed into warming by massively adjusting past temperatures downward also by more than 2°C:
The whole thing is nothing but pure propaganda. It most certainly is not factual, nor does it explain to kids the real implications of the policies proposed by the likes of Greta.
Indeed, the suggestions of “how we can help” are infantile and risk making children think think that is all they need to do.
They may be seven year olds, but they should be treated with more respect and honesty.
I don’t know who produced this presentation or if it is officially approved. If anyone has any more info, please let me know.
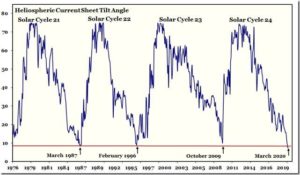
The heliospheric current sheet has flattened meaning that Solar Cycle 24 is over and we are now in Solar Cycle 25.
Figure 1: Heliospheric current sheet tilt angle 1976 -2020
The solar cycle isn’t over until the heliospheric current sheet has flattened. The data is provided by the Wilcox Solar Observatory at Stanford University. There were no observations from about 19 December to 5 February; so the values in between have been interpolated from the rotations before and after.
Victoria Falls, located at the border of Zambia and Zimbabwe on the Zambezi River, is not only one of the seven wonders of the world and classified as the biggest waterfall in the world, but it is also a tourist destination that allows the economies of both African countries to thrive.
The Kololo tribe, which resided in the area in the 1800s, named the falls “Mosi-oa-Tunya,” meaning “the smoke that thunders.” Both the indigenous name and the name Victoria Falls, given by Scottish explorer David Livingstone, are recognized officially.
AccuWeather Senior Meteorologist Jim Andrews said the climate of the upper Zambezi River watershed is tropical, seasonal and continental, with “sharply distinct” wet and dry seasons.
by M. McCrae, April 21, 2020 in ClimateChangeDispatch
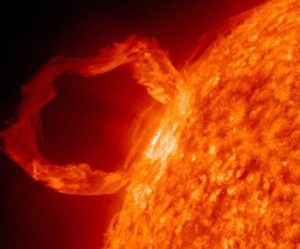
Our planet is constantly bathed in the winds coming off the blistering sphere at the center of our Solar System.
But even though the Sun itself is so ridiculously hot, once the solar winds reach Earth, they are hotter than they should be – and we might finally know why.
We know that particles making up the plasma of the Sun’s heliosphere cool as they spread out. The problem is that they seem to take their sweet time doing so, dropping in temperature far slower than models predict.
“People have been studying the solar wind since its discovery in 1959, but there are many important properties of this plasma which are still not well understood,” says physicist Stas Boldyrev from the University of Wisconsin–Madison.
“Initially, researchers thought the solar wind has to cool down very rapidly as it expands from the Sun, but satellite measurements show that as it reaches the Earth, its temperature is 10 times larger than expected.”
The research team used laboratory equipment to study moving plasma, and now think the answer to the problem lies in a trapped sea of electrons that just can’t seem to escape the Sun’s grip.
The expansion process itself has long been assumed to be subject to adiabatic laws, a term that simply means heat energy isn’t added or removed from a system.
This keeps the numbers nice and simple but assumes there aren’t places where energy slips in or out of the flow of particles.
Unfortunately, an electron’s journey is anything but simple, shoved around at the mercy of vast magnetic fields like a roller coaster from Hell. This chaos leaves plenty of opportunities for heat to be passed back and forth.
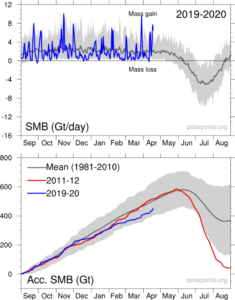
Despite decades of doom-and-gloom prophecies, Greenland’s Ice Sheet is currently GAINING monster amounts of “mass” — 27 gigatons over the past 5 days alone (April 14 – 18, 2020).
Crucial to the survival of a glacier is its surface mass balance (SMB)–the difference between accumulation and ablation (sublimation and melting). Changes in mass balance control a glacier’s long-term behavior, and are its most sensitive climate indicators (wikipedia.org).
On the back of substantial SMB gains over the past few years, the Greenland ice sheet looks set to continue that trend in 2019-20. From April 14 through April 18, 2020, the world’s largest island added a monster 27+ gigatons to its ice sheet. According to climate alarmists, this simply shouldn’t be happening in a warming world. In fact, it might as well not be happening as developments like these NEVER receive MSM attention, meaning alarmists are NEVER privy to the full and unalarming picture…
by P. Homewood, April 16, 2020 In NotaLotofPeopleKnowThat
London, 16 April: The floods that affected northern England in the autumn of 2019 were nothing out of the ordinary. That’s according to a new review of the UK’s 2019 weather.
Author Paul Homewood says that although rainfall in the region was high, it has been exceeded several times in the past, right back to the 19th century.
…
Key findings
* After a rising trend between the 1980s and early 2000s, temperature trends have stabilised in the UK.
* Heatwaves are not becoming more intense, but extremely cold weather has become much less common.
* There is little in the way of long-term trends in rainfall in England and Wales.
* Sea-level rise around British coasts is not accelerating.
by V. Richardson, April 15, 2020 in ClimateChangeDispatch
Nothing sends climate skeptics into orbit faster than seeing NASA repeat the 97% climate-consensus claim, but the effort to have the Obama-era declaration removed from the government website is suffering from a failure to launch.
NASA officials rejected the Competitive Enterprise Institute’s July 9 request for correction under the Information Quality Act, concluding that “changes to the Web site are not needed at this time,” prompting the free-market group to file an appeal Tuesday.
On its Global Climate Change page, NASA states: “Multiple studies published in peer-reviewed scientific journals show that 97 percent or more of actively publishing climate scientists agree: Climate-warming trends over the past century are extremely likely due to human activities.”
CEI attorney Devin Watkins, who called the statement “inaccurate, unreliable, and biased,” said that NASA has refused to budge even though President Trump has expressed reservations about the consensus argument on anthropogenic global warming.
In 2017, for example, Mr. Trump told The Associated that “you have scientists on both sides of the picture.”
“It’s really weird when the President of the United States seems to say the 97% figure is incorrect, but an agency he is responsible for overseeing continues to say on their website that the President is wrong,” Mr. Watkins said in an email.
In her reply to the CEI, NASA chief information officer Renee P. Wynn said that the Global Climate Change website “presents the state of scientific knowledge about climate change and honors the role that NASA has played and plays in researching and communicating climate science.”
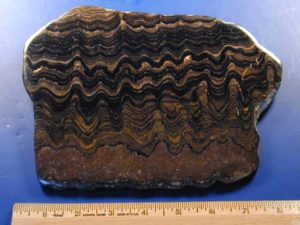
Evidence is steadily mounting that Mars could have supported life in the past and there are tantalizing indications that the Red Planet might still support be microscopic organisms. So, unlike the Face on Mars and impact craters circled up on satellite images, there is reason to believe that geologic features resembling stromatolites, might actually be something like stromatolites… But, we can’t possibly know until astronauts bring Martian sedimentary rocks back home to Earth.
…
Stromatolites
Lower Proterozic (2.3 billion)
Eastern Andies South of Cochabamba, District of Cochabamba, Bolivia, South America Fossil Museum Dot Net
by Clarke H. et al., April 3, 2020 in FrontierInEarthScience
Variations in global patterns of burning and fire regimes are relatively well measured, however, the degree of influence of the complex suite of biophysical and human drivers of fire remains controversial and incompletely understood. Such an understanding is required in order to support current fire management and to predict the future trajectory of global fire patterns in response to changes in these determinants. In this study we explore and compare the effects of four fundamental controls on fire, namely the production of biomass, its drying, the influence of weather on the spread of fire and sources of ignition. Our study area is southern Australia, where fire is currently limited by either fuel production or fuel dryness. As in most fire-prone environments, the majority of annual burned area is due to a relatively small number of large fires. We train and test an Artificial Neural Network’s ability to predict spatial patterns in the probability of large fires (>1,250 ha) in forests and grasslands as a function of proxies of the four major controls on fire activity. Fuel load is represented by predicted forested biomass and remotely sensed grass biomass, drying is represented by fraction of the time monthly potential evapotranspiration exceeds precipitation, weather is represented by the frequency of severe fire weather conditions and ignitions are represented by the average annual density of reported ignitions. The response of fire to these drivers is often non-linear. Our results suggest that fuel management will have limited capacity to alter future fire occurrence unless it yields landscape-scale changes in fuel amount, and that shifts between, rather than within, vegetation community types may be more important. We also find that increased frequency of severe fire weather could increase the likelihood of large fires in forests but decrease it in grasslands. These results have the potential to support long-term strategic planning and risk assessment by fire management agencies.
NASA and other government agencies keep telling us that the globe is warming and ice becoming more rare, yet when look out the window, things often appear to be going the opposite direction.
Rare cold, snow grip Greece
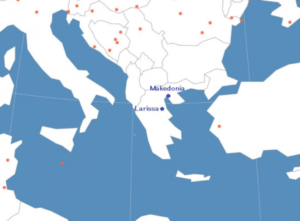
For example, the Greek Reporter here informed how a “rare spring snow” blanketed large parts of northern Greece. It reported: “Of course, Northern Greece is used to low temperatures and snow, but even for their standards, such an intense snowfall in April is rare.”
Moreover, the widely read Electroverse weather site here reported how southeast Europe had seen its “coldest April morning in a decade”, potentially causing widespread crop damage.
So why are such events happening when they aren’t supposed to be?
Altering: from cooling to warming
Today we look at the NASA data from two stations in Greece: Makedonia and Larissa, shown below:
Exactly one year ago yesterday, I was getting off a train in Proserpine, looking to pickup a hire car to drive to Bowen. I wanted to know if the coral there was all dead, or not. Bowen is a coastal town in North Queensland, not far from Abbott Point that is the coal terminal for the controversial Adani coal mine.
Judge Salvador Vasta had earlier that week handed down his findings regarding the sacking of Peter Ridd. He had exonerated Ridd and explained that James Cook University had wrongly sacked him.
Some claim that it all came to a sorry end for Ridd because he dared to question the consensus of scientific opinion concerning the health of the Great Barrier Reef – particularly the impact of global warming. The university claimed it was because he had become ‘un-collegial’ and did not follow various directives while disclosing confidential information.
These issues were argued in the Federal Circuit Court in Brisbane a month earlier, in March 2019. Very few people realized that at the heart of the case were a couple of what might be best described as fake-news photographs promoted by Terry Hughes.
This is the same Terry Hughes who is now claiming that 60%* of the Great Barrier Reef has been bleached, and that this is an extraordinary catastrophe for which we should all be ashamed.
If Peter Ridd had become un-collegial and disclosed confidential information, it was because he was fed-up with the fake news. As Ridd wrote in chapter 1 of the book that I edited three years ago, a chapter entitled ‘The Extraordinary Resilience of Great Barrier Reef Corals, and Problems with Policy Science’:
Atmospheric black carbon (BC) or soot — formed by the incomplete combustion of fossil fuels, biofuel and biomass — causes warming by absorbing sunlight and enhancing the direct radiative forcing of the climate. As BC ages, it is coated with material due to gas condensation and collisions with other particles. These processes lead to variation in the composition of BC-containing particles and in the arrangement of their internal components — a mixture of BC and other material — though global climate models do not fully account for these heterogeneities. Instead, BC-containing particles are typically modelled as uniformly coated spheres with identical aerosol composition, and these simplifications lead to overestimated absorption.
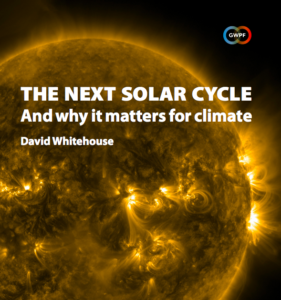
London, 6 April: A former BBC science correspondent says that there remains a real possibility that unusual solar behaviour could influence the Earth’s climate, bringing cooler temperatures for the next decade.
Despite rising levels of atmospheric carbon dioxide, the reduction in solar activity along with cooling from other long-term terrestrial climate variables could mean we might see a slowdown in global warming for years.
Dr Whitehouse says: “It is clear that the solar influence on climate is about 0.1 °C a decade so it is important to know when there are low solar activity periods. We have a grasp of the basic mechanism that drives long-term solar activity, but many of the specifics still elude us. Successful predictions of solar cycle strength are therefore few and far between.”
Whitehouse adds that although NASA are predicting that solar cycle 25, which is just beginning, might be moderate-to-weak, the possibility of a very weak cycle, with a measurable effect on the terrestrial climate, remains a real one.
Dr Whitehouse reviews the history of solar cycle predictions in a new paper by the Global Warming Policy Foundation which is published today.
But then NASA adjusted the V3 data and called it GHCN V4 “unadjusted”. The chart shown above in my tweet toggles between the prior V3 chart and the “unadjusted” V4. See the difference?
Note how the lack of warming has been removed and now the V4 data show modest warming. The missing heat was found – in the statistics! So in a sense, global warming has been “man-made” – done through statistical fudging and not human activity.
The COP26 UN climate change conference set to take place in Glasgow in November has been postponed due to COVID-19.
This decision has been taken by the COP Bureau of the UNFCCC (United Nations Framework Convention on Climate Change), with the UK and its Italian partners.
Dates for a rescheduled conference in 2021, hosted in Glasgow by the UK in partnership with Italy, will be set out in due course following further discussion with parties.
In light of the ongoing, worldwide effects of COVID-19, holding an ambitious, inclusive COP26 in November 2020 is no longer possible.
Rescheduling will ensure all parties can focus on the issues to be discussed at this vital conference and allow more time for the necessary preparations to take place. We will continue to work with all involved to increase climate ambition, build resilience and lower emissions.
A container ship leaves a trail of white clouds in its wake that can linger in the air for hours. This puffy line is not just exhaust from the engine, but a change in the clouds that’s caused by small airborne particles of pollution.
New research led by the University of Washington is the first to measure this phenomenon’s effect over years and at a regional scale. Satellite data over a shipping lane in the south Atlantic show that the ships modify clouds to block an additional 2 Watts of solar energy, on average, from reaching each square meter of ocean surface near the shipping lane.
The result implies that globally, cloud changes caused by particles from all forms of industrial pollution block 1 Watt of solar energy per square meter of Earth’s surface, masking almost a third of the present-day warming from greenhouse gases. The open-access study was published March 24 in AGU Advances, a journal of the American Geophysical Union.
CATASTROPHIC GLOBAL WARMING IS A FALSE CRISIS – THE NEXT GREAT EXTINCTION WILL BE GLOBAL COOLING
Forget all those falsehoods about scary global warming, deceptions contrived by wolves to stampede the sheep. The next great extinction event will not be global warming, it will be global cooling. Future extinction events are preponderantly cold: a glacial period, medium-size asteroid strike or supervolcano. Humanity barely survived the last glacial period that ended only 11,500 years ago, the blink-of–an-eye in geologic time.
Cold, not heat, is by far the greater killer of humanity. Today, cool and cold weather kills about 20 times as many people as warm and hot weather. Excess Winter Deaths, defined as more deaths in the four winter months than equivalent non-winter months, total over two million souls per year, in both cold and warm climates. Earth is colder-than-optimum for humanity, and currently-observed moderate global warming increases life spans.
“Cold Weather Kills 20 Times As Many People As Hot Weather”
By Joseph D’Aleo and Allan MacRae, September 4, 2015
However, Excess Winter Deaths are not the worst threats to humanity. The glacial cycle averages about 100,000 years, consisting of about 90,000 years of the glacial period, when mile-thick continental glaciers blanketed much of the Northern and Southern Hemispheres including Canada, Russia, Northern Europe and Northern USA, and about 10,000 years of interglacial, the warm period of the present. Earth is now 11,500 years into the current warm interglacial, and our planet may re-enter the glacial period at any time.
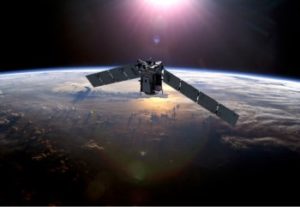
Today (Monday, March 30) is the 30th anniversary of our publication in Science describing the first satellite-based dataset for climate monitoring.
While much has happened in the last 30 years, I thought it might be interesting for people to know what led up to the dataset’s development, and some of the politics and behind-the-scenes happenings in the early days. What follows is in approximate chronological order, and is admittedly from my own perspective. John Christy might have somewhat different recollections of these events.
Some of what follows might surprise you, some of it is humorous, and I also wanted to give credit to some of the other players. Without their help, influence, and foresight, the satellite temperature dataset might never have been developed.
OPINION. Il semble morbide et cynique, alors que des milliers de personnes meurent du Coronavirus, d’insister en ce moment sur l’impérieuse nécessité d’agir contre le changement climatique. Pourtant, des idéologues, qui sont aussi et surtout ceux de la remise en cause de l’économie de marché, osent le faire. Ils ne ratent aucune occasion d’essayer de faire croire que le changement climatique cause ou exacerbe cette crise. Il est nécessaire de les dénoncer pour préparer l’avenir. Par Samuel Furfari, Professeur à l’Université Libre de Bruxelles et Président de la Société Européenne des Ingénieurs et Industriels.
Un climatologue français semble regretter que « ce qu’on fait pour le Coronavirus, c’est deux ans de financement climat » car, d’après lui, si on dépense de l’argent pour sauver des vies, on pourrait tout aussi bien redoubler d’effort pour sauver la planète. Un climatologue belge a eu l’outrecuidance de tweeter à la Première ministre belge et à son vice-Premier ministre en charge du budget qu’ils profitent de cette crise pour introduire une taxe sur l’énergie : « #Covid_19 : C’est le bon moment pour instaurer une vraie taxe CO2 sur les carburants, le mazout [fioul en Belgique] et le gaz fossile. Leur prix ayant fortement baissé, ce sera indolore. Cela permettra de dégager des ressources pour compenser les effets de la crise. » Sur Facebook, ce membre éminent du GIEC s’est fait traiter de « charognard », entre autres épithètes. En pleine crise, « presque hilare », un commentateur politique bien connu a apprécié que ce « virus révolutionnaire » empêchait la privatisation des aéroports de Paris et s’en est pris aux « banques mondiales [qui] échouent lamentablement face à la crise climatique en injectant des billions dans les combustibles fossiles».
by P. Homewood, March 24, 2020 in NotaLotofPeopleKnowThat
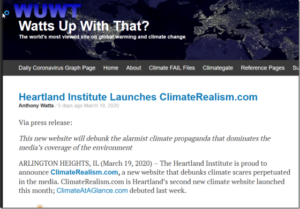
WUWT has news of a new website launched by the Heartland Institute, to augment the excellent factchecking site, Climate At A Glance:
Nearly every day, the establishment media promotes new climate propaganda themes designed to scare people into believing a climate crisis is at hand. When the Climate Scare goes unrebutted, people are likely to believe by default that the propaganda is true. Yet most of the media’s climate propaganda is misleading or outright false. ClimateRealism.com will address and debunk the media’s most prominent climate-related tall tales.
One of the things I love about writing for Watts Up With That, is the fact that reader comments often inspire me to research and write subsequent posts. In my recent post about the origins of the Moon, one commentator suggested that the rate of lunar recession (tidal acceleration) indicated that the Earth was much younger than 4.5 billion years old and/or somehow disproved the geological Principle of Uniformitarianism. I didn’t give much thought to my reply. I simply calculated the distance from the Earth to the Moon 1 billion and 4.5 billion years ago. The Moon is currently receding (moving away) from the Earth at a rate of about 3.8 cm/yr. This has been directly measured with lasers.
At 3.8 cm/yr, the Moon would have been 215,288 miles away from Earth a billion years ago. It is currently an average of 238,900 miles away. At 3.8 cm/yr, it still would have been 132,646 miles away 4.5 BY.
If the Moon did did originate from a collision with Earth, it would have been a lot closer to Earth 4.5 BY than 100,000 miles.
…
…
La géologie, une science plus que passionnante … et diverse


