Today, the region north of Svalbard is encrusted with sea ice for all but a few weeks per year and summer sea surface temperatures (SSTs) hover near 0°C. Scientists (Brice et al., 2020) have determined this same region had sea ice-free conditions last about 10 months per year while SSTs reached 4°C just ~4100 years ago.
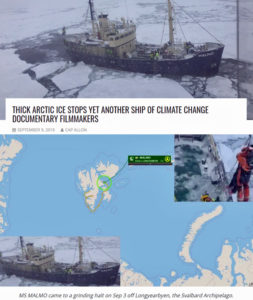
In early September, 2019, Arctic explorers once again needed to be rescued from the “disappearing” sea ice that had captured their ship in central Svalbard. This region is presently free of sea ice for only a few weeks per year (late August).
According to preliminary data from the South African Weather Service, a total of 14 new all-time monthly LOW temperature records were busted yesterday (May 28), versus the 0 for record high.
These record low May temperatures were set ACROSS the southernmost tip of Africa, although the east appears to have been disproportionately hit.
The “II AGR” weather station in Buffelspoort –located NW of Johannesburg– set a new “Lowest Minimum” temperature on Thursday, May 28 of -2C (35.6F) — a reading which comfortably usurped the station’s previous all-time lowest May minimum of 0.9C (33.6F) set back on May 10, 1970.
Secunda –located amidst the coalfields of the Mpumalanga province– was another region to suffer its lowest May temperature on record. The town logged a bone-chilling -3.9C (25F) on Thursday morning, which surpassed the old record of -3.3C (26F) from May 29, 1994.
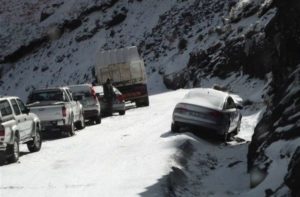
Exceptional snowfall has been accompanying the low temps.
“We’ve got ground-level snow in quite a few places,” said Richard le Sueur of SnowReportSA while on popular SA radio show CapeTalk on May 27.
“The front swept in from the west and has gone right across the country … We’ve had snow on the Western Cape mountains, the Southwestern Cape and through the Southern Cape and into the Eastern Cape … also, in Lesotho and the Northern Cape … So, pretty much widespread snow,” said le Sueur.
“We’re going to see a chilly winter,” he concluded.
by P. Homewood, May 27, 2020 in NotaLotofpeopleKnowThat
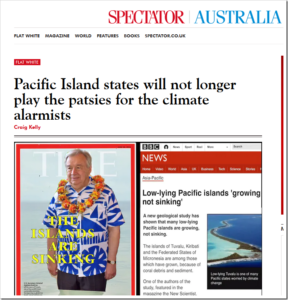
The science is settled. The time for debate is over. It’s actually better than we thought. The Pacific islands are not sinking under rising sea levels, in fact, the peer-reviewed science shows the exact opposite, the majority of low lying islands are either stable or increasing in size — something even ABC FactCheck was forced to concede.
Nevertheless, this has not stopped climate alarmists led by the Portuguese socialist and UN General Secretary Guterres from denying the peer-reviewed science and exploiting Pacific Island nations, by using them as patsies to peddle fear and misinformation with discredited claims of ”sinking islands”.
And so far, the Pacific islanders have been happy to play along; perhaps driven by a cargo-cult mentality, believing if they utter the magic words ”climate change” and pose for the international media forlornly staring out over the sea, that they might be rewarded with cash handouts from the UN Green Global Climate fund.
by P. Homewood, May 27, 2020 in NotaLotofPeopleKnowThat
YouTube has taken down the controversial Michael Moore-produced documentary, Planet of the Humans in response to a copyright infringement claim by a British environmental photographer.
The movie, which has been condemned as inaccurate and misleading by climate scientists and activists, allegedly includes a clip used without the permission of the owner Toby Smith, who does not approve of the context in which his material is being used.
In response, the filmmakers denied violating fair usage rules and accused their critics of politically motivated censorship.
Smith filed the complaint to YouTube on 23 May after discovering Planet of the Humans used several seconds of footage from his Rare Earthenware project detailing the journey of rare earth minerals from Inner Mongolia.
Smith, who has previously worked on energy and environmental issues, said he did not want his work associated with something he disagreed with. “I went directly to YouTube rather than approaching the filmmakers because I wasn’t interested in negotiation. I don’t support the documentary, I don’t agree with its message and I don’t like the misleading use of facts in its narrative.”
Planet of the Humans director Jeff Gibbs said he was working with YouTube to resolve the issue and have the film back up as soon as possible.
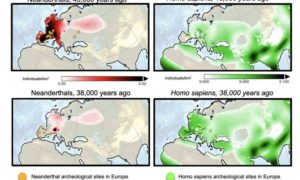
Climate scientists from the IBS Center for Climate Physics discover that, contrary to previously held beliefs, Neanderthal extinction was neither caused by abrupt glacial climate shifts, nor by interbreeding with Homo sapiens. According to new supercomputer model simulations, only competition between Neanderthals and Homo sapiens can explain the rapid demise of Neanderthals around 43 to 38 thousand years ago.
Neanderthals lived in Eurasia for at least 300,000 years. Then, around 43 to 38 thousand years ago they quickly disappeared off the face of the earth, leaving only weak genetic traces in present-day Homo sapiens populations. It is well established that their extinction coincided with a period of rapidly fluctuating climatic conditions, as well as with the arrival of Homo sapiens in Europe. However, determining which of these factors was the dominant cause, has remained one of the biggest challenges of evolutionary anthropology.
…
Figure 1: Computer simulations of population density of Neanderthals (left) and Homo sapiens (right)
UH researchers reveal largest and hottest shield volcano on Earth
Posted on May 13, 2020 by Marcie Grabowski
In a recently published study, researchers from the University of Hawai‘i at Mānoa School of Ocean and Earth Science and Technology revealed the largest and hottest shield volcano on Earth. A team of volcanologists and ocean explorers used several lines of evidence to determine Pūhāhonu, a volcano within the Papahānaumokuākea Marine National Monument, now holds this distinction.
Geoscientists and the public have long thought Mauna Loa, a culturally-significant and active shield volcano on the Big Island of Hawai‘i, was the largest volcano in the world. However, after surveying the ocean floor along the mostly submarine Hawaiian leeward volcano chain, chemically analyzing rocks in the UH Mānoa rock collection, and modeling the results of these studies, the research team came to a new conclusion. Pūhāhonu, meaning ‘turtle rising for breath’ in Hawaiian, is nearly twice as big as Mauna Loa.
“It has been proposed that hotspots that produce volcano chains like Hawai‘i undergo progressive cooling over 1-2 million years and then die,” said Michael Garcia, lead author of the study and retired professor of Earth Sciences at SOEST. “However, we have learned from this study that hotspots can undergo pulses of melt production. A small pulse created the Midway cluster of now extinct volcanoes and another, much bigger one created Pūhāhonu. This will rewrite the textbooks on how mantle plumes work.”
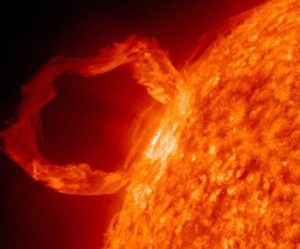
The lack of any sunspots suggests the current solar minimum is one of the ‘deepest’ in 100 years.
The sun has been reported to have a ‘very deep’ solar minimum with 100 days of 2020 not seeing any sunspots on its surface.
Astronomer Dr Tony Phillips says the current lack of sunspot counts suggests the current solar minimum is one of the ‘deepest’ of the past century.
A sunspot is an area of magnetic activity on the surface of the sun – also known as storms – and appear in areas of darkness. They play a huge part in the sun’s activity, including birthing solar flares and coronal mass ejections.
A solar minimum occurs when zero sunspots are spotted, but, before you start panicking and thinking this is a bad thing, solar minimums are all part of the sun’s cycle and occur every 11 years or so.
NASA first recorded no activity on the sun last summer and it is thought to have continued to be without sunspots ever since. Solar minimums usually consist of 12 months of little sunspot activity.
“The cause” of climate alarmism and forced energy transformation has been pushed backward by a very long overdue hard look at renewable energy as a mass substitute for mineral energies. Being dilute and intermittent, renewables have more bad secrets than any closet could hold. Small wonder; renewable energies chew up the earth’s surface and creatures in a way that leads to the joke:
Q. “When is an environmentalist not an environmentalist?” A. “When it comes to industrial wind turbines and solar farms.”
Moore’s Planet of the Humans all but ensures that DC-based Big Environmentalism will frontally reject biomass/biofuels, their loss-leader to try to prop up wind and solar as viable. Remove biomass from “green” portfolios and it gets a little skinnier for the business cronies.
And if Big Environmentalism loses wind, the supply-side ruse is over, and people will reconsider climate science given that the ‘cure’ is gone. Hence Michael Mann versus Michael Moore’s Planet of the Humans, the gist of Maxime Joselow’s “Michael Moore’s documentary irks climate scientists” (May 5, 2020).
Short summary: scientists sought political relevance and allowed policy makers to put a big thumb on the scale of the scientific assessment of the attribution of climate change.
The importance of this book is reflected in its acknowledgements, in context of assistance and contributions from early leaders and participants in the IPCC:
This book would not have been possible without the documents obtained via Mike MacCracken and John Zillman. Their abiding interest in a true and accurate presentation of the facts prevented my research from being led astray. Many of those who participated in the events here described gave generously of their time in responding to my enquiries, they include Ben Santer, Tim Barnett, Tom Wigley, John Houghton, Fred Singer, John Mitchell, Pat Michaels . . . and many more.
Read the whole book, it is well worth reading. The focus of my summary of the book is on Chapters 8-16 in context of the theme of ‘detection and attribution’, ‘policy cart in front of the scientific horse’ and ‘manufacturing consensus’. Annotated excerpts from the book are provided below.
The lightness of water vapor buffers climate warming in the tropics.
Conventional knowledge has it that warm air rises while cold air sinks. But a study from the University of California, Davis, found that in the tropical atmosphere, cold air rises due to an overlooked effect — the lightness of water vapor. This effect helps to stabilize tropical climates and buffer some of the impacts of a warming climate.
The study, published today (May 6, 2020) in the journal Science Advances, is among the first to show the profound implications water vapor buoyancy has on Earth’s climate and energy balance.
Abstract
Moist air is lighter than dry air at the same temperature, pressure, and volume because the molecular weight of water is less than that of dry air. We call this the vapor buoyancy effect. Although this effect is well documented, its impact on Earth’s climate has been overlooked. Here, we show that the lightness of water vapor helps to stabilize tropical climate by increasing the outgoing longwave radiation (OLR). In the tropical atmosphere, buoyancy is horizontally uniform. Then, the vapor buoyancy in the moist regions must be balanced by warmer temperatures in the dry regions of the tropical atmosphere. These higher temperatures increase tropical OLR. This radiative effect increases with warming, leading to a negative climate feedback. At a near present-day surface temperature, vapor buoyancy is responsible for a radiative effect of 1 W/m2 and a negative climate feedback of about 0.15 W/m2 per kelvin.
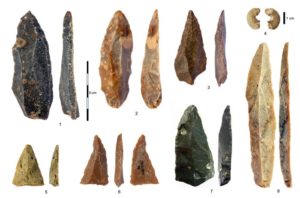
The oldest bones of Homo sapiens ever found in Europe have been discovered in a Bulgarian cave, providing the earliest known evidence of our species’ emergence in the European continent, according to new research.
The appearance and spread of modern humans in Europe is a difficult timeline for researchers to reconstruct, owing to a scarcity of sufficiently ancient remains that have been identified in the fossil record.
When modern humans did show up, though, our arrival ultimately sealed the fate of the indigenous Neanderthals who called Europe home before us, as we then proceeded to swiftly replace them over the course of the next several thousand years.
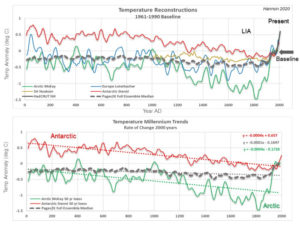
There have been recent discussions about ‘flattening the curve’ and some curves are easier to flatten than others. The Pages 2K Consortium calculates global mean temperature in a manner that flattens the long-term trend and makes present day temperatures appear warmer relative to past temperatures. Across the globe, temperature reconstructions show cooling millennial temperature trends with one exception, the Pages 2K global mean.
Millennial Temperature Trends Show Global Cooling
Global mean surface temperature anomalies were recently calculated by the Pages 2K Consortium led by Nuekom, 2019. Their statistical means are a conglomeration of seven different averaging methods for 7000 proxy records over the past 2000 years. The median across all global mean methods is plotted as a dashed line in Figure 1 and compared to Pages 2K’s published regional reconstructions. All means demonstrate similar trends as the median and will be simply be referred to as the global mean(s).
Regional temperature reconstructions are chosen that utilize similar proxy datasets used in the global mean calculation. The Arctic reconstruction by McKay incorporates a balance of proxy records consisting of ice cores, tree rings, lake and marine sediments north of 60 deg N. The Northern Hemisphere (NH) European reconstruction by Luterbacher is tree ring proxy based. And Stenni’s Antarctic reconstruction uses predominantly ice core isotopes.
The Pages 2K global mean appears to be reasonable compared to regional reconstructions from Present through the Little Ice Age (LIA) until about 1250 AD. Although it is difficult to see how the mean compares to regional reconstructions during the Present when using a 1961-1990 baseline as all reconstructions converge creating the “hockey stick” effect. Pre-1250 AD, the global mean appears to parallel NH Europe temperatures largely ignoring the Antarctic.
Figure 1: Top graph are surface temperature reconstructions with a 50-year loess filter plotted with Pages 2K global mean of the 7000-member ensemble across all methods. Bottom graph shows linear trends over the past 2000 years.
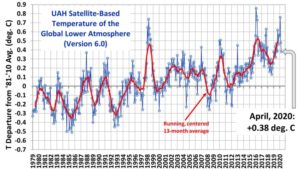
The Temperature of the Global Lower Atmosphere plunged 0.38C through March and April, halving its February above baseline high of 0.76C to 0.38C — the second-largest two-month drop in the UAH temperature dataset.
The largest two month drop remains the 0.69C observed back in 1987. And note how the global average temperature back in 1987 –before both the drop AND the inception of the global warming scare— is EXACTLY the same as it is now:
A continuation of this sharp downward plunge (seen in March and April, 2020) is highly probable over the coming months (with the odd bump on the way), and we can now consider a reading below baseline by the end of the year “likely”.
For a more in-depth look at the data check out this video from the Oppenheimer Ranch Project:
The northern hemisphere surface temperature was expected to drop substantiallyaccording to NCEP, but this of course will not keep global warming alarmists from sounding the warming alarms.
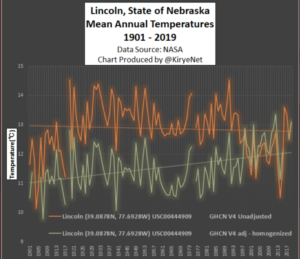
But a look at the unadjusted data from some rural US stations tells us that there has been no warming.
Today we look at temperature data from NASA of some stations along the northern US with a Brightness Index (BI) of 0, meaning rural locations with no urban heat island effects. We want to see the trend over the past 100 or so years.
Plotted are the USHCN Version 4 versus Version 4 adjusted.
The first plots are the data from Lincoln, Nebraska going back to 1901:
Note how a modest cooling trend was changed to a warming trend. Very ealy temperatures were cooled by 2°C!
Next we move to the Livingston, Montana station, where here as well a modest cooling trend was transformed into warming by massively adjusting past temperatures downward also by more than 2°C:
The whole thing is nothing but pure propaganda. It most certainly is not factual, nor does it explain to kids the real implications of the policies proposed by the likes of Greta.
Indeed, the suggestions of “how we can help” are infantile and risk making children think think that is all they need to do.
They may be seven year olds, but they should be treated with more respect and honesty.
I don’t know who produced this presentation or if it is officially approved. If anyone has any more info, please let me know.
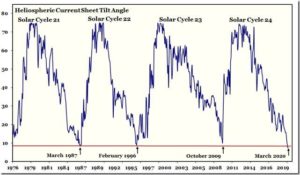
The heliospheric current sheet has flattened meaning that Solar Cycle 24 is over and we are now in Solar Cycle 25.
Figure 1: Heliospheric current sheet tilt angle 1976 -2020
The solar cycle isn’t over until the heliospheric current sheet has flattened. The data is provided by the Wilcox Solar Observatory at Stanford University. There were no observations from about 19 December to 5 February; so the values in between have been interpolated from the rotations before and after.
Victoria Falls, located at the border of Zambia and Zimbabwe on the Zambezi River, is not only one of the seven wonders of the world and classified as the biggest waterfall in the world, but it is also a tourist destination that allows the economies of both African countries to thrive.
The Kololo tribe, which resided in the area in the 1800s, named the falls “Mosi-oa-Tunya,” meaning “the smoke that thunders.” Both the indigenous name and the name Victoria Falls, given by Scottish explorer David Livingstone, are recognized officially.
AccuWeather Senior Meteorologist Jim Andrews said the climate of the upper Zambezi River watershed is tropical, seasonal and continental, with “sharply distinct” wet and dry seasons.
by M. McCrae, April 21, 2020 in ClimateChangeDispatch
Our planet is constantly bathed in the winds coming off the blistering sphere at the center of our Solar System.
But even though the Sun itself is so ridiculously hot, once the solar winds reach Earth, they are hotter than they should be – and we might finally know why.
We know that particles making up the plasma of the Sun’s heliosphere cool as they spread out. The problem is that they seem to take their sweet time doing so, dropping in temperature far slower than models predict.
“People have been studying the solar wind since its discovery in 1959, but there are many important properties of this plasma which are still not well understood,” says physicist Stas Boldyrev from the University of Wisconsin–Madison.
“Initially, researchers thought the solar wind has to cool down very rapidly as it expands from the Sun, but satellite measurements show that as it reaches the Earth, its temperature is 10 times larger than expected.”
The research team used laboratory equipment to study moving plasma, and now think the answer to the problem lies in a trapped sea of electrons that just can’t seem to escape the Sun’s grip.
The expansion process itself has long been assumed to be subject to adiabatic laws, a term that simply means heat energy isn’t added or removed from a system.
This keeps the numbers nice and simple but assumes there aren’t places where energy slips in or out of the flow of particles.
Unfortunately, an electron’s journey is anything but simple, shoved around at the mercy of vast magnetic fields like a roller coaster from Hell. This chaos leaves plenty of opportunities for heat to be passed back and forth.
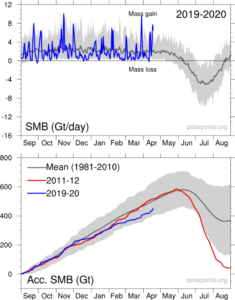
Despite decades of doom-and-gloom prophecies, Greenland’s Ice Sheet is currently GAINING monster amounts of “mass” — 27 gigatons over the past 5 days alone (April 14 – 18, 2020).
Crucial to the survival of a glacier is its surface mass balance (SMB)–the difference between accumulation and ablation (sublimation and melting). Changes in mass balance control a glacier’s long-term behavior, and are its most sensitive climate indicators (wikipedia.org).
On the back of substantial SMB gains over the past few years, the Greenland ice sheet looks set to continue that trend in 2019-20. From April 14 through April 18, 2020, the world’s largest island added a monster 27+ gigatons to its ice sheet. According to climate alarmists, this simply shouldn’t be happening in a warming world. In fact, it might as well not be happening as developments like these NEVER receive MSM attention, meaning alarmists are NEVER privy to the full and unalarming picture…
by P. Homewood, April 16, 2020 In NotaLotofPeopleKnowThat
London, 16 April: The floods that affected northern England in the autumn of 2019 were nothing out of the ordinary. That’s according to a new review of the UK’s 2019 weather.
Author Paul Homewood says that although rainfall in the region was high, it has been exceeded several times in the past, right back to the 19th century.
…
Key findings
* After a rising trend between the 1980s and early 2000s, temperature trends have stabilised in the UK.
* Heatwaves are not becoming more intense, but extremely cold weather has become much less common.
* There is little in the way of long-term trends in rainfall in England and Wales.
* Sea-level rise around British coasts is not accelerating.
by V. Richardson, April 15, 2020 in ClimateChangeDispatch
Nothing sends climate skeptics into orbit faster than seeing NASA repeat the 97% climate-consensus claim, but the effort to have the Obama-era declaration removed from the government website is suffering from a failure to launch.
NASA officials rejected the Competitive Enterprise Institute’s July 9 request for correction under the Information Quality Act, concluding that “changes to the Web site are not needed at this time,” prompting the free-market group to file an appeal Tuesday.
On its Global Climate Change page, NASA states: “Multiple studies published in peer-reviewed scientific journals show that 97 percent or more of actively publishing climate scientists agree: Climate-warming trends over the past century are extremely likely due to human activities.”
CEI attorney Devin Watkins, who called the statement “inaccurate, unreliable, and biased,” said that NASA has refused to budge even though President Trump has expressed reservations about the consensus argument on anthropogenic global warming.
In 2017, for example, Mr. Trump told The Associated that “you have scientists on both sides of the picture.”
“It’s really weird when the President of the United States seems to say the 97% figure is incorrect, but an agency he is responsible for overseeing continues to say on their website that the President is wrong,” Mr. Watkins said in an email.
In her reply to the CEI, NASA chief information officer Renee P. Wynn said that the Global Climate Change website “presents the state of scientific knowledge about climate change and honors the role that NASA has played and plays in researching and communicating climate science.”
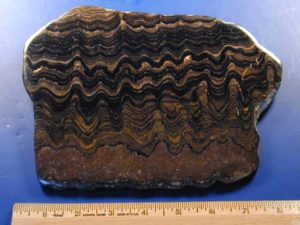
Evidence is steadily mounting that Mars could have supported life in the past and there are tantalizing indications that the Red Planet might still support be microscopic organisms. So, unlike the Face on Mars and impact craters circled up on satellite images, there is reason to believe that geologic features resembling stromatolites, might actually be something like stromatolites… But, we can’t possibly know until astronauts bring Martian sedimentary rocks back home to Earth.
…
Stromatolites
Lower Proterozic (2.3 billion)
Eastern Andies South of Cochabamba, District of Cochabamba, Bolivia, South America Fossil Museum Dot Net
by Clarke H. et al., April 3, 2020 in FrontierInEarthScience
Variations in global patterns of burning and fire regimes are relatively well measured, however, the degree of influence of the complex suite of biophysical and human drivers of fire remains controversial and incompletely understood. Such an understanding is required in order to support current fire management and to predict the future trajectory of global fire patterns in response to changes in these determinants. In this study we explore and compare the effects of four fundamental controls on fire, namely the production of biomass, its drying, the influence of weather on the spread of fire and sources of ignition. Our study area is southern Australia, where fire is currently limited by either fuel production or fuel dryness. As in most fire-prone environments, the majority of annual burned area is due to a relatively small number of large fires. We train and test an Artificial Neural Network’s ability to predict spatial patterns in the probability of large fires (>1,250 ha) in forests and grasslands as a function of proxies of the four major controls on fire activity. Fuel load is represented by predicted forested biomass and remotely sensed grass biomass, drying is represented by fraction of the time monthly potential evapotranspiration exceeds precipitation, weather is represented by the frequency of severe fire weather conditions and ignitions are represented by the average annual density of reported ignitions. The response of fire to these drivers is often non-linear. Our results suggest that fuel management will have limited capacity to alter future fire occurrence unless it yields landscape-scale changes in fuel amount, and that shifts between, rather than within, vegetation community types may be more important. We also find that increased frequency of severe fire weather could increase the likelihood of large fires in forests but decrease it in grasslands. These results have the potential to support long-term strategic planning and risk assessment by fire management agencies.
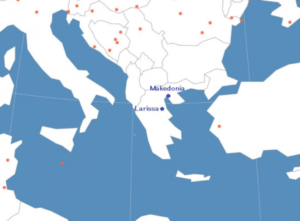
NASA and other government agencies keep telling us that the globe is warming and ice becoming more rare, yet when look out the window, things often appear to be going the opposite direction.
Rare cold, snow grip Greece
For example, the Greek Reporter here informed how a “rare spring snow” blanketed large parts of northern Greece. It reported: “Of course, Northern Greece is used to low temperatures and snow, but even for their standards, such an intense snowfall in April is rare.”
Moreover, the widely read Electroverse weather site here reported how southeast Europe had seen its “coldest April morning in a decade”, potentially causing widespread crop damage.
So why are such events happening when they aren’t supposed to be?
Altering: from cooling to warming
Today we look at the NASA data from two stations in Greece: Makedonia and Larissa, shown below:
…
La géologie, une science plus que passionnante … et diverse