Archives par mot-clé : Global Temperature

On Hens, Eggs, Temperatures and CO2: Causal Links in Earth’s Atmosphere

by D. Koutsoyiannis et al., Sept 2023 in MDPI/Springer


Abstract

The scientific and wider interest in the relationship between atmospheric temperature (T) and concentration of carbon dioxide ([CO2]) has been enormous. According to the commonly assumed causality link, increased [CO2] causes a rise in T. However, recent developments cast doubts on this assumption by showing that this relationship is of the hen-or-egg type, or even unidirectional but opposite in direction to the commonly assumed one. These developments include an advanced theoretical framework for testing causality based on the stochastic evaluation of a potentially causal link between two processes via the notion of the impulse response function. Using, on the one hand, this framework and further expanding it and, on the other hand, the longest available modern time series of globally averaged T and [CO2], we shed light on the potential causality between these two processes. All evidence resulting from the analyses suggests a unidirectional, potentially causal link with T as the cause and [CO2] as the effect. That link is not represented in climate models, whose outputs are also examined using the same framework, resulting in a link opposite the one found when the real measurements are used.

Graphical Abstract

Science is generated by and devoted to free inquiry: the idea that any hypothesis, no matter how strange, deserves to be considered on its merits. The suppression of uncomfortable ideas may be common in religion and politics, but it is not the path to knowledge; it has no place in the endeavor of science. We do not know in advance who will discover fundamental new insights.

While Media Obsess About Some Warmth, Globe Seeing Plenty Of Unusual Cold Events

by P. Gosselin, Nov 17, 2023 in WUWT


Surface temperatures measured where people live show there’s as much cold as there ‘s warmth, see temperature.global.com.

Christian Freuer’s Cold Report (EIKE)

and Electroverse.com

Snowpack extent in US reaches record levels!

America’s first Arctic air blast of the season broke hundreds of low temperature records and led to the largest snowpack extent there in early November in NOAA records.

A high snowpack blanketed the Rocky Mountains, northern Plains, Great Lakes and northern New England, resulting in 17.9% of the Lower 48 under a blanket of snow as the calendar turned to November – a new record in the books dating back to 2003.

Many places recorded their snowiest Halloweens ever.

At 22 inches, Muskegon, MI, not only recorded the snowiest Halloween ever, but also the snowiest October day and month. Glasgow, MT, recorded the snowiest start to the season with 36 inches.

The cold broke hundreds of low temperature records across the country, from Texas to Maine, dropping the average temperature in the Lower 48 to -0.5°C – more than 5 degrees Celsius below normal.

Historic November cold grips Argentina, Australia

A late cold spell has hit large parts of South America, especially Argentina. The country recorded the lowest November temperatures since records began.

A number of records for highs and lows have fallen. New lows include the 0.1°C at Córdoba Airport, which broke the record of 2°C set on November 4, 1992, the 1.6°C in Chamical, which broke the record of 4.5°C set on November 9, 2010, and the 2.8°C in Mendova, which beat the 3.2°C set in 1992.

New lows include Gualeguaychú’s 13.8°C, which broke the old record set in 1992, and Paraná’s 13.5°C, which beat the record set in 1936.

The cold was severe, up to 24 degrees Celsius below normal, and it was also widespread, affecting most of Argentina:

Terrestrial temperature, sea levels and ice area links with solar activity and solar orbital motion

by V. Zharkova & I. Vasilieeva, Nov 2023


Abstract: This paper explores the links between terrestrial temperature, sea levels and ice areas in both hemispheres with solar activity indices expressed through averaged sunspot numbers together with the summary curve of eigen vectors of the solar background magnetic field (SBMF) and with changes of Sun-Earth distances caused by solar inertial motion resulting from the gravitation of large planets in the solar system.

Using the wavelet analysis of the GLB  and HadCRUTS datasets two periods: 21.4  and 36 years in GLB, set   and the period of about 19.6 years  in the HadCRUTS are discovered. The 21.4 year period is associated with variations in solar activity defined by the summary curve of the largest eigen vectors of the SBMF. A dominant 21.4-year period is also reported in the variations of the sea level, which is linked with the period of 21.4 years detected in the GLB temperature and the summary curve of the SBMF variations.  The wavelet analysis  of ice and snow areas shows that  in the Southern hemisphere it does not show any links to solar activity periods while in the Northern hemisphere the ice area  reveals  a period of 10.7 years equal to a usual solar acitviity cycle.

The TSI in March-August of every year  is found  to grow with every year following closely the temperature curve, because the Sun moves  closer to the Earth orbit owing to gravitation of large planets. (solar inertial motion, SIM). While the variations of solar radiation during a whole year have  more steady distribution without  a sharp TSI increase  during the last two centuries. The additional TSI contribution caused by SIM is likely to secure the additional energy input and exchange between the ocean and atmosphere.


Link to pre-print:  https://solargsm.com/wp-content/uploads/2023/11/zharkova_tsi_nc_form_subm-1.pdf


The paper is accepted for publication.

To what extent are temperature levels changing due to greenhouse gas emissions?

by J.K. Dagsvik & S.H. Moen,  Nov  2023 in  StatisticsNorway


Abstract

Weather and temperatures vary in ways that are difficult to explain and predict precisely. In this article we review data on temperature variations in the past as well possible reasons for thesevariations. Subsequently, we review key properties of global climate models and statistical analyses conducted by others on the ability of the global climate models to track historical temperatures.

These tests show that standard climate models are rejected by time series data on global temperatures. Finally, we update and extend previous statistical analysis of temperature data
(Dagsvik et al., 2020). Using theoretical arguments and statistical tests we find, as in Dagsvik et al.(2020), that the effect of man-made CO2 emissions does not appear to be strong enough to cause systematic changes in the temperature fluctuations during the last 200 years.

Keywords: Global climate models, Climate change, Temperature analysis, Fractional Gaussian noise,
Long-range dependence

The Earth Is Mildly Warming, But Is CO2 The Cause?

by H.W. Jenkins, Nov 6, 2023 in ClimateChangeDispatch


If this column has ever plagiarized itself, it’s by repeating the phrase “evidence of warming is not evidence of what causes warming.”

A paper published by the Norwegian government’s statistical agency, written by two of its retired experts, touching on this very subject has called forth so many shrieked accusations of climate apostasy that you know it must be interesting.

The authors ask a simple question: Are computerized climate simulations a sufficient basis for attributing observed warming to human CO2? [emphasis, links added]

After all, the Earth’s climate has been subject to substantial warming and cooling trends for millenniathat remain unexplained and can’t be attributed to fossil fuels.

As statisticians, their conclusion: “With the current level of knowledge, it seems impossible to determine how much of the temperature increase is due to emissions of CO2.

Wow. For all the abuse dumped on them for this modest observation, and even some apologetic hemming and hawing from the government-run Statistics Norway, the authors don’t say climate models don’t make useful predictions.

Their predictions are useful precisely for testing the validity of climate models. What’s more, many concerned about climate change have no trouble seeing the problem as a matter of risks rather than certainties.

This includes coauthor John Dagsvik, who told Norway’s Aftenposten newspaper he favors emissions curbs for precautionary reasons.

The correlation-to-causation puzzle is hardly the authors’ invention, having bedeviled the oracular Intergovernmental Panel on Climate Change (IPCC) since its founding in 1988.

But unrestrained name-calling is required, the critics say, because anything that undermines confidence in climate models undermines progress against climate change.

The Latest On Global Warming Is … There Is No Global Warming

by Editorial Board, Oct 25, 2023 in ClimateChangeDispatch


A new study out of Norway is exactly what was needed to shut down the climate alarmists. Its findings show that man has not set fire to his home planet.

Right from the top, in the abstract not 10 lines into the study, the authors get to the point. [emphasis, links added]

“Using theoretical arguments and statistical tests we find,” the researchers say, “that the effect of man-made CO2 emissions does not appear to be strong enough to cause systematic changes in the temperature fluctuations during the last 200 years.

In other words, our words, the greenhouse effect is so weak that it should be sidelined as an argument.

From there, the bad news only gets worse for priests of the climate religion.

“​​Even if [recently] recorded temperature variations should turn out to deviate from previous variation patterns in a systematic way, it is still a difficult challenge to establishhow much of this change is due to increasing man-made emissions of carbon dioxide (CO2) and other greenhouse gases.

The researchers, from Statistics Norway, the government’s official data agency, also address the apparent “high degree of consensus among many climate researchers that the temperature increase of the last decades is systematic (and partly man-made),” while noting that it “is certainly the impression conveyed by the mass media.

Of course, the climate zealots won’t like the study.

Hottest Evah September!!

by P. Homewood, Oct 6, 2023 in NotaLotofPeopleKnowThat


The latest of many heat records broken this year is putting the world on course for its hottest year ever, and is a sign of what is to come in future, according to scientists.

Last month was not only the hottest September on record, new data has confirmed, but it was higher by a margin described by stunned scientists as “extraordinary”, “huge” and “whopping”.

https://news.sky.com/story/september-2023-was-worlds-hottest-september-on-record-by-extraordinary-margin-new-data-confirms-with-scientists-blaming-more-than-climate-change-12976750

I’ll ignore the ignorance of journalists who think that the world started in the 19thC, during the Little Ice Age. And the fact that a “global average temperature” is a meaningless construct, which assumes you can average completely different things.

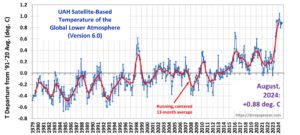
According to satellite data, the temperature anomaly last month was 0.24C higher than the previous peak in 2016:

https://www.drroyspencer.com/latest-global-temperatures/

The idea that GHGs can make such a difference in such a short period of time is utterly absurd. But the Sky report does give us a clue:

State of the climate – summer 2023

by J. Curry, Aug 15, 2023 in WUWT


A deep dive into the causes of the unusual weather/climate during 2023.  People are blaming fossil-fueled warming and El Nino, and now the Hunga-Tonga eruption and the change in ship fuels.  But the real story is more complicated.

Observations

Starting in June, the global temperatures are outpacing the record year 2016 (Figure 1).

Figure 1.  From Copernicus ECMWF

Here is the time series of the monthly surface temperature anomalies from the ERA5 reanalysis (Figure 2).  The July 2023 spike was of comparable magnitude to the winter 2016 anomaly which occurred in late winter.

Figure 2.

Here is the time series of the monthly lower atmospheric temperature anomalies from the UAH satellite-based analysis.  The July 2023 temperature anomaly remains slightly below the peak 2016 temperature anomalies and comparable to the peak 1998 temperature anomaly.

Figure 3. Plot from Roy Spencer

The spatial variation of July temperature anomalies is shown below (Figure 4). The ERA5 is the long-standing standard for global reanalyses; the JMA-Q3 (Japan) is a new product that uses a more sophisticated data assimilation process, and I expect it to be at least as good as the ERA5.  Superficially, the spatial variability looks pretty much the same, but it is informative to compare the regional amounts of warming which differ significantly between the two reanalyses. Warming is greatest in the Antarctic, and lowest in the Arctic. The warming is also very strong over the NH midlatitude oceans.

The polar regions are of particular interest. The Arctic sea ice is healthy – Arctic sea ice extent for July was only the twelfth lowest in the satellite record.  Greenland mass balance (snow accumulation minus melt) for July is above average relative to 1980-2010.  The Antarctic is a different story.  Antarctic winter sea ice is extremely low, much lower than any wintertime observations since the beginning of the satellite record in 1980.  The warm anomaly near Antarctica is an effect the reduced sea ice extent, not a direct cause. The Antarctic ozone hole is opening very early.

No, July Wasn’t The Warmest Month In Human History

by Dr M. Wielicki, Aug 14, 2023 in ClimateChangeDispatch


What’s going on?

During the last month, we were bombarded with headlines such as:

This month is the planet’s hottest on record by far – and hottest in around 120,000 years, scientists sayCNN, July 27, 2023

July 2023 ‘Virtually Certain’ To Be Hottest Month In Human HistoryForbes, July 27, 2023

So is there any validity to these claims… Was July the hottest month in human history? [emphasis, links added]

…snip…

Our civilization’s trajectory, from its humble beginnings in the wild to its current digital sophistication, serves as a testament to humanity’s relentless drive for advancement and ability to adapt.

The African Humid Period (AHP) and the rise of the Egyptian civilization…

The African Humid Period (AHP) is a climatic phase during the Holocene epoch characterized by much wetter conditions in large parts of Africa, especially the Sahara region, compared to the present day.

This significant shift in precipitation patterns had profound impacts on both the environment and early human societies of the continent.

The AHP roughly spanned from about 15,000 to 5,000 years ago, though exact timings can vary based on specific regions within Africa. It began at the end of the Last Glacial Maximum when ice sheets started retreating in the Northern Hemisphere.

One of the most dramatic manifestations of the AHP was the transformation of the Sahara desert. Today’s vast desert expanse was once a mosaic of grasslands, lakes, and rivers.

This “Green Sahara” supported a variety of wildlife, from large mammals like elephants and giraffes to a variety of fish in its waterways.

The wet conditions of the AHP supported a much denser human population in regions that are now desert. Archaeological evidence shows that these ancient Saharan communities engaged in fishing, hunting, cattle herding, and even agriculture.

The abundance of water and food allowed for relatively settled lifestyles compared to the more nomadic existences necessitated by the arid conditions that followed.

The primary driver behind the AHP is believed to be warmer summer temperatures and changes in the monsoon systems, which brought more rain to the African continent.

As these parameters shifted over millennia, the monsoons weakened, leading to the aridification of vast regions.

The African Humid Period serves as a reminder of the profound climatic variability our planet has experienced throughout relatively recent geological history at preindustrial levels of CO2, and the relative insensitivity of surface temperature and/or humidity and the concentration of GHG in the atmosphere.

Earth’s Mean Annual Temp Was Warmer 31,000 Years Ago… North Pole 22°C Warmer

by K. Richard, Apr 18, 2023 in ClimateChangeDispatch


Earth’s average annual temperature fluctuated by as much as 35°C (at high latitudes) from one millennial-scale period to the next during the last glacial period.

A recently-published 2-part study (Smul′skii, 2022a and 2022b) utilizes established orbital and insolation data to calculate Earth’s average temperature today (0 k years ago), 14.4°C, and at 25°N, 45°N, 65°N, 80°N, 0°, -25°S, -45°S, -65°S, and -80°S during 3 paleo epochs: 15.9 k years ago, 31.3 k years ago, and 46.4 k years ago. [emphasis, links added]

The Global Annual Temperature Of Earth: 14.4°C – The Same As A Century Ago

Consistent with dozens of other calculations, Smul′skii (2022a) determined the mean annual temperature of the modern period, which includes 1991-2018, ranges between 14.07 and 14.41°C.

Artificial unintelligence and global warming

by Christopher Monckton of Brenchley, Apr 11, 2023 in WUWT


Despite the dire Terminator warnings from Elon Musk, Jordan Peterson and others about the dangers of artificial intelligence, the world has little to fear from it in its present sorry state. I asked ChatGPT the following question:

M of B: If the whole world attained net zero emissions by 2050, how much less would global temperature be by that year than on business as usual?

ClotBot: As an AI language model, I do not have access to the exact data to provide an accurate answer to this question. The amount of temperature reduction would depend on various factors such as the current emissions and future emissions trends, the degree of global cooperation, and the effectiveness of emissions reduction strategies. However, it is widely recognized that global net zero emissions by 2050 is a crucial step towards limiting global temperature rise to 1.5°C above pre-industrial levels and avoiding the worst impacts of climate change.

M of B: Here are the necessary data:

  1. Since 1990 there has been a near-linear uptrend in anthropogenic greenhouse-gas forcing at 0.3 Watts per square meter per decade.
  2. The trillions of dollars spent on emissions abatement since 1990 have not in any discernible degree altered that near-linear uptrend.
  3. The transient doubled-CO2 temperature response (TCR) is 1.8 degrees at midrange.
  4. The midrange doubled-CO2 radiative forcing is 3.93 Watts per square meter per degree.
  5. Global temperature has risen since 1990 at 0.136 degrees per decade.
  6. In 1990, IPCC predicted that at midrange there would be 0.3 degrees per decade of global warming at midrange.

From these data, which are sufficient for the task, please derive the global warming prevented at midrange if all nations moved in a straight line from their present emissions to net zero emissions by 2050.

The New Pause lengthens to 8 years 9 months

by C. Monckton of Brenchley, Apr 2023 in WUWT


The New Pause has lengthened to 8 years 9 months. The least-squares linear-regression trend on the UAH monthly satellite global-temperature dataset shows no global warming from July 2015 to March 2023. As usual, this site is just about the only place where this continuing failure of global temperatures to do as they are told is reported.


The start and end dates of the New Pause are not cherry-picked. The end date is the present; the start date is the farthest back one can reach and still find a zero trend. It is what it is.

For comparison, here is the entire dataset for 44 years 4 months since December 1978. It shows a less than terrifying long-run warming rate equivalent to 1.3 degrees/century, of which 0.3 K has already occurred since January 2021, leaving just 1 K to go (on the current trend) until 2100, by which time reserves of coal, oil and gas will be largely exhausted.

The Latest UN Climate Report Is Bumper-Sticker Climate Science

by J. Curry, Mar 29, 2023 in ClimateChangeDispatch


The Intergovernmental Panel on Climate Change (IPCC) has issued a new Synthesis Report, with fanfare from the UN Secretary-General Antonio Guterres:

“The climate time-bomb is ticking but the latest IPCC report shows that we have the knowledge & resources to tackle the climate crisis. We need to act now to ensure a livable planet in the future.”

The new IPCC Report is a synthesis of the three reports that constitute the Sixth Assessment Report, plus three special reports[emphasis, links added]

This Synthesis Report does not introduceany new information or findings.

While the IPCC Reports include some good material, the Summary for Policy Makers for the Synthesis Report weakly emphasizes justified findings on climate impacts driven by extreme emission scenarios and politicized policy recommendations on emissions reductions.

The most important finding of the past five years is that the extreme emissions scenarios RCP8.5 and SSP5-8.5, commonly referred to as “business-as-usual” scenarios, are now widely recognized as implausible.

These extreme scenarios have been dropped by the UN Conference of the Parties (COP) to the UN Climate Agreement.

However, the new Synthesis Report continues to emphasize these extreme scenarios, while this important finding is buried in a footnote:

“Very high emission scenarios have become less likely but cannot be ruled out.”

The extreme emissions scenarios are associated with alarming projections of 4-5°C of warming by 2100.

The most recent Conference of the Parties (COP27) is working from a baseline temperature projectionbased on a medium emissions scenario of 2.5°C by 2100.

The 1.5 C Temperature Fiction, Already Exceeded

by J. Marohasy, Mar 21, 2023 in WUWT


From Jennifer Marohasy’s blog

March 21, 2023 By jennifer

It is all over the news, another climate change report from the IPCC – the United Nation’s Intergovernmental Panel on Climate Change. Of course, it tells us that the end is nigh unless we do something to prevent temperatures exceeding 1.5 degrees Celsius. Meanwhile, not one of the contributors has any proven capacity to accurately forecast the weather more than a few days in advance, nor much of an idea of the quality of the temperature data inputted into the simulation models claiming the Earth is burning up. Yet they claim to be able to forecast temperatures years in advance and repeat over and over the value of 1.5 C as representing a tipping point.

The reality is that annual maximum temperatures across Australia were mostly falling, and by much more than 1.5 C, from at least 1910 to 1960 and then increasing, and by more than 1.5 C, since 1960.

There are few locations across Australia where temperatures have been recorded at the one place and using standard equipment (including in a Stevenson screen with a mercury thermometer) much before 1908. Darwin in the Northern Territory and Richmond in Queensland are special because they have long and relatively reliable temperature records. Making a single adjustment to the Darwin temperature record to correct for the move from the post office to the airport (after the post office was bombed in WW II), it is evident from the chart that both temperature series show cooling and then warming over the last century and by much more than 1.5 C over periods of less than a decade.

Media Regurgitates IPCC’s ‘Final Warning’ on Climate Change – Without Realizing We’ve Already Passed 1.5°C

by A. Watts, Mar 25, 2023 in WUWT


Originally posted at ClimateREALISM

The Intergovernmental Panel on Climate Change (IPCC) published the final part of its sixth assessment report (AR6) on Monday, March 20. Predictably, the media rushed to repeat the claims made in the report with their own scary, woefully overwrought, headlines. Here is a sample: The Washington Post – World is on brink of catastrophic warming, U.N. climate change report says; NBC News – Now or never: One of the biggest climate reports ever shows time is running outThe Guardian – Scientists deliver ‘final warning’ on climate crisis: act now or it’s too late; and finally Inside Climate News, with inarguably the worst headline New IPCC Report Shows the ‘Climate Time Bomb Is Ticking,’ Says UN Secretary General António Guterres.

Each of mainstream media outlets predict that “climate doom” is just around the corner, and they’re all wrong.

The reason? The newest IPCC report laments the fact that Earth will soon pass the 1.5°C level of temperature rise, seen in the projection in Figure 1. The current extrapolation is to reach 1.5°C by April 2035.


Based on that projection, the IPCC and the media predict very bad things will happen if we don’t “act now before it’s too late.” The most recent report in the AR6 series contains no new information, rather it reiterates the warnings made the physical science portion of the report issued in the summer of 2021, which also mentioned approaching 1.5°C.

Interestingly, the “before it’s too late” language has been used since 2005, when worry about just 1°C was the big doomsday news:

NASA scientist Jim Hansen introduced the “too late” language about climate change in 2005, arguing that “We have to stabilize emissions of carbon dioxide within a decade, or temperatures will warm by more than one degree [C]… we don’t have much time left”.

We heard the same type of language in 2007, when the IPCC released their Fourth Assessment Report. The headlines in The Guardian said “time is running out” and warming “could be irreversible.

New WUWT Global Temperature Feature: Anomaly vs. Real-World Temperature

by A. Watts, Mar 13, 2023 in WUWT


One of the most frightening aspects of global warming, aka “climate change” is the graphs produced from temperature data for public consumption and trumpeted by an unquestioning and compliant media. When it comes to measuring climate, in order to actually see any temperature differences over the last century, they must be highly magnified using the temperature anomaly method.


UAH Global Temperature Update for February, 2023: +0.08 deg. C

by Dr R. Spencer, Mar 4, 2023 in WUWT


From Dr. Roy Spencer’s Global Warming Blog

The Version 6 global average lower tropospheric temperature (LT) anomaly for February 2023 was +0.08 deg. C departure from the 1991-2020 mean. This is up from the January 2023 anomaly of -0.04 deg. C.

The linear warming trend since January, 1979 remains at +0.13 C/decade (+0.11 C/decade over the global-averaged oceans, and +0.18 C/decade over global-averaged land).

It is Time to Bury the Grand Solar Minimum Myth

by J. Vinos, Feb 19, 2023 in WUWT


Fourteen years ago, a new climate myth was born. A grand solar minimum (GSM) was in the making that would not only reverse global warming but plunge the planet into a new Little Ice Age, surprising the warming alarmists and causing undue suffering. The time has come to bury that myth.

1. The origin of the myth

The deep solar minimum of 2008-2009 was a complete surprise to solar physicists. They did not know that solar activity could become so low because it had not occurred during the time of solar observations with modern instrumentation. In 2009, a solar scientist named Habibullo Abdussamatov published a paper in Russian in which he argued that the following years would see a major cooling based on the onset of a new GSM. His evidence was

  • The low solar activity of the then ongoing solar cycle (SC) minimum 23-24.

  • A bicentennial cycle in solar activity that supposedly decreased solar activity after 1600 and after 1800

  • The pause in global warming since 1998

Figure 1. From Abdussamatov 2009. “The Sun defines the climate”. Nauka i Zhizn, N1, pp. 34-42.

This prediction reached the West and became very popular, like any catastrophic prediction, actually. Articles about the arrival of a GSM proliferated on climate blogs, such as the one on WUWT: The ‘Baby Grand’ has arrived.

Other scientists, such as Livingston & Penn and de Jager & Duhau, joined Abdussamatov in 2009 in proposing the arrival of a GSM, though being more cautious about its climatic effects. It went so far as to threaten the global warming narrative at a time under assault from the Pause and Climategate. Thus, none other than Stefan Rahmstorf came to their defense saying that according to the models

“a new Maunder-type solar activity minimum cannot compensate for global warming caused by human greenhouse gas emissions.”

(Feulner & Rahmstorf 2010)

2. 2012-2015, the myth’s golden years

CMIP6 GCM Validation Based on ECS and TCR Ranking for 21st Century Temperature Projections and Risk Assessment

by N. Scafetta, Feb 3, 2023 in MDPI, Earth Science


Global climate models (GCMs) from the sixth Coupled Model Intercomparison Project Phases (CMIP6) have been employed to simulate the twenty-first-century temperatures for the risk assessment of future climate change. However, their transient climate response (TCR) ranges from 1.2 to 2.8 °C, whereas their equilibrium climate sensitivity (ECS) ranges from 1.8 to 5.7 °C, leading to large variations in the climatic impact of an anthropogenic increase in atmospheric CO2 levels. Moreover, there is growing evidence that many GCMs are running “too hot” and are hence unreliable for directing policies for future climate changes. Here, I rank 41 CMIP6 GCMs according to how successfully they hindcast the global surface warming between 1980 and 2021 using both their published equilibrium climate sensitivity (ECS) and transient climate response (TCR) estimates. The sub-ensemble of GCMs with the best performance appears to be composed of the models with ECS ranging between 1.8 and 3.0 °C (which confirms previous studies) and TCR ranging between 1.2 and 1.8 °C. This GCM sub-ensemble is made up of a total of 17 models. Depending on the emission scenarios, these GCMs predict a 2045–2055 warming of 1.5–2.5 °C compared to the pre-industrial era (1850–1900). As a result, the global aggregated impact and risk estimates seem to be moderate, which implies that any negative effects of future climate change may be adequately addressed by adaptation programs. However, there are also doubts regarding the actual magnitude of global warming, which might be exaggerated because of urban heat contamination and other local non-climatic biases. A final section is dedicated to highlighting the divergences observed between the global surface temperature records and a number of alternative temperature reconstructions from lower troposphere satellite measurements, three-ring-width chronologies, and surface temperature records based on rural stations alone. If the global warming reported by the climate records is overestimated, the real ECS and TCR may be significantly lower than what is produced by the CMIP6 GCMs, as some independent studies have already suggested, which would invalidate all of the CMIP6 GCMs.

Forest-Limit (Betula pubescens ssp. czerepanovii) Performance in the Context of Gentle Modern Climate Warming

by Kullman, Feb 6, 2023 in NoTricksZone


Claims the Swedish Scandes are unprecedentedly warm and tree-covered today “appear as large and unfounded exaggerations,” as the “climate and arboreal responses” of the last few decades “are still inside the frames of natural historical variation.” – Kullman, 2022 and Kullman, 2022a

Extensive birch forest fossils can be dated to the early- to mid-Holocene in northern Scandinavian regions, indicating these warmth-sensitive trees could exist in climates that are too cold for them to grow in today. This documents a much warmer period, “at least 3°C higher than during the past few decades,” 3000 to 10,000 years ago, or when CO2 was about 265 ppm (Kullman, 2022).

Contrary to modeler opinions, “there is little factual nourishment” to support modern projections that the Swedish Scandes will soon be returning to the subalpine birch forest climates of past millennia. The observed forest advancement in recent decades “is so small” that these modeling claims appear to be “unfounded exaggerations.”

Kullman, 2022

“In the southernmost Swedish Scandes, pine has already “leap-frogged” over receding the birch forest-limit (Kullman 2014, 2019). That scenario would mimic the arboreal landscape during the early Holocene and shift to a landscape unseen for thousands of years (cf. Blűthgen 1942; MacDonald et al. 2008, Macias-Fauria et al. 2012). During that epoch, summer temperatures are inferred to have been at least 3°C higher than during the past few decades.”
“At the landscape level, the obtained changes contribute to a greater and lusher landscape, in contrast to the dire conditions during the Little Ice Age, more than 100 years ago (Kullman 2010, 2015). Currently, there is little factual nourishment to flourishing projections stating that a major part of Swedish alpine areas is on verge of transformation to subalpine birch forest (e.g. Moen et al. 2004). Apparently, climate and arboreal responses are still inside the frames of natural historical variation, as inferred by several authors (e,g. Hammarlund et al. 2004; Bergman et al. 2005; Kullman 2013, 2017a, b; Kullman & Öberg 2018, 2020).”
“Given that the current relatively warm climate phase continues, the subalpine birch forest belt may eventually recede and give way to a subalpine pine belt. The obtained modest forest-limit advancement is so small that flourishing model simulations of extensive birch forest expansion over most of the current alpine tundra appear as large and unfounded exaggerations.”

Tree remnants (trunks, cones, roots, etc.) found at northern Sweden mountain sites 500 to 700 meters atop where the 21st century tree line ends imply the early-Holocene (~13,000 to 7000 years ago) climate was significantly warmer than today in this region (Kullman, 2022a).

The temperature lapse rate for the Swedish Lapland region is 0.6°C/100 m. Accounting for glacio-isostatic uplift, this tree line elevation implies surface air temperatures were 3.6°C higher than today during the Early Holocene.

Kullman, 2022a

….

UAH Global Temperature Update for January, 2023: -0.04 deg. C

by Dr R. Spencer, Feb 2, 2023 in WUWT


The Version 6 global average lower tropospheric temperature (LT) anomaly for January 2023 was -0.04 deg. C departure from the 1991-2020 mean. This is down from the December 2022 anomaly of +0.05 deg. C.

The linear warming trend since January, 1979 now stands at +0.13 C/decade (+0.11 C/decade over the global-averaged oceans, and +0.18 C/decade over global-averaged land).

Various regional LT departures from the 30-year (1991-2020) average for the last 13 months are:

YEAR MO GLOBE NHEM. SHEM. TROPIC USA48 ARCTIC AUST
2022 Jan +0.03 +0.06 -0.00 -0.23 -0.13 +0.68 +0.10
2022 Feb -0.00 +0.01 -0.01 -0.24 -0.04 -0.30 -0.50
2022 Mar +0.15 +0.27 +0.03 -0.07 +0.22 +0.74 +0.02
2022 Apr +0.26 +0.35 +0.18 -0.04 -0.26 +0.45 +0.61
2022 May +0.17 +0.25 +0.10 +0.01 +0.59 +0.23 +0.20
2022 Jun +0.06 +0.08 +0.05 -0.36 +0.46 +0.33 +0.11
2022 Jul +0.36 +0.37 +0.35 +0.13 +0.84 +0.55 +0.65
2022 Aug +0.28 +0.31 +0.24 -0.03 +0.60 +0.50 -0.00
2022 Sep +0.24 +0.43 +0.06 +0.03 +0.88 +0.69 -0.28
2022 Oct +0.32 +0.43 +0.21 +0.04 +0.16 +0.93 +0.04
2022 Nov +0.17 +0.21 +0.13 -0.16 -0.51 +0.51 -0.56
2022 Dec +0.05 +0.13 -0.03 -0.35 -0.21 +0.80 -0.38
2023 Jan -0.04 +0.05 -0.14 -0.38 +0.12 -0.12 -0.50

The full UAH Global Temperature Report, along with the LT global gridpoint anomaly image for January, 2023 should be available within the next several days here.

The global and regional monthly anomalies for the various atmospheric layers we monitor should be available in the next few days at the following locations:

Lower Troposphere:

http://vortex.nsstc.uah.edu/data/msu/v6.0/tlt/uahncdc_lt_6.0.txt

Mid-Troposphere:

http://vortex.nsstc.uah.edu/data/msu/v6.0/tmt/uahncdc_mt_6.0.txt

Tropopause:

http://vortex.nsstc.uah.edu/data/msu/v6.0/ttp/uahncdc_tp_6.0.txt

Lower Stratosphere:

http://vortex.nsstc.uah.edu/data/msu/v6.0/tls/uahncdc_ls_6.0.txt

Why Is Antarctica’s Climate Considered ‘Global’ But Arctic Siberia’s Is Not?

by K. Richard, Jan 26, 2023 in NoTricksZone


Independent analyses from multiple independent sources indicate Arctic Siberia was 3 to 5°C warmer than today during the peak of the last glacial, or when CO2 levels were below 200 ppm.

Measurements from Antarctica’s ice sheet are almost invariably used to characterize both the global-scale atmospheric CO2 levels and climate for the last 10s to 100s of thousands of years.

But it is rather odd that Antarctica’s climate is considered globally representative (i.e., “global warming”) since there has been no warming here for the last seven decades.

Further, ice samples from Antarctica have CO2 values that range between 900 and 2900 ppm (Matsuo and Miyake, 1966) for the modern period (i.e., the 1960s). These values are far outside the range of the accepted modern global atmospheric values (~300 to 400 ppm).

Warmth Limits For Tree Growth Affirm Austria Was 4-7°C Warmer Than Today 2000 Years Ago

by K. Richard, Jan 23, 2023 in NoTricksZone


Robust evidence from bison remains recovered from the Austrian Alps in 2020 and 2021 invalidate claims modern Alpine temperatures are unusually warm.

new study suggests that from about 6000 to 1200 years ago European bison fed on deciduous tree/vegetation that grew at Alpine altitudes reaching around 800 m higher than they do today.

Known beech and oak tree growth warmth thresholds – the required number of days per year above a minimum temperature limit – thus affirm Austria needed to be 4-7°C warmer than now during this period (~2000 years ago).

“[T]he beech limit but also the forest line during the »wisent time« (6,000 to 1,200 years before today) was much higher and the average summer temperature had to be at least 3 to 6 °C higher than today. Remarkable is a palynological record (Ressl, 1980) from the shaft cave Stainzerkogelschaft near Lunz am See. Remains of wisent were found in the shaft (1,463 m, see Tab. 3). The clay with a skull fragment with horncores inside was examined palynologically. The dominating pollen were from alder (Alnus), oak (Quercus) and linden tree (Tilia). The oak boundary (boundary between colline and montane vegetation stages) today lies between 400 and 800 metres in the Northern Alpine Alps (Grabherr et al., 2004). Oaks (Quercus) at an altitude of 1,450 metres around 2,000 years ago also indicate a climate approximately 4 to 7 °C warmer than today.”