Archives par mot-clé : Ocean

New Paper: Ocean Temperature Changes Are Uneven And Uncertain

by DR.  B. Peiser, Nov. 8, 2019 in ClimateChangeDispatch


A new paper from the Global Warming Policy Foundation looks at how scientists monitor changes in ocean temperatures and finds a story of huge uncertainties and surprising findings.

For example, while warming might be expected to be fairly uniform, measurements suggest that it is regionalized, with parts of the South Pacific, in particular, warming more than elsewhere.

As the report’s author, Dr. David Whitehouse, says, it is hard to draw firm conclusions about what is happening in the seas:

“The oceans can absorb far more heat than the atmosphere, so temperatures changes are extremely small and therefore hard to measure reliably.”

“The energy that would raise the temperature of the atmosphere by 4 degrees C would only raise the ocean temperature by thousands of a degree, barely detectable.”

“Measuring changes in the ocean heat content are at the limits of our current capability and are made with significant uncertainties and unknowns.”

A recent claim that warming of the oceans was accelerating had to be withdrawn after errors were found in its uncertainty estimates by an independent scientist.

Cold Water? The Oceans and Climate Change can be downloaded here (PDF)

Serious Errors In IPCC Ocean Report Revealed

by B. Peiser, October 11, 2019 in GWPF


London, 11 October: The Global Warming Policy Foundation (GWPF) has called on the Intergovernmental Panel on Climate Change (IPCC) to correct serious errors in its recent Special Report on the Ocean and Cryosphere in a Changing Climate.

In a letter to the IPCC, Dr Benny Peiser, the GWPF’s director, has highlighted a number of errors and misinterpretations in the IPCC’s report which are based, to a significant degree, on a flawed study which was recently retracted.

In his letter, Dr Peiser points out that the IPCC’s overall conclusion on ocean heat uptake

“is based to a significant degree on a paper by Cheng et al. (2019) which itself relies on a flawed estimate by Resplandy et al. (2018). An authors’ correction of this paper and its ocean heat uptake estimate was under review for nearly a year, but in the end Nature requested that the paper be retracted (Retraction Note, 2019).”

“While the [IPCC’s] conclusion that the rate of ocean heat uptake has increased in recent years may probably be right, the evidence you cite for there being ‘high confidence’ and ‘high agreement’ is rather doubtful due to your inclusion of flawed evidence of the retracted paper by Resplandy et al. (2018).”

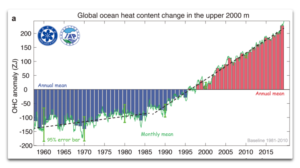
What is more, there is also doubt about the IPCC’s conclusion that ocean heat uptake has been accelerating in recent years. According to its own report the overall ocean heat uptake between 0-2000 m was nearly 10% higher over 1993-2017 than over the second half of that period, 2005-2017, suggesting that OHU may have been declining slightly rather than accelerating over the last 25 years.

In light of these flaws, the GWPF is calling on the IPCC to correct the evident errors and reduce its confidence rating accordingly.

Letter to the IPCC (pdf)
https://www.thegwpf.org/content/uploads/2019/10/IPCC-letter-Oct2019.pdf?utm_source=CCNet+Newsletter&utm_campaign=67a9d80e1a-EMAIL_CAMPAIGN_2019_10_11_11_33_COPY_01&utm_medium=email&utm_term=0_fe4b2f45ef-67a9d80e1a-36415357&mc_cid=67a9d80e1a&mc_eid=b9fdc60fd9

A Second Look At Radiation Versus Temperature

by Willis Eschenbach, June 14, 2019 in WUWT


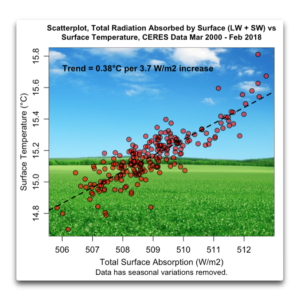
I kept going back and looking at the graphic from my previous post on radiation and temperature. It kept niggling at me. It shows the change in surface temperature compared to the contemporaneous change in how much energy the surface is absorbing. Here’s that graphic again:


Figure 1. From my previous post. It is a scatterplot showing the dependence of temperature on the total downwelling radiation (longwave plus shortwave) absorbed by the surface.

What I found botheracious were the outliers at the top of the diagram. I knew what they were from, which was the El Nino/La Nina of 2015-2016.

After thinking about that, I realized I’d left one factor out of the calculations above. What the El Nino phenomenon does is to periodically pump billions of cubic meters of the warmest Pacific equatorial water towards the poles. And I’d left that advected energy transfer out of the equation in Figure 1. (Horizontal transfer of energy from one place on earth to another is called “advection”).

And it’s not just advection of energy caused by El Nino. In general, heat is advected from the tropics towards the poles by the action of the ocean and the atmosphere. Figure 2 shows the average amount of energy exported (plus) or imported (minus) around the globe.

New Proxy Data Show Northern Europe Weather Variability In Sync With Natural Factors: Solar Activity, Oceanic Cycles

by J. Goslin in P. Gosselin, June 1, 2019 in NoTricksZone


Another new paper, which of course will be ignored by the government-funded IPCC because it contradicts claims CO2 drives climate, shows that natural factors dominated the earth’s climate variability.

A team of scientists led by Jerome Goslin have published a paper titled Decadal variability of north-eastern Atlantic storminess at the mid-Holocene: New inferences from a record of wind-blown sand, western Denmark in the journal Global and Planetary Change, suggesting climate variability is driven naturally.

Image: NASA, public domain

Climate change driven by solar and oceanic cycles

Not surprisingly, as evidenced by hundreds of other publications (which are entirely ignored by the IPCC), climate variability is indeed tied to solar activity and “internal atmospheric and oceanic modes”.

CO2 and ocean chemistry

by Dr. Daniela Mazza, May 18, 2019 in WUWT


Oceans cover about 71% of the earth surface, but their influence on climate change is not only due to high heat capacity of water , not only to the ocean’s water circulation, but to a fact which is widely underestimated : the pH (acidity level) of sea-water is substantially alkaline, ranging from 8.0 to 8.7 . This means that the balance between positive and negative ions is reached by accounting for OH,hydroxide ions, in a far larger amount in respect to H+ hydrogen ions.

The pH value higher than 7 allows seawater to dissolve and react huge amounts of CO2 , carbon dioxide, thus affecting the amount of this gas in the atmosphere by absorbing excess of it. To calculate this excess in respect to what would be the true equilibrium value in the air, all of the chemical reactions involved have to be simultaneously computed, accounting for their equilibrium constants, which in turn depend on temperature.

1 – CO2 (gas) + H2O <==> H2CO3* (H2CO3* is the sum of dissolved CO2 and H2CO3)

2 – H2CO3 <==> H+ + HCO3

3 – HCO3 <==> H+ + CO3– –

4 – H2O <==> H+ + OH

5 – Ca++ + CO3– – <==> CaCO3 (calcite)

6 – Ca++ + OH <==> Ca(OH)+

7 – Mg++ + OH <==> Mg(OH)+


Conclusions : CO2 is at 410 ppm far above the equilibrium value (315) , provided a standard seawater composition and an average ocean temperature of 17°C (taken from wikipedia). No doubt that solubility will force more CO2 to be stored in oceans . Moreover if we consider CaCO3 formation (seawater has overshot the solubility of this salt nearly 50 times but nucleation and growth are slow) still more CO2 will be stored by limestone.

El Niño Conditions Persist in the Pacific Ocean

by A. Watts, April 16, 2019 in WUWT


An El Niño that began to form last fall has matured and is now fully entrenched across the Pacific Ocean. Changes in sea surface temperatures (SSTs) brought about by an El Niño affect the atmosphere, resulting in distinctive changes in the rainfall pattern across the Pacific Basin. These changes show up as anomalies or deviations in NASA’s analysis of climatological rainfall.

As with a traditional El Niño, the effects from a Central Pacific El Niño can still spread to the U.S. Also, clearly visible in the NASA-generated monthly average rainfall was an area of heavy rain over the southeast coast of Africa associated with the passage of Cyclone Idai, which devastated the region with torrential flooding.

For more information about El Nino, visit: https://www.pmel.noaa.gov/elnino/definitions
Learn more about NASA’s Precipitation measurements: http://pmm.nasa.gov/trmm

Deep-water circulation changes lead North Atlantic climate during deglaciation

by F. Muschitiello et al., March 20, 2019 in Nature


Abstract

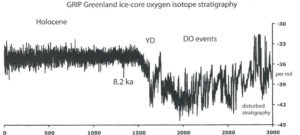
Constraining the response time of the climate system to changes in North Atlantic Deep Water (NADW) formation is fundamental to improving climate and Atlantic Meridional Overturning Circulation predictability. Here we report a new synchronization of terrestrial, marine, and ice-core records, which allows the first quantitative determination of the response time of North Atlantic climate to changes in high-latitude NADW formation rate during the last deglaciation. Using a continuous record of deep water ventilation from the Nordic Seas, we identify a 400-year lead of changes in high-latitude NADW formation ahead of abrupt climate changes recorded in Greenland ice cores at the onset and end of the Younger Dryas stadial, which likely occurred in response to gradual changes in temperature- and wind-driven freshwater transport. We suggest that variations in Nordic Seas deep-water circulation are precursors to abrupt climate changes and that future model studies should address this phasing.

Study: Much of the surface ocean will shift in color by end of 21st century

by Charles the moderator,  February 5, 2019 in WUWT


Climate-driven changes in phytoplankton communities will intensify the blue and green regions of the world’s oceans

From the Massachusetts Institute of Technology

Climate change is causing significant changes to phytoplankton in the world’s oceans, and a new MIT study finds that over the coming decades these changes will affect the ocean’s color, intensifying its blue regions and its green ones. Satellites should detect these changes in hue, providing early warning of wide-scale changes to marine ecosystems.

Writing in Nature Communications, researchers report that they have developed a global model that simulates the growth and interaction of different species of phytoplankton, or algae, and how the mix of species in various locations will change as temperatures rise around the world. The researchers also simulated the way phytoplankton absorb and reflect light, and how the ocean’s color changes as global warming affects the makeup of phytoplankton communities.

The researchers ran the model through the end of the 21st century and found that, by the year 2100, more than 50 percent of the world’s oceans will shift in color, due to climate change.

Climate change might not slow ocean circulation as much as thought

by Carolyn Grambling, January 31, 2019 in ScienceNews


New findings from an international ocean observing network are calling into question the long-standing idea that global warming might slow down a big chunk of the ocean’s “conveyor belt.” The first 21 months of data from sensors moored across much of the North Atlantic are giving new insight into what controls the strength of the Atlantic Meridional Overturning Circulation, a system of currents that redistributes heat around much of the Western Hemisphere.

German Scientists Back Findings By Gebbie et al 2019, Believe Climate CO2 Sensitivity Even “Likely To Be Lower” Than 1.3°C

by P. Gosselin, January 29, 2019 in NoTricksZone


A paper very worth reading from the USA from January 2019 in Science (Geoffrey Gebbie of the Woods Hole Oceanographic Institution/Peter Huybers of Harvard University, hereinafter GH19) is titled “The Little Ice Age and 20th-century deep Pacific cooling”.

It shows fascinating science.

The authors evaluated temperature measurements made in the deep sea by the famous expedition of the “HMS Challenger” in the 1870s. The ship sailed the Atlantic and Pacific, and probably provided the first data on the oceans down to depths of over 2000 meters. The recalibration of the old data alone is a work of art! What the paper found: The Pacific down in depths has cooled from 1870 to today, the Atlantic not.

Ocean Warming in Climate Models Varies Far More than Recent Study Suggests

by Roy Spencer, January 17, 2019 in GlobalWarming


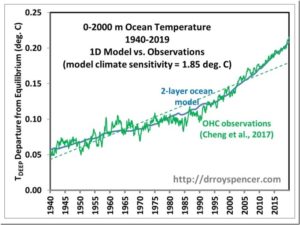
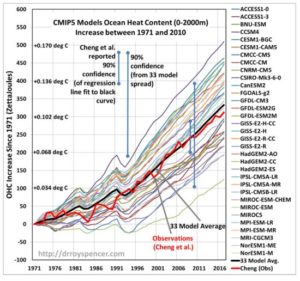
I wanted to expand upon something that was mentioned in yesterday’s blog post about the recent Cheng et al. paper which was widely reported with headlines suggesting a newer estimate of the rate of ocean warming is 40% higher than old estimates from the IPCC AR5 report in 2013. I demonstrated that the new dataset was only only 11% warmer when compared to the AR5 best estimate of ocean warming during 1971-2010.

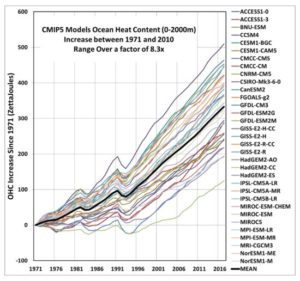
The point I want to reemphasize today is the huge range in ocean warming between the 33 models included in that study. Here’s a plot based upon data from Cheng’s website which, for the period in question (1971-2010) shows a factor of 8 range between the model with the least ocean warming and the model with the most warming, based upon linear trends fitted to the model curves:

Yearly ocean heat content (OHC) changes since 1971 in 33 models versus the recent Cheng reanalysis of XBT and Argo ocean temperature data for the surface to 2,000m layer. The vertical scale is in both ZettaJoules (10^21 Joules) and in deg. C (assuming an ocean area of 3.6 x 10^14 m^2). The Cheng et al. confidence interval has been inflated by 1.43 to account for the difference between the surface area of the Earth (Cheng et al. usage) and the actual ocean surface area.

Early 20th century global warming

by Judith Curry, January 25, 2019 in ClimateEtc.


A careful look at the early 20th century global warming, which is almost as large as the warming since 1950.  Until we can explain the early 20th century warming, I have little confidence IPCC and NCA4 attribution statements regarding the cause of the recent warming.

This is an issue that has long interested me.  Peter Webster wrote a previous post Mid 20th Century Global(?) Warming, which focused on the warm bump that culminated in the 1940’s.  My interest in this period was reignited while working on my report Sea Level and Climate Change.  Then, the recent paper by Zanna et al. discussed in Ocean Heat Content  Surprises further made the wheels turn.

In response to the Ocean Heat Content thread, David Appell posted a link to this paper on twitter:

The early 20th century warming: Anomalies, causes and consequences

Is ocean warming accelerating faster than thought? In a word, no.

by Nic Lewis, January 22, 2019 in WUWT


There are a number of statements in Cheng et al. (2019) ‘How fast are the oceans warming’, (‘the paper’) that appear to be mistaken and/or potentially misleading. My analysis of these issues is followed by a reply from the paper’s authors.

Contrary to what the paper indicates:

  • Contemporary estimates of the trend in 0–2000 m depth ocean heat content over 1971–2010 are closely in line with that assessed in the IPCC AR5 report five years ago

  • Contemporary estimates of the trend in 0–2000 m depth ocean heat content over 2005–2017 are significantly (> 95% probability) smaller than the mean CMIP5 model simulation trend.

Media Reports of +40% Adjustment in Ocean Warming Were Greatly Exaggerated

by Roy W. Spencer, Ph. D., January 16, 2019


Summary:The recently reported upward adjustment in the 1971-2010 Ocean Heat Content (OHC) increase compared to the last official estimate from the IPCC is actually 11%, not 40%. The 40% increase turns out to be relative to the average of various OHC estimates the IPCC addressed in their 2013 report, most of which were rejected. Curiously, the new estimate is almost identical to the average of 33 CMIP climate models, yet the models themselves range over a factor of 8 in their rates of ocean warming. Also curious is the warmth-enhancing nature of temperature adjustments over the years from surface thermometers, radiosondes, satellites, and now ocean heat content, with virtually all data adjustments leading to more warming rather than less.

See also here

Pas de réchauffement pour les zones éloignées des océans

by Dr. Jean N., 16 janvier 2019 in ScienceClimatEnergie


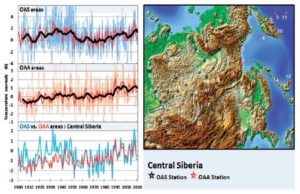
La théorie radiative de l’effet de serre prédit que la température de la basse atmosphère augmente lorsque le taux de CO2 croît. Si l’on prend par exemple une très vaste région, comme la Chine centrale ou le Midwest américain, qui couvrent tous deux des centaines de milliers de km2, on devrait donc observer un accroissement des températures moyennes de la basse atmosphère en fonction du temps. Effectivement, dans ces régions, et comme pour tout l’hémisphère Nord, le taux de CO2 n’a fait qu’augmenter depuis le début des mesures par spectrométrie infra-rouge en 1959. Cependant, une étude récente vient de montrer que la température moyenne n’aurait pas augmenté dans ces vastes régions, et ce malgré l’augmentation du taux de CO2 atmosphérique. L’étude en question a été publiée dans Energy & Environment en 2018 par deux chercheurs danois de la Danish Technical University, Frank Lansner et Jens Pedersen. Il faut rester prudent, mais si cette étude est confirmée, il s’agirait d’un sérieux problème pour la théorie radiative de l’effet de serre.


Figure 1. Anomalie de température pour la Sibérie centrale entre 1900 et 2010 (voir article)

The ‘Little Ice Age’ hundreds of years ago is STILL cooling the bottom of Pacific, researchers find

by Charles the moderator, January 9, 2019 in WUWT


  • The Little Ice Age brought colder-than-average temps around the 17th century

  • Researchers say temperatures in deep Pacific lag behind those at the surface

  • As a result, parts of the deep Pacific is now cooling from long ago Little Ice Age

A Harvard study has found that parts of the deep Pacific may be getting cooler as the result of a climate phenomenon that occurred hundreds of years ago. The models suggest In the deep temperatures are dropping at a depth of around 2 kilometers (1.2 miles)

Study reconstructing ocean warming finds ocean circulation changes may account for significant portion of sea level rise

by Anthony Watts, January 7, 2019 in WUWT


Study suggests that in the last 60 years up to half the observed warming and associated sea level rise in low- and mid- latitudes of the Atlantic Ocean is due to changes in ocean circulation.

Over the past century, increased greenhouse gas emissions have given rise to an excess of energy in the Earth system. More than 90% of this excess energy has been absorbed by the ocean, leading to increased ocean temperatures and associated sea level rise, while moderating surface warming.

The multi-disciplinary team of scientists have published estimates in PNAS, that global warming of the oceans of 436 x 1021 Joules has occurred from 1871 to present (roughly 1000 times annual worldwide human primary energy consumption) and that comparable warming happened over the periods 1920-1945 and 1990-2015.

Ocean Temperatures Have Been Rising Since 19thC

by P. Homewood, October 12, 2018 in NotaLotofPeopleKnowThat


https://www.sciencedaily.com/releases/2012/04/120401135345.htm


The significance of course is that the warming of the oceans began long before any impact from CO2 emissions.

HH Lamb has written extensively about how sea temperatures in the Atlantic fell radically during the LIA. Is the warming trend since then merely a return to earlier conditions?

Yes, the Ocean Has Warmed; No, It’s Not ‘Global Warming’

by P. Homewood, October 10, 2018 in NotaLotofPeopleKnowThat


Contrary to recent press reports that the oceans hold the still-undetected global atmospheric warming predicted by climate models, ocean warming occurs in 100-year cycles, independent of both radiative and human influences.

At a press conference in Washington, D.C., on March 24, 2000, Dr. James Baker, Administrator of the U.S. National Oceanic and Atmospheric Administration (NOAA), announced that since the late 1940s, there “has been warming to a depth of nearly 10,000 feet in the Atlantic, Pacific, and Indian Oceans.” “In each ocean basin, substantial temperature changes are occurring at much deeper depths than we previously thought,” Dr. Baker said, as indicated by research conducted at NOAA’s Ocean Climate Laboratory. He was referring to a paper published in Science magazine that day, prepared by Sydney Levitus, John Antonov, Timothy Boyer, and Cathy Stephens, of the NOAA Center.

For 15 years, modellers have tried to explain their lack of success in predicting global warming. The climate models had predicted a global temperature increase of 1.5°C by the year 2000, six times more than that which has taken place. Not discouraged, the modellers argue that the heat generated by their claimed “greenhouse warming effect” is being stored in the deep oceans, and that it will eventually come back to haunt us. They’ve needed such a boost to prop up the man-induced greenhouse warming theory, but have had no observational evidence to support it. The Levitus, et al. article is now cited as the needed support.

Ice sheets of the last ice age seeded the ocean with essential nutrient silica

by University of Bristol, August 10, 2018 in ScienceDaily


Silica is needed by a group of marine algae (the microscopic plants of the oceans) called diatoms, who use it to build their glassy cell walls (known as frustules).

These plankton take up globally significant amounts of carbon — they remove carbon dioxide from the atmosphere via photosynthesis, and act as a natural carbon sink when they die and fall to the bottom of the ocean — and form the base of the marine food chain.

The researchers are also planning to use more complex and realistic computer models to delve deeper into the potential changes in the global silica cycle since the last glacial maximum. These might include more accurate representations of ocean currents, recycling of silica in the water column, and potential changes to the marine algal community.

‘This Is How Global Warming Will Play Out:’ 1931 Ocean Temp Record Broken By…0.2 Degrees?

by Mike Bastach, August 5, 2018 in WUWT


….

But while Scripps is trying to tie the record-high ocean reading to the broader wave of media coverage on global heat waves, there are a few caveats to note about what the scientists found.

First, these measurements are taken from a pier that’s near the shoreline, which would not necessarily make it representative of the entire Pacific Ocean, and therefore easily influenced by local weather events.

The “anomalously warm temperatures for the past week” that Scripps researchers observed at their pier somewhat mirror the temperature pattern in 1931, and indeed, the daily records broken in the past week have been very close to readings from 87 years ago.

There is an upward trend in temperature readings from Scripps’ pier, but the trend seems to also broadly coincide with the flipping of a natural ocean cycle, the Pacific Decadal Oscillation, to its warm phase. That flip occurred around 1976.

German Scientists: Chris Folland’s Findings On Climate Models “Good For a Loud Laugh”…”Pulling Tricks Like Troopers”

by Dr S. Lüning and Prof. F. Vahrenholt, July 25, 2018 in NoTricksZone


The temperature of the last 100 years was also the topic of a new publication by Folland et al. 2018. The authors are very much at home in the camp of the IPCC and had to admit that there have been phases of cooling, stagnating or even slow warming: 1896 – 1910, 1941 – 1975, and 1998 – 2013.

Climate models struggle with this because CO2 is climbing steadily. So why does climate warming stall under these conditions? Folland and his colleagues examined the models and are convinced that despite the small problems, the models function perfectly well and thus no other climate factors need to be accounted for.

In 1940s it was a bit too warm and the models were unable to reproduce this. Given, the authors say. Greenhouse gases have been responsible for almost all the warming of the last 125 years.

Now isn’t it a bit odd that the authors made absolutely no mention of the ocean cycles in the abstract? As our regular readers know, the ocean cycles run surprisingly synchronous with the fluctuations in global temperatures, i.e. the key factors here are the AMO and PDO.

PDO ocean cycle and its fluctuations in the global temperature development. Source: Book ‘Die kalte Sonne‘.

In the ocean’s twilight zone, tiny organisms may have giant effect on Earth’s carbon cycle

by Florida State University, July 18, 2018 in ScienceDaily


Deep in the ocean’s twilight zone, swarms of ravenous single-celled organisms may be altering Earth’s carbon cycle in ways scientists never expected, according to a new study from Florida State University researchers.

In the area 100 to 1,000 meters below the ocean’s surface — dubbed the twilight zone because of its largely impenetrable darkness — scientists found that tiny organisms called phaeodarians are consuming sinking, carbon-rich particles before they settle on the seabed, where they would otherwise be stored and sequestered from the atmosphere for millennia.

This discovery, researchers suggest, could indicate the need for a re-evaluation of how carbon circulates throughout the ocean, and a new appraisal of the role these microorganisms might play in Earth’s shifting climate.

The findings were published in the journal Limnology and Oceanography.

The La Nina Pump

by Willis Eschenbach, July 16, 2018 in WUWT


Sometimes a chance comment sets off a whole chain of investigation. Somewhere recently, in passing I noted the idea of the slope of the temperature gradient across the Pacific along the Equator. So I decided to take a look at it. Here is the area that I examined.

I’ve written about this temperature gradient before, in a post called The Tao of El Nino. If you take time to read that post, this one will make more sense. …

Global Sea Sea Surface Temperatures Have Seen “Pretty Dramatic Turnaround,” Says 40-Year Meteorologist!

by P. Gosselin, July 15, 2018 in NoTricksZone


Hurricane threat to East Coast due to natural factors

First at his most recent Saturday Summary, the 40-year meteorologist first warns that in-close developing hurricanes of the sort seen in the 1930s are a risk to the US East Coast this year, due the current Atlantic temperature pattern. The reason has nothing to do with CO2 in the atmosphere, but because of natural sea surface temperature cycles.

Sea surface temperatures see “pretty dramatic turnaround”