by P. Gosselin, Jan 14, 2024, in NoTricksZone
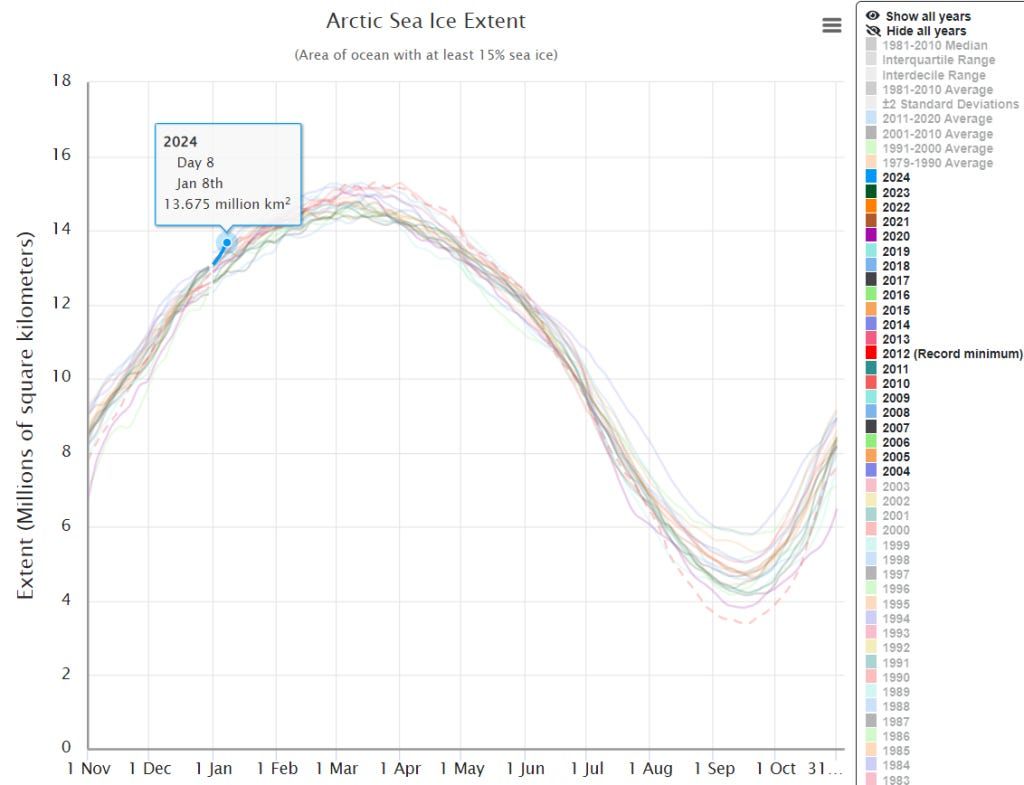
Some alarmist scientists claim it’s the hottest year on record, yet Arctic sea ice for this date stands at its highest level in 21 years.
Hat-tip: EIKE here.
Source: NSIDC
…

by P. Gosselin, Jan 14, 2024, in NoTricksZone
Some alarmist scientists claim it’s the hottest year on record, yet Arctic sea ice for this date stands at its highest level in 21 years.
Hat-tip: EIKE here.
Source: NSIDC
…
by P. Homewood, Jan 7 ,2024 in NotaLotofPeopleKonwThat

https://www.metoffice.gov.uk/hadobs/hadukp/data/monthly/HadEWP_monthly_totals.txt
Last year was a wet one in England & Wales, the 7th wettest on record. (The UK series has a similar result).
We routinely hear claims that the climate is wetter because a warmer atmosphere can hold more moisture, (while also being told we will get more droughts!). However the fact that we have had similarly wet years in the distant past, such as 1768, 1852, 1872, 1877, 1882, 1903 and 1960, rather demolishes that argument.
The major factor behind last year’s high rainfall was that the number of rain days was also one of the highest on record since 1931, when Met Office daily data begins. In short, annual rainfall was high because of weather, not climate.
…
by J. Hellner, Nov 21, 2023 in ClimateChangeDispatch
Isn’t it time that journalists and students are taught to do research and ask questions about the climate instead of just regurgitating talking points pushing the green agenda?
We are constantly told that storms, floods, droughts, and other natural disasters are growing in frequency and intensity—so why don’t we see specific examples? [emphasis, links added]
Like the severe drought and warm period in Europe in 1540 when temperatures were 9–13 degrees above today’s averageduring the Little Ice Age?
For eleven months, there was practically no rain, and temperatures were five to seven degrees [Celsius] [9–13°F] above the normal values of the 20th century; in many places, summer temperatures must have exceeded 40°C (104°F).
Many forests in Europe went up in flames, choking smoke darkened the sun, and not a single thunderstormwas reported in the summer of 1540.
Water was already scarce in May, wells and springs dried up, mills stood still, people starved, and livestock was slaughtered. Estimates are that in 1540, half a million people died, mostly from dysentery.
Or what about the massive fires in the United States in 1871? In 1871, the Midwestern United States had a severe drought and warm weather, clearly not caused by humans and our use of natural resources.
As a result of this heat and drought, there were severe fires throughout the Midwest, including the Great Chicago Fire.
The temperature was 85 degrees on October 8, 1871. This year the high was 55 degrees, or thirty degrees cooler.
Why isn’t Chicago warmer, after 152 years, with all the cement, people, and gas vehicles and equipment if they all cause warming?
The Chicago fire alone caused $200 million in damages, which is the equivalent of over $5 billion today.
I am 70 years old, and I don’t recall serious fires during my lifetime in the Midwest.
The narrative that humans and our use of natural resources are to blame for warming temperatures, in turn creating an existential threat to our survival, is contrary to the data and facts; scientific honesty would be forming a narrative based on the evidence, instead of forcing “evidence” to fit a story.
What about the Medieval Warm Period 1,000 years ago where temperatures were similar to today? What caused that warming since it clearly wasn’t man’s use of natural resources?
…
by Universiy of Washington, Nov 13, 2023 in PhysOrg
To paraphrase Mark Twain, reports of declining phytoplankton in the North Atlantic may have been greatly exaggerated. A prominent 2019 study used ice cores in Antarctica to suggest that marine productivity in the North Atlantic had declined by 10% during the industrial era, with worrying implications that the trend might continue.
But new research led by the University of Washington shows that marine phytoplankton—on which larger organisms throughout the marine ecosystem depend—may be more stable than believed in the North Atlantic. The team’s analysis of an ice core going back 800 years shows that a more complex atmospheric process may explain the recent trends.
The study was published in the Proceedings of the National Academy of Sciences.
…
by K. Richard, Nov 16, 2023 in NotricksZone
The timing of the dramatic Antarctic sea ice decline during the last deglaciation suggests solar forcing and sea ice retreat “instigated” century-scale climate warming and atmospheric CO2 change. This would appear to challenge the perception CO2 plays a causal role in glacial-interglacial sea ice and climate changes.
From ~21,000 to 19,500 years ago, when CO2 was thought to have been at its lowest point in the Quaternary ice age (~180 ppm), the sea ice surrounding East and West Antarctica completed 50% of its eventual deglaciation-era decline (Sadatzki et al., 2023).
“[I]ndependent lines of evidence supporting that early sea ice and surface ocean changes in the Southern Ocean initiated as early as ~19.5 ka ago (with signs of summer sea ice retreat in our reconstruction as early as ~21 ka ago) and thus (at least) about 2 ka before major deglacial changes in global ocean circulation, climate, and atmospheric CO2.”
The increase in 65°S insolation during these millennia was deemed sufficient to drive this magnitude of sea ice retreat.
“This early increase in local integrated summer insolation at 65°S, which is independent of the longitude, may have thus provided enough energy to initiate melting of the near-perennial sea ice cover in late glacial.”
…
by WUWT, Apr 24, 2023
CORVALLIS, Ore. – During the last ice age, massive icebergs periodically broke off from an ice sheet covering a large swath of North America and discharged rapidly melting ice into the North Atlantic Ocean around Greenland, triggering abrupt climate change impacts across the globe.
These sudden episodes, called Heinrich Events, occurred between 16,000 and 60,000 years ago. They altered the circulation of the world’s oceans, spurring cooling in the North Atlantic and impacting monsoon rainfall around the world.
But little was known about the events’ effect on nearby Greenland, which is thought to be very sensitive to events in the North Atlantic. A new study from Oregon State University researchers, just published in the journal Nature, provides a definitive answer.
“It turns out, nothing happened in Greenland. The temperature just stayed the same,” said the study’s lead author, Kaden Martin, a fourth-year doctoral candidate in OSU’s College of Earth, Ocean, and Atmospheric Sciences. “They had front-row seats to this action but didn’t see the show.”
Instead, the researchers found that these Heinrich events caused rapid warming in Antarctica, at the other end of the globe.
The researchers anticipated Greenland, in close proximity to the ice sheet, would have experienced some kind of cooling. To find that these Heinrich Events had no discernible impact on temperatures in Greenland is surprising and could have repercussions for scientists’ understanding of past climate dynamics, said study co-author Christo Buizert, an assistant professor in the College of Earth, Ocean, and Atmospheric Sciences.
“If anything, our findings raise more questions than answers,” said Buizert, a climate change specialist who uses ice cores from Greenland and Antarctica to reconstruct and understand the Earth’s climate history. “This really changes how we look at these massive events in the North Atlantic. It’s puzzling that far-flung Antarctica responds more strongly than nearby Greenland.”
Scientists drill and preserve ice cores to study past climate history through analysis of the dust and tiny air bubbles that have been trapped in the ice over time. Ice cores from Greenland and Antarctica provide important records of Earth’s atmospheric changes over hundreds of thousands of years.
…
by K. Richard, Apr 18, 2023 in ClimateChangeDispatch
Earth’s average annual temperature fluctuated by as much as 35°C (at high latitudes) from one millennial-scale period to the next during the last glacial period.
A recently-published 2-part study (Smul′skii, 2022a and 2022b) utilizes established orbital and insolation data to calculate Earth’s average temperature today (0 k years ago), 14.4°C, and at 25°N, 45°N, 65°N, 80°N, 0°, -25°S, -45°S, -65°S, and -80°S during 3 paleo epochs: 15.9 k years ago, 31.3 k years ago, and 46.4 k years ago. [emphasis, links added]
The Global Annual Temperature Of Earth: 14.4°C – The Same As A Century Ago
Consistent with dozens of other calculations, Smul′skii (2022a) determined the mean annual temperature of the modern period, which includes 1991-2018, ranges between 14.07 and 14.41°C.
…
by American Institute of Physics, Mar 7, 2023 in ScienceDaily
Proxy data — indirect records of the Earth’s climate found in unlikely places like coral, pollen, trees, and sediments — show interesting oscillations approximately every 100,000 years starting about 1 million years ago. Strong changes in global ice volume, sea level, carbon dioxide concentration, and surface temperature indicate cycles of a long, slow transition to a glacial period and an abrupt switch to a warm and short interglacial period.
Milutin Milankovitch hypothesized that the timing of these cycles was controlled by the orbital parameters of the Earth, including the shape of its path around the sun and the tilt of the planet. A slightly closer orbit or more tilted planet could create a small increase in solar radiation and a feedback loop that leads to massive changes in climate. This idea suggests that there may be some predictability in the climate, a notoriously complex system.
In Chaos, by AIP Publishing, Stefano Pierini of Parthenope University of Naples proposed a new paradigm to simplify the verification of the Milankovitch hypothesis.
“The main motivation behind this study was the wish to characterize and illustrate the Milankovitch hypothesis in a simple, elegant, and intuitive way,” Pierini said.
Many models suggest that Milankovitch is correct; however, such methods are often detailed and study specific. They incorporate climate feedback loops — for example, increased ice cover reflects more radiation back into space, leading to further cooling and more ice cover — as threshold crossing rules. This means that an abrupt jump in climate only occurs once a parameter reaches a given tipping point.
Pierini’s “deterministic excitation paradigm” combines the physics concepts of relaxation oscillation and excitability to link Earth’s orbital parameters and the glacial cycles in a more generic way. The relaxation oscillation component describes how the climate slowly returns to its original glacier state after it is disturbed. At that point, the excitability piece of the model captures the external orbital changes and triggers the next glacial cycle.
By using his own threshold crossing rules and adopting a classical energy-balance model, Pierini obtained correct and robust timing of the most recent glacial cycles.`
…
by K. Richard, Feb 27, 2023 in NoTricksZone
A warming event that spans only one year, with decades of stable temperatures before and after, would not appear to align with rapidly rising human CO2 emissions or a gradually rising atmospheric CO2 concentration.
From 1958 to 2020, as CO2 rose from 320 ppm to 410 ppm, Greenland had a warming period of 1°C that lasted one year – 1994. Over the next 26 years (1994-2020) and spanning the years 1958 to 1993, there have been “relatively constant” temperatures across Greenland (Zhang et al., 2022).
These temperature trends appear to align much better with phases of the North Atlantic Oscillation (NAO), Greenland blocking indexes (GBI), and volcanism better than they do with any anthropogenic causal agents.
…
by K. Richard, Jan 23, 2023 in NoTricksZone
Robust evidence from bison remains recovered from the Austrian Alps in 2020 and 2021 invalidate claims modern Alpine temperatures are unusually warm.
A new study suggests that from about 6000 to 1200 years ago European bison fed on deciduous tree/vegetation that grew at Alpine altitudes reaching around 800 m higher than they do today.
Known beech and oak tree growth warmth thresholds – the required number of days per year above a minimum temperature limit – thus affirm Austria needed to be 4-7°C warmer than now during this period (~2000 years ago).
“[T]he beech limit but also the forest line during the »wisent time« (6,000 to 1,200 years before today) was much higher and the average summer temperature had to be at least 3 to 6 °C higher than today. Remarkable is a palynological record (Ressl, 1980) from the shaft cave Stainzerkogelschaft near Lunz am See. Remains of wisent were found in the shaft (1,463 m, see Tab. 3). The clay with a skull fragment with horncores inside was examined palynologically. The dominating pollen were from alder (Alnus), oak (Quercus) and linden tree (Tilia). The oak boundary (boundary between colline and montane vegetation stages) today lies between 400 and 800 metres in the Northern Alpine Alps (Grabherr et al., 2004). Oaks (Quercus) at an altitude of 1,450 metres around 2,000 years ago also indicate a climate approximately 4 to 7 °C warmer than today.”
…
by J. Vinos, Jan 8, 2023 in WUWT
No minimally informed person denies that climate changes. The climate has always changed. Since 1860 the predominant climate change has been warming, which is fortunate because if we had a winter like those of 1800-1850, we would be in for a shock. No one has been able to prove that global warming is primarily a consequence of our emissions. It is reasonable to assume that increased CO2 has contributed to warming since the mid-20th century when our CO2 emissions increased significantly, but no one knows how much they have contributed, no matter how much the Intergovernmental Panel on Climate Change (IPCC) insists that “humans are the dominant cause of observed global warming over recent decades.”(IPCC AR6, page 515).
There is no evidence for this statement. I know this because I have read thousands of scientific papers looking for it. And no, computer models are not evidence of anything but the programming skills of their authors. Models and their predictions are constantly changing and when our knowledge of climate changes, they must be redone.
The absolute lack of evidence contrasts sharply with the decision to cut our CO2 emissions to zero by completely changing our fossil fuel-based energy system and calling CO2 a pollutant—when it is as essential to life as oxygen. All this while most of the world doesn’t give a damn about emissions and many are only on board for the promised money.
….
by R. Spencer, Jan 3, 2023 in GlobalWarming
December of 2022 finished the year with a global tropospheric temperature anomaly of +0.05 deg. C above the 1991-2020 average, which was down from the November value of +0.17 deg. C.
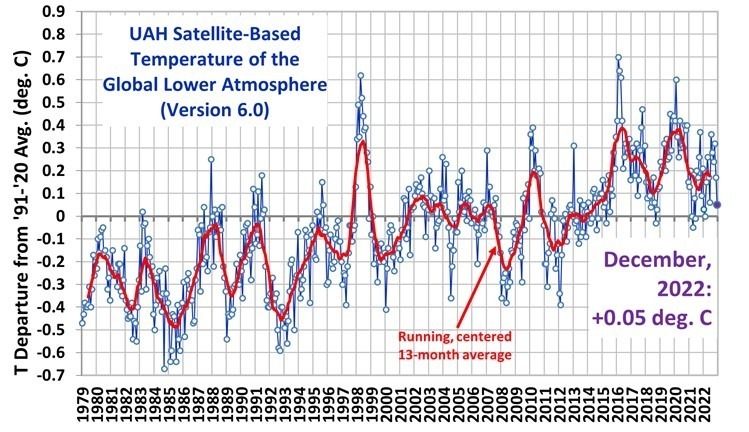
The average anomaly for the year was +0.174 deg. C, making 2022 the 7th warmest year of the 44+ year global satellite record, which started in late 1978. Continuing La Nina conditions in the Pacific Ocean have helped to reduce global-average temperatures for the last two years. The 10 warmest years were:
The linear warming trend since January, 1979 continues at +0.13 C/decade (+0.12 C/decade over the global-averaged oceans, and +0.18 C/decade over global-averaged land).
…
by Andy May, Jan 7, 2023 in Petrophysicist
No minimally informed person denies that climate changes. The climate has always changed. Since 1860 the predominant climate change has been warming, which is fortunate because if we had a winter like those of 1800-1850, we would be in for a shock. No one has been able to prove that global warming is primarily a consequence of our emissions. It is reasonable to assume that increased CO2 has contributed to warming since the mid-20thcentury when our CO2 emissions increased significantly, but no one knows how much they have contributed, no matter how much the Intergovernmental Panel on Climate Change (IPCC) insists that “humans are the dominant cause of observed global warming over recent decades.” (IPCC AR6, page 515).
There is no evidence for this statement. I know this because I have read thousands of scientific papers looking for it. And no, computer models are not evidence of anything but the programming skills of their authors. Models and their predictions are constantly changing and when our knowledge of climate changes, they must be redone.
The absolute lack of evidence contrasts sharply with the decision to cut our CO2 emissions to zero by completely changing our fossil fuel-based energy system and calling CO2 a pollutant—when it is as essential to life as oxygen. All this while most of the world doesn’t give a damn about emissions and many are only on board for the promised money.
To get to the good news about global warming we need to look at variations in the rate of global warming, i.e., the speed of warming. Today we are going to use satellite-calculated global temperature data from the University of Alabama in Huntsville, UAH 6.0. They are plotted in Figure 1.

Figure 1. UAH satellite global temperature anomaly data in °C relative to the mean from 1991 to 2020. In green is the linear trend of the series (+0.13 ºC/decade) and in blue is the linear trend since 2016. Data: UAH 6.0Graph: Woodfortrees.
As we can see, the temperature trend decreases since 2016, so 2022 is the seventh warmest year. For 7 years the planet has been cooling. Does that mean that warming is over? No, periods of 7 years of cooling are frequent in the record, there being 8 of them since 1979, and the warming continues. But there is only one period of more than 15 years of cooling, from 1998 to 2014, that appears in the record for the last 45 years. It is known as the “Pause.”
To analyze the evolution of the warming rate, we subtract from each monthly data the previous one to calculate the monthly increase. We then deseasonalize the monthly increase by finding the 12-month moving average to remove a lot of the noise. Finally, we calculate the 15-year average warming rate in °C/decade by calculating the 180-month moving average and multiplying the resulting data by 120.

Figure 2. Evolution of the warming rate for 15-year periods between 1979 and 2022 in °C/decade and its linear trend, from monthly UAH 6.0 satellite temperature data.
…
by K. Richard, Nov 14, 2022 in NoTricksZone
Two new studies indicate there has been no modern warming in the last centuries in western (Urals) and eastern (Kolyma) Russian mountain ranges.
A new 27,000-year temperature reconstruction assesses it was ~2.5 to 4.8°C warmer than today from 8.9-5.2 ka BP in the Ural Mountains, or when CO2 is said to have hovered in the 265 ppm range.
Summer temperatures were also warmer during the Medieval Warm Period, or from 1.2-0.7 ka BP. After a post-Medieval cool-down fostering in the Little Ice Age, the reconstructed record suggests there has been no warming since 0.5 cal ka BP, or for the last several centuries.
The smoothed temperature record shown in the study indicates there was only one brief period in the last 10,000 years that was not warmer than today.
“The reconstructed TJuly [8.9-5.2 cal ka BP] are the highest recorded, reaching up to 4.8 °C higher than today’s air temperature. … Present day T July have persisted since 0.5 cal ka BP.”
…
by P. Driessen, Oct 26, 2022 in ClimateChangeDispatch
The climate crisis! Save our planet! Stop using fossil fuels! The ranting never ends.
Present data show that hurricane frequency and intensity are not increasing, and tornado activity has declined significantly since 1975.
Offer clear evidence of past, recurring major climate changes, including a widespread Little Ice Age from 1300 to 1850, a 2,400-year-old forest emerging from beneath a melting Alaskan glacier, a 5,200-year-old mummified traveler frozen on a once-nearly-ice-free Italian Alps trail – and they respond, Shut up! The climate crisis! The science is settled! Stop using fossil fuels! [bold, links added]
Fine. But take a few minutes to ponder REAL climate disasters: the Pleistocene Ice Ages.
And then ask Michael Mann, Al Gore, John Kerry, and the rest of the climate cataclysm cabal to explain exactly how carbon dioxide and a few other greenhouse gases caused those massive ice sheets to grow and melt, multiple times. Just CO2 and GHG, all by themselves. They can’t do it. The CO2-driven crisis is a fable.
Widespread glaciation began some 1,800,000 years ago in North America and Europe, and about 800,000 years earlier on other continents. There were at least four, possibly five, major glacial periods, interspersed with warm intervals (like the one we’re in now) during which the glaciers mostly melted.
That last glacial epoch is named the Wisconsinan because some of the most exemplary features are in my home state. It marks the furthest extent of glaciers southward into the United States and east and west across Canada.
…
…
https://www.steynonline.com/12856/a-sennight-of-steyn-september-25-october-1
<www.generalistjournal.com>
Book: ‘The Deliberate Corruption of Climate Science’
Book: ‘Human Caused Global Warming, the Biggest Deception in History’
https://www.technocracy.news/dr-tim-ball-on-climate-lies-wrapped-in-deception-smothered-with-delusion/
https://www.youtube.com/watch?v=tPzpPXuASY
https://www.technocracy.news/tim-ball-the-evidence-proves-that-co2-is-not-a-greenhouse-gas
https://www.youtube.com/watch?v=qOEFQDcT_lM
by K. Richard, Oct 24, 2022 in NoTricksZone
The Earth was still in ice age conditions 14,700 to 12,900 years ago, or during the “Bolling interstadial.” CO2 hovered near 230 ppm at that time, and yet “continental Europe was a few degrees warmer than present” (Toth et al., 2022).
In recent years there have been multiple studies detailing a European climate that was as warm or warmer than today during the late Pleistocene ice age.
The latest study, Toth et al., 2022, uses chironomid proxy evidence to reconstruct summer temperatures at a lake site in the Eastern Carpathians.
These authors report that “continental Europe was a few degrees warmer than present during the Bolling interstadial,” and there were slightly (0.5°C) warmer-than-today periods (e.g., ~16,300 years ago) at the study site. The warming events were both pronounced (5°C) and abrupt.
…
by W. Manheimer, Sep 19, 2022 in ClimateChangeDispatch
The following excerpt is taken from:
Journal of Sustainable Development; Vol. 15, No. 5; 2022
ISSN 1913-9063 E-ISSN 1913-9071
Published by the Canadian Center of Science and EducationAbstract
The emphasis on a false climate crisis is becoming a tragedy for modern civilization, which depends on reliable, economic, and environmentally viable energy. [bold, links added]The windmills, solar panels, and backup batteries have none of these qualities. This falsehood is pushed by a powerful lobby which Bjorn Lomborg has called a climate industrial complex, comprising some scientists, most media, industrialists, and legislators.
It has somehow managed to convince many that CO2 in the atmosphere, a gas necessary for life on earth, one which we exhale with every breath, is an environmental poison. Multiple scientific theories and measurements show that there is no climate crisis.
Radiation forcing calculations by both skeptics and believers show that the carbon dioxide radiation forcing is about 0.3% of the incident radiation, far less than other effects on climate.
Over the period of human civilization, the temperature has oscillated between quite a few warm and cold periods, with many of the warm periods being warmer than today.
During geological times, it and the carbon dioxide levels have been all over the place with no correlation between them.
…
by K. Richard, Sep 15, 2022 in NoTricksZone
Since 1979 there has been no net warming in the South China Sea and no evidence of a hiatus or “growth discontinuity” in this region’s coral development (Tan et al., 2022). Natural ENSO variation leads changes in the sea surface temperature by about 5-6 months.
…
by P. Homewood, Aug 15, 2022 in NotaLotofPeopleKnowThat
The BBC would like you to think so, with statements like these:
So far this year, the amount of land burnt by fires across the European Union is more than three times greater than what you would expect by the middle of July.
Almost 346,000 hectares (1,370 sq miles) of land have been recorded as burnt (as of 16 July), according to the European Forest Fire Information System (EFFIS).
Much of Western Europe has been hit by a record-breaking heatwave, which substantially increases the risk of fires….
“Heatwaves and droughts are exacerbated by climate change and are absolutely the defining factor in years with massive wildfire outbreaks, like the present one,” Dr Jones says….
“But we definitely see trends in fire weather risk because of climate change.
“The risk is higher in the Mediterranean region than the rest of Europe.”
Studies show increasing fire risk for central and southern regions of Europe over the past couple of decades.
Yet tucked away in the same article is this graph which proves all of these have no basis in fact:
…
by H. Harde, June 20,2022 in NoTricksZone
Professor Herman Harde, an environmental physicist, has authored a new position paper on the follies of assuming humans significantly impact the climate.
As detailed in his 2017 paper, Dr. Harde concludes the “anthropogenic contribution to the actual CO2 concentration is found to be 4.3% [a figure derived from IPCC AR5], its fraction to the CO2 increase over the Industrial Era is 15% and the average residence time 4 years.”
The IPCC overestimates the thermal effect of doubling CO2 by a factor of 5, as the consequent surface air temperature increase for a 120 ppm increase in CO2 is less than 0.3°C.
“Since only about 15% of the global CO2 increase is of anthropogenic origin, just 15% of 0.3°C, i.e., less than 0.05°C remains, which can be attributed to humans in the overall balance.”
“Changes of our climate can be traced back to natural interaction processes that exceed our human influence by orders of magnitude.”
by K. Richard, May 22, 2022 in NoTricksZone
A new study indicates nearly all the Northern Hemisphere and Tropical warming in the last 40 years occurred by the late 1990s.
CO2 has risen by about 50 ppm since 1998 (367 to 418 ppm).
Interestingly, upper-air measurements of temperature from balloon-borne sensor radiosonde data, shown below in the image from a new study (Madonna et al., 2022), suggest there was more warming from the early 1980s to late 1990s – when CO2 only rose about 25 ppm (341 to 367 ppm) – than there has been this century.
Radiosonde measurements appear to depict mostly flat temperatures trends since 1998 in both the Northern Hemisphere (25°N to 70°N) and tropics (25°S to 25°N).
….
Image Source: Madonna et al., 2022
…
by University of Copenhagen, Mar 10, 2022 in ScienceDaily
Ice cores allow climate researchers to look 800,000 years back in time: atmospheric carbon acts as fertilizer, increasing biological production. The mechanism removes carbon from the air and thereby dampens the acceleration in global warming.
Even under ice age conditions will plants, plankton, and other life forms be able to increase production whenever atmospheric carbon concentrations rise. The mechanism will not prevent an ongoing trend of global warming, but at least dampen the acceleration. This conclusion stems from an international collaboration involving the Physics of Ice Climate Earth (PICE) center of Niels Bohr Institute, University of Copenhagen.
“Global biosphere production through photosynthesis is the strongest absorbing flux of atmospheric carbon dioxide. It is therefore essential to understand its natural variability for a better projection of the future carbon cycle,” says Postdoc researcher Ji-Woong Yang, PICE, continuing:
“Nowadays, as we have Earth observation satellites and other advanced equipment, the mechanism of carbon fertilization is well established. However, we were not sure that the same mechanism existed in past periods where the climate was very different and atmospheric carbon concentrations much lower. The new results confirm the existence of the strong correlation and allow us to model future developments with more confidence.”
Eight glacial cycles are covered
In collaboration with Laboratoire des Science du Climat et de l’Environnement, France, the PICE team has studied the ancient air trapped inside tiny air bubbles in an Antarctic ice core. The ice core represents the last 800,000 years of climatic development.
The scientists take advantage of the fact that the oxygen atom does not only exist in the most common form 16O with 8 protons and 8 neutrons but also as the isotopes 17O and 18O. The isotopic composition is a tracer for biosphere productivity. Uniquely, the method will show the global level of biological production in contrast to other methods which give more localized results.
Combining the air bubble measurements with modeling of oxygen behavior in both the biosphere and the stratosphere, the researchers were able to quantify the biosphere productivity evolution under both glacial periods (ice ages) and interglacial periods. In total, eight glacial cycles were covered.
“The results clearly demonstrate that productivity drops during glacial periods and increases during interglacial periods. Further, a strong correlation exists with past atmospheric carbon dioxide concentrations measured from multiple ice cores. In addition, the effect is more prominent during glacial periods where the level of carbon dioxide and the global biosphere productivity start to increase several thousand years before the ice caps begin to melt. This correlation is explained by the strong fertilization effect by atmospheric carbon dioxide,” says Ji-Woong Yang.
by Gavin, Feb 2, 2020 in RealClimate
We have now updated the model-observations comparison page for the 2021 SAT and MSU TMT datasets. Mostly this is just ‘another dot on the graphs’ but we have made a couple of updates of note. First, we have updated the observational products to their latest versions (i.e. HadCRUT5, NOAA-STAR 4.1 etc.), though we are still using NOAA’s GlobalTemp v5 – the Interim version will be available later this year. Secondly, we have added a comparison of the observations to the new CMIP6 model ensemble.
As we’ve discussed previously, the CMIP6 ensemble contains a dozen models (out of ~50) with climate sensitivities that are outside the CMIP5 range, and beyond the very likely constraints from the observations. This suggests that comparisons to the observations should be weighted in some way. One reasonable option is to follow the work of Tokarska et al (2020) and others, and restrict the comparison to those models that have a transient climate response (TCR) that is consistent with observations. The likely range of TCR is 1.4ºC to 2.2ºC according to IPCC AR6, and so we plot both the mean and 95% spread over all all models (1 ensemble member per model) (grey) and the TCR-screened subset (pink).
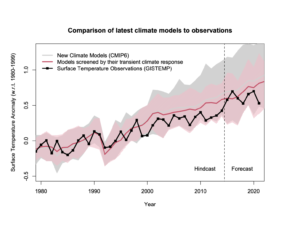
CMIP6 model means and spreads since 1979 (reader friendly version).
….
…
by University of Oxford, Jan 27, 2022 in WUWT
Radiocarbon dating from a prehistoric cemetery in Northern Russia reveals human stress caused by a global cooling event 8,200 years ago Early hunter gatherers developed more complex social systems and, unusually, a large cemetery when faced by climate
16:00 (GMT), Thursday 27 January 2022
Climate change in the Early Holocene
- Radiocarbon dating from a prehistoric cemetery in Northern Russia reveals human stress caused by a global cooling event 8,200 years ago
- Early hunter gatherers developed more complex social systems and, unusually, a large cemetery when faced by climate change
New insight into how our early ancestors dealt with major shifts in climate is revealed in research, published today [27 Jan] in Nature Ecology & Evolution, by an international team, led by Professor Rick Schulting from Oxford University’s School of Archaeology.
It reveals, new radiocarbon dates show the large Early Holocene cemetery of Yuzhniy Oleniy Ostrov, at Lake Onega, some 500 miles north of Moscow, previously thought to have been in use for many centuries, was, in fact, used for only one to two centuries. Moreover, this seems to be in response to a period of climate stress.
…
…
…
by Prof. F. Vahrenholt, Jan 8, 2022 in NoTricksZone
Globally, the deviation of the global mean temperature of the satellite-based measurements from the mean of period 1991-2020 rose slightly in December to 0.21 degrees Celsius. The mean temperature increase since satellite measurements began was 0.14 degrees Celsius per decade. The year 2021 was an average year compared to 2010 to 2020, with 0.134 degrees deviation from the thirty-year average. Six years since 2010 were warmer and 5 years were colder.
This is also true for Germany. But the German weather service gives a different impression
…
How the German DWD Weather Service turned cooling into warming in 2021
In its press release on Germany’s weather in 2021, the German Weather Service writes: “The mean temperature [Germany] in 2021 was 9.1 degrees Celsius (°C), 0.9 degrees above the value of the internationally valid reference period 1961 to 1990. 2021 was thus the eleventh year in a row that was too warm.”
Why does the DWD use the internationally no longer valid 1961-1990 reference period? It writes itself elsewhere: “To record the climate and its changes, mean values are formed over a period of 30 years…With the end of the year 2020, the reference period for current climatological assessments was replaced by the 1991 to 2020 period.”
Fudging with the reference period
The DWD thus followed the World Meteorological Organization (WMO)recommendation. But in the press release, the DWD still prefers to use the old, outdated period. The 1991 to 202 0reference period differs from the one of 1961 to 1990 by 1.1 degrees. So the DWD should have written : “2021 was 9.1 degrees, 1.3 degrees cooler than 2020 and even -0.2 degrees Celsius below the average from 1991 to 2020. Since 1991 there have only been 9 years colder than 2021.”
But 0.9 degrees more and the eleventh year in a row that is too warm (compared to the colder period of 1961-1990) of course fits much better with the zeitgeist.
Read original in German at Die kalte Sonne.