America is set to surpass Saudi Arabia in a ‘remarkable’ oil milestone

by Charles the moderator, March 11, 2019 in WUWT


From CNN Business

New York (CNN Business)Move over, Saudi Arabia. America is about to steal the kingdom’s energy exporting crown.

The United States will surpass Saudi Arabia later this year in exports of oil, natural gas liquids and petroleum products, like gasoline, according to energy research firm Rystad Energy.

That milestone, driven by the transformative shale boom, would make the United States the world’s leading exporter of oil and liquids. That has never happened since Saudi Arabia began selling oil overseas in the 1950s, Rystad said in a report Thursday.

“It’s nothing short of remarkable,” said Ryan Fitzmaurice, energy strategist at Rabobank. “Ten years ago, no one thought it could happen.”

The expected breakthrough reflects how technology has reshaped the global energy landscape. Drilling innovations have opened up huge swaths of oil and natural gas resources that had been trapped in shale oilfields in Texas, North Dakota and elsewhere.

Led by shale, US oil production has more than doubled over the past decade to all-time highs. The United States now pumps more oil than any other country, including Russia and Saudi Arabia.

“The shale boom has driven incredible increases in production,” said Fitzmaurice. “US production is off the charts.”

New Paper: Widespread Collapse Of Ice Sheets ~5000 Years Ago Added 3-4 Meters To Rising Seas

by K. Richard, March 11, 2019 in NoTricksZone


During the Mid-Holocene, when CO2 concentrations were stable and low (270 ppm), Antarctica’s massive Ross Ice Shelf naturally collapsed, adding the meltwater equivalent of 3-4 meters to sea levels.

Because CO2 concentrations changed very modestly during the pre-industrial Holocene (approximately ~25 ppm in 10,000 years), climate models that are predicated on the assumption that CO2 concentration changes drive ocean temperatures, ice sheet melt, and sea level rise necessarily simulate a very stable Holocene climate.

In contrast, changes in ocean temperatures, ice sheet melt, and sea level rise rates were far more abrupt and variable during the Holocene than during the last 100 years.

Modern ocean changes are barely detectable in the context of natural variability

Image Source(s): Rosenthal et al., 2013Climate Audit

Another Failed Energy Prediction: Peak Oil Demand

by David Middleton, March 11, 2019 in WUWT


Jude Clemente’s energy articles on Real Clear Energy and Forbes are always worth reading.

Key takeaways:

  1. Major oil company (particularly European majors) predictions of a near-term peak in oil demand are 99.999% driven by politics and the need to appease the investment community.
  2. According to baseball legend, the late, great Yogi Berra, “It’s tough to make predictions, especially about the future.” So, make sure your timeline is long enough to evade having to take responsibility for failed predictions.
  3. Malthuisan predictions have a 100% track record of being wrong.
  4. As these United States become a net exporter of crude oil in the near future, we will have no problem finding customers.

Here are the graphs from Mr. Clemente’s article:

Figure 2. US Energy Information Administration (EIA) 2019 global petroleum liquids demand forecast.

Henrik Svensmark: Force Majeure – The Sun’s Role In Climate Change (PDF)

in GWPF, March 11, 2019


London, 11 March: A new report from the Global Warming Policy Foundation reveals that the solar influence on climate is is much larger than is generally recognised.

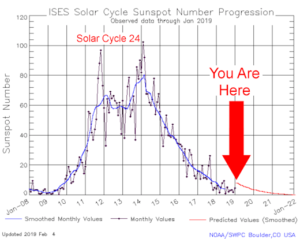
The report, by Professor Henrik Svensmark of the Danish National Space Institute, outlines some of the remarkable correlations between solar activity and past climate changes. It also shows that the output of the Sun alone – the so-called total solar irradiance – cannot explain them.

“Changes in total solar irradiance are actually quite small”, says Professor Svensmark. “They would have to be nearly 10 times larger to explain how the oceans warm and cool over the 11-year solar cycle.”

New research suggests that other mechanisms can amplify the effect of solar activity. The New report reviews the possible candidates, concluding that the most likely of these is the effects of galactic cosmic rays on cloud formation. This idea is plausible in theory and has received substantial empirical support in recent years.

However, Professor Svensmark says that insufficient attention is being paid to this research area:

“Galactic cosmic rays seem to be very important drivers of the Earth’s climate. But they are mostly being ignored at the moment because they are seen as distracting from conventional global warming research. Science needs to do better if we want to make progress in understanding the actual impact of natural factors of climate change.”

Henrik Svensmark: Force Majeure – The Sun’s Role In Climate Change (PDF)

About the author
Prof Henrik Svensmark is a physicist and a senior researcher in the Astrophysics and Atmospheric Physics Division of the National Space Institute (DTU Space) in Lyngby, Denmark. Svensmark presently leads the Sun–Climate Research group at DTU Space.

CHINA AND THE PAUSE

by GWPF, March 8, 2019


Chinese climate scientists are clearly off-message. They keep referring to the global warming hiatus which so many scientists and activists – those who shout on twitter and prowl the comment sections of off-colour articles on the subject – know has been trounced and discredited again and again. They clearly ought to have a word with the emerging science powerhouse that is China.

Writing recently in “Science of The Total Environment,” Li and Zha of Nanjing Normal University, say the global hiatus has played a prominent role in their thinking and they see it reflected in China. Using satellite data they found a hiatus in China between 2001-15. They found warming in western and southern China and a 15-year cooling trend in northern China. For China as a whole they estimate that the warming rate is just -0.02°C per decade. The conclude that, “there is a regional warming hiatus, a pause or slowdown in China, and (it) implies that greenhouse gas induced warming is suppressed by other natural forcing in the early 21st century.”

There is also Li et al writing in Climate Dynamics who are a little more forceful saying, “since the late 1990s, the global warming has ground to a halt, which has sparked a rising interest among the climate scientists. The hiatus is not only observed in globally average surface air temperature, but also in the China winter air temperature trend, which turns from warming during 1979-1997 to cooling during 1998-2013.” They attribute the effect to the melting of Arctic sea ice.

Gan et al (Lanzhou University and South Dakota State University), reporting in Earth and Space Science say that the hiatus, if not cooling, is seen over the Northern Hemisphere finding that the daily temperature minimum experienced an “obvious” decline in North America during the warming slowdown period. They relate the changes in daily temperature minimum to the Atlantic Multi-decadal Oscillation.

Global Warming off the hook? Alien species are primary cause of recent global extinctions

by University College London, March 3, 2019 in WUWT


Alien species are the main driver of recent extinctions in both animals and plants, according to a new study by UCL researchers.

They found that since 1500, alien species have been solely responsible for 126 extinctions, 13% of the total number studied.

Of 953 global extinctions, 300 happened in some part because of alien species, and of those 300, 42% had alien species alone listed as the cause of their demise.

The study, published today in Frontiers in Ecology and the Environment, used data from the 2017 IUCN Red List on the total numbers of species that are considered to have gone extinct globally since 1500.

In total, 261 out of 782 animal species (33.4%) and 39 out of 153 plant species (25.5%) listed aliens as one of their extinction drivers. In contrast, native species impacts were associated with only 2.7% of animal extinctions and 4.6% of plant extinctions.


2019 GLOBAL TEMPS PREDICTION: THE ENTRIES ARE IN

by GWPF, March 6, 2019


The Met Office says it’s going to get warmer this year. GWPF readers reckon not.

Back in early February, we invited readers to submit their entries for our 2019 global temperature prediction competition. The GWPF posse had soundly beaten the Met Office in last year’s competition, and you certainly seemed encouraged by your success, as there were 250 entries this time round, more than double last year’s entry.

For 2019, the Met Office have once again pushed the boat out on their predictions, suggesting that we might see a temperature rise of 0.19°C by the year end.

As you can see from the graph below, GWPF readers are a lot more cautious. The graph is a histogram of the entries, so the height of each blue bar is the number of readers making a particular prediction, the temperatures being given in terms of anomalies from the 1961-1990 average. The most common prediction was therefore for a slight decline in temperature over the course of the year, down to to 0.55°C from last year’s 0.6°C. The Met Office prediction is the grey band – they have given a single value this time round, rather than the range given in previous years.

A Month Without Sunspots

by Dr Tony Phillips, March 6, 2019 in SpaceWeatherArchive


March 1, 2019: There are 28 days in February. This year, all 28 of them were spotless. The sun had no sunspots for the entire month of Feb. 2019. This is how the solar disk looked every day:

How does this affect us on Earth? The biggest change may be cosmic rays. High energy particles from deep space penetrate the inner solar system with greater ease during periods of low solar activity. Indeed, NASA spacecraft and space weather balloons are detecting just such an increase in radiation. Cosmic rays can alter the flow of electricity through Earth’s atmosphere, trigger lightning, potentially alter cloud cover, and dose commercial air travelers with extra “rads on a plane.”

As February ended, March is beginning … with no sunspots. Welcome to Solar Minimum!

CLIMATE SCIENTIST NIC LEWIS: ‘EUROPEAN CO2 EMISSIONS DON’T MATTER’

by Edwin Timmer, March 9, 2019 in GWPF


“What really matters is: what happens in developing countries such as China, India, Indonesia, Brazil and Nigeria”, says Lewis, who gave a presentation at De Groene Rekenkamer Foundation this week in Amsterdam. According to him, it is much more important that developing countries quickly become richer and how rising CO2 emissions that this entails can be limited.

“We have a lot of knowledge and expertise in Europe. We can spend our money better than investing billions in subsidies and other climate policies that have virtually no effect on global emissions.”

Lewis would prefer to see investments in the development of clean nuclear energy or techniques to get CO2 out of the air and shut down coal-fired plants. “That could then be rolled out over the rest of the world.”

Circular reasoning with climate models

by Dr. Wojick, March 1, 2018 in CFact


Climate models play a central role in the attribution of global warming or climate change to human causes. The standard argument takes the following form: “We can get the model to do X, using human causes, but not without them, so human causes must be the cause of X.” A little digging reveals that this is actually a circular argument, because the models are set up in such a way that human causes are the only way to get change.

The finding is that humans are the cause of global warming and climate change is actually the assumption going in. This is circular reasoning personified, namely conclude what you first assume.

This circularity can be clearly seen in what many consider the most authoritative scientific report on climate change going, although it is actually just the most popular alarmist report. We are talking about the Summary for Policymakers (SPM), of the latest assessment report (AR5), of the heavily politicized UN Intergovernmental Panel on Climate Change (IPCC). Their 29 page AR5 SPM is available here.

40387018 – the raging whirlpool

Global-scale multidecadal variability missing in state-of-the-art climate models

by S. Kravstov et al. 2018, in Nature


Reliability of future global warming projections depends on how well climate models reproduce the observed climate change over the twentieth century. In this regard, deviations of the model-simulated climate change from observations, such as a recent “pause” in global warming, have received considerable attention. Such decadal mismatches between model-simulated and observed climate trends are common throughout the twentieth century, and their causes are still poorly understood. Here we show that the discrepancies between the observed and simulated climate variability on decadal and longer timescale have a coherent structure suggestive of a pronounced Global Multidecadal Oscillation. Surface temperature anomalies associated with this variability originate in the North Atlantic and spread out to the Pacific and Southern oceans and Antarctica, with Arctic following suit in about 25–35 years. While climate models exhibit various levels of decadal climate variability and some regional similarities to observations, none of the model simulations considered match the observed signal in terms of its magnitude, spatial patterns and their sequential time development. These results highlight a substantial degree of uncertainty in our interpretation of the observed climate change using current generation of climate models.

Our Planet Is Beautiful But Far From Fragile

by W.E. William, March 7, 2019 in ClimateChangeDispatch


Rep. Alexandria Ocasio-Cortez claims that “the world is going to end in 12 years if we don’t address climate change.”

The people at the Intergovernmental Panel on Climate Change agree, saying that to avoid some of the most devastating impacts of climate change, the world must slash carbon emissions by 45 percent by 2030 and completely decarbonize by 2050.

Such dire warnings are not new. In 1970, Harvard University biology professor George Wald, a Nobel laureate, predicted, “Civilization will end within 15 or 30 years unless immediate action is taken against problems facing mankind.”

Also in 1970, Paul Ehrlich, a Stanford University biologist, predicted in an article for The Progressive, “The death rate will increase until at least 100-200 million people per year will be starving to death during the next ten years.”

The year before, he had warned, “If I were a gambler, I would take even money that England will not exist in the year 2000.”

Climate Science’s Myth-Buster

by Guy Sorman, March 2019 in CityJournal


We’ve all come across the images of polar bears drifting on ice floes: emblematic victims of the global warming that’s melting the polar ice caps, symbols of the threat to the earth posed by our ceaseless energy production—above all, the carbon dioxide that factories and automobiles emit. We hear louder and louder demands to impose limits, to change our wasteful ways, so as to save not only the bears but also the planet and ourselves.

In political discourse and in the media, major storms and floods typically get presented as signs of impending doom, accompanied by invocations to the environment and calls to respect Mother Nature. Only catastrophes seem to grab our attention, though, and it’s rarely mentioned that warming would also bring some benefits, such as expanded production of grains in previously frozen regions of Canada and Russia. Nor do we hear that people die more often of cold weather than of hot weather. Isolated voices criticize the alarm over global warming, considering it a pseudoscientific thesis, the true aim of which is to thwart economic modernization and free-market growth and to extend the power of states over individual choices.

Not being a climatologist myself, I’ve always had trouble deciding between these arguments. And then I met Judith Curry at her home in Reno, Nevada. Curry is a true climatologist …

Energy Prices Falling Rapidly

by P. Homewood, March 7, 2019 in NotaLotofPeopleKnowThat


The renewable lobby often claims that the rising cost of fossil fuels will help make renewable energy competitive.

However, oil and gas prices remain stubbornly uncooperative. Gas prices in particular are back down to levels seen last spring, after peaking last autumn.

As is usually the way, power prices have followed the same pattern.

Oil and gas are very much cyclical markets. When supply is tight, prices rise, thus attracting more investment to increase production.

Prices therefore fall, cutting profitability and new investment, and setting the whole cycle back in motion again.

How long supply can keep meeting ever rising demand is a moot point. But there is little sign of anything changing in the foreseeable future.

http://www.catalyst-commercial.co.uk/reports/227/energy-market-report—mar19/

Unreliable Power Source…Adding Capacity Does Little To Solve Germany’s Green Energy Power Gaps

by P. Gosselin, March 6, 2019 in NoTricksZone


German wind park protest group MenschNatur posted here explaining how even adding more wind and solar capacity does not make Germany’s energy supply any more reliable, but in fact may even make it less so.

Time and again the proponents of the Energiewende (transition to green energies) promote the idea that we must invest massively in more wind and solar power plants and that only an accelerated expansion can save the transformation to green energies.

Thus the wind energy protest group MenschNatur has taken a closer look at the increase in installed nominal capacity over the past years and compared it to what actually gets fed into the grid.

How increases in wind generator capacity affects the feed-in power is described in the following diagram. MenschNatur plotted the installed capacity of all German onshore wind turbines from 2014 to 2018, along with what actually got fed in.

Figure 1: Expansion of rated installed wind power capacity and the power that actually got fed into the grid in Germany. Chart: MenschNatur, by Rolf Schuster.

Fracking the World: Despite Climate Risks, Fracking Is Going Global

by Justin Mikulka, March 4, 2019 in Desmog


The U.S. exported a record 3.6 million barrels per day of oil in February. This oil is the result of the American fracking boom — and as a report from Oil Change International recently noted — its continued growth is undermining global efforts to limit climate change. The Energy Information Administration predicts U.S. oil production will increase again in 2019 to record levels, largely driven by fracking in the Permian shale in Texas and New Mexico.

And the U.S. is not alone in trying to maximize oil and gas production. Despite the financial failures of the U.S. fracking industry, international efforts to duplicate the American fracking story are ramping up across the globe.

The CEO of Saudi Arabian state oil company Aramco recently dismissed the idea that global demand for oil will decrease anytime soon and urged the oil industry to “push back on exaggerated theories like peak oil demand.”

But Saudi Aramco also is gearing up for a shopping spree of natural gas assets, including big investments in the U.S., and increasing gas production via fracking in its own shale fields. Aramco is deeply invested in keeping the world hungry for more oil and gas.

Khalid al Falih, Saudi Arabia’s energy minister, told the Financial Times, “Going forward the world is going to be Saudi Aramco’s playground.” But not if other countries frack there first.

China Expanding Fracking Efforts, Testing New Technology

Une Belgique trop ambitieuse sur le climat

by Prof. Samuel Furfari, 6 mars 2019 in L’Echo


En Belgique francophone, l’intérêt pour la question climatique ne cesse de croître. A la faveur du succès remporté par les écolos aux élections communales d’octobre dernier, les partis francophones se sont lancés dans une surenchère de promesses. A cela viennent se greffer les marches pro-environnement enthousiastes mais néanmoins naïves de lycéens qui, en matière d’énergie et de climat, connaissent très peu de choses. Avec un peu plus de connaissances, ils demanderaient des fenêtres hermétiques et à double vitrage dans leurs classes, au lieu de panneaux photovoltaïques, on y reviendra. En quelques jours on est passé d’un gouvernement critiqué pour être timide à une proposition de loi climat qui n’a pas d’équivalent dans le reste du monde. Car ne nous y trompons pas, la frénésie climatique est belge. Même si on ne devrait pas être étonné que Trump n’ait pas prononcé le mot climat dans son récent discours de l’Union, ce que j’observe professionnellement dans le monde ne correspond en rien à ce que vit la Belgique. Il y a lieu de s’interroger sur les motifs réels de ce déferlement ; ce n’est pas audible pour l’instant mais on devra y répondre un jour.


The ‘trick’: How More Cooling Generates Global Warming

by Jennifer Marohasy, March 5, 2019 in WUWT


The Bureau of Meteorology has rewritten Australia’s temperature in this way for the second time in just six years – increasing the rate of warming by 23 percent between Version 1 and the new Version 2 of the official ACORN-SAT temperature record.

Temperatures from the Rutherglen research station in rural Victoria are one of the 112 weather stations that make-up ACORN-SAT. Temperature have been changed here by Blair Trewin, under the supervision of David Jones at the Bureau.


Annual average minimum temperatures at Rutherglen (1913 to 2017). Raw temperatures (green) show a mild cooling trend of 0.28 degrees Celsius per 100 years. This cooling trend has been changed to warming of 1.7 degrees Celsius per 100 years in ACORN-SAT Version 1 (orange). These temperatures have been further remodeled in ACORN-SAT Version 1 (red) to give even more dramatic warming, which is now 1.9 degrees Celsius.

ClimateGate continues – the Mann Hockeystick University of Arizona emails are now public

by Anthony Watts, March4, 2019 in WUWT


After years of trying to suppress their release, and finally being ordered to be released by a judge, they are now public, and we have them here. This will remain as a “top post” for a day, new stories will be below this one.

There’s quite a treasure trove, but also some duplications from previous releases.

Arctic Sea Ice Extent Same As In 2005

by P. Homewood, March 5, 2019 in NotaLotofPeopleKnowThat


You may wonder why you have not heard much about Arctic sea ice death spirals and Greenland heatwaves this winter.

Hardly surprising, because the Arctic stubbornly refuses to follow the agenda.

Average sea ice extent last month was the highest since 2013, and stands as high as it did in 2005.

http://ocean.dmi.dk/arctic/icecover_30y.uk.php

New Santer Study: 97% Consensus is now 99.99997%

by Dr. Roy Spencer, February 27, 2019 in GlobalWarming


A new paper in Nature Climate Change by Santer et al. (paywalled) claims that the 40 year record of global tropospheric temperatures agrees with climate model simulations of anthropogenic global warming so well that there is less than a 1 in 3.5 million chance (5 sigma, one-tailed test) that the agreement between models and satellites is just by chance.

And, yes, that applies to our (UAH) dataset as well.

While it’s nice that the authors commemorate 40 years of satellite temperature monitoring method (which John Christy and I originally developed), I’m dismayed that this published result could feed a new “one in a million” meme that rivals the “97% of scientists agree” meme, which has been a very successful talking point for politicians, journalists, and liberal arts majors.

John Christy and I examined the study to see just what was done. I will give you the bottom line first, in case you don’t have time to wade through the details:

The new Santer et al. study merely shows that the satellite data have indeed detected warming (not saying how much) that the models can currently only explain with increasing CO2 (since they cannot yet reproduce natural climate variability on multi-decadal time scales).

That’s all.

But we already knew that, didn’t we? So why publish a paper that goes to such great lengths to demonstrate it with an absurdly exaggerated statistic such as 1 in 3.5 million (which corresponds to 99.99997% confidence)? I’ll leave that as a rhetorical question for you to ponder.

Warming Predictions Defied: Japan Winters Cool, Great Lakes Ice Grows And Cal Snow Pack Hits Record

by P. Gosselin, March 2, 2019 in NoTricksZone


Japan winters are cooling

The Pacific island nation of Japan refuses to obey climate scientists’ forecasts of warming and ignore climate alarmists and their chorus of doomsday shrieks. Climate trends are moving the other way.

Now that February has ended, the 2018/19 winter is now in the books. We’ve tabulated the winter temperature data for Japan going back 32 years. The following chart tells a story that was not supposed to happen:

Japan’s mean winter temperature has been falling for more than 30 years, according to the data from the Japan Meteorology Agency (JMA).

While alarmists insist it’s heating up everywhere, the reality is actually just the opposite, and not just in Japan.

Finland is cooling

The Scandinavian country of Finland, which extends up into the Arctic, also shows no signs of warming at all since December, 1988.

Critique of the new Santer et al. (2019) paper

by Ross McKitrick, March1, 2019 in WUWT


Ben Santer et al. have a new paper out in Nature Climate Change arguing that with 40 years of satellite data available they can detect the anthropogenic influence in the mid-troposphere at a 5-sigma level of confidence. This, they point out, is the “gold standard” of proof in particle physics, even invoking for comparison the Higgs boson discovery in their Supplementary information.

Conclusion

The fact that in my example the t-statistic on anthro falls to a low level does not “prove” that anthropogenic forcing has no effect on tropospheric temperatures. It does show that in the framework of my model the effects are not statistically significant. If you think the model is correctly-specified and the data set is appropriate you will have reason to accept the result, at least provisionally. If you have reason to doubt the correctness of the specification then you are not obliged to accept the result.

This is the nature of evidence from statistical modeling: it is contingent on the specification and assumptions. In my view the second regression is a more valid specification than the first one, so faced with a choice between the two, the second set of results is more valid. But there may be other, more valid specifications that yield different results.

In the same way, since I have reason to doubt the validity of the Santer et al. model I don’t accept their conclusions. They haven’t shown what they say they showed. In particular they have not identified a unique anthropogenic fingerprint, or provided a credible control for natural variability over the sample period. Nor have they justified the use of Gaussian p-values. Their claim to have attained a “gold standard” of proof are unwarranted, in part because statistical modeling can never do that, and in part because of the specific problems in their model.

L’art de gommer les incertitudes

by Jean, N. 2 mars 5019 in ScienceClimatEnergie


Comme déjà mentionné dans un article précédent publié sur SCE, la variation de la couverture nuageuse a probablement un effet majeur sur la température moyenne globale de la basse atmosphère. Si l’on veut prédire le climat du futur comme le prétend le GIEC il faut savoir modéliser la formation des nuages. Que nous dit le dernier rapport scientifique (AR5) du GIEC à ce sujet? Le but du présent article est simplement de vous présenter quelques phrases tirées de ce rapport. La science est-elle dite?

1. Le chapitre 7 du rapport AR5 publié par le GIEC en 2013

Le chapitre 7 du rapport AR5 du GIEC[1] fait 60 pages et est consacré aux nuages et aux aérosols (le rapport AR5 complet fait au total 1535 pages). Ce chapitre 7 comporte 22 pages de références et cite plus de 1100 articles scientifiques publiés dans des revues aussi prestigieuses que Science, Nature ou PNAS. Le chapitre 7 a été écrit sous la direction de Olivier Boucher (France) et David Randall (USA), deux spécialistes du domaine. Nous n’allons pas ici remettre en question la validité de ce chapitre. Nous allons simplement vous présenter quelques phrases tirées du rapport. Comme le rapport est écrit en anglais nous vous proposerons ci-dessous une “traduction maison” des phrases qui nous paraissent les plus importantes, assorties parfois de quelques explications pour bien les comprendre. Les lettres entre crochets ([A] à [P]) renvoient simplement au texte original en anglais, donné en Annexe du présent article.

La géologie, une science plus que passionnante … et diverse