The Greenhouse Effect In A Water World

by B. Irvine, May 17, 2021 in WUWT


A knowledge of Greenhouse gases is fundamental to any understanding of global surface temperatures. The presence of GHGs in our atmosphere has increased the global surface temperature by about 33C.

There are multiple lines of evidence, however, that challenge the strong water vapour feedback to a small initial CO2 forcing.  These strong positive feedbacks are central to the IPCC narrative.

These lines of evidence include.

  • The failure of all models and catastrophic warming projections.
  • The stubborn refusal of atmospheric Precipitable Water Vapour (PWV) concentration to rise in recent years.
  • The strength of convection cells in the tropics that have kept tropical temperatures approximately the same for many millions of years.
  • Irrigation and extra humidity generally coincide with cooler temperatures.
  • The hot spot as a signature of the positive Water Vapour (WV) feedback and its opposite, the negative lapse rate feedback, has not occurred.

INTRODUCTION

Greta Hasn’t Seen April Warming In Her Life. Global Surface Temperatures Plummet 0.75°C Since 2016

by P. Gosselin, May 14, 2021 in NoTricksZone


The April, 2021, mean temperature data collected by the Japan Meteorological Agency (JMA) has been tabulated and are ready to be added to our monthly plots.

Today we look at the April mean temperature trends for stations which the JMA has sufficient data and which are located in northern countries. Global warming is thought to be first visible at the far northern and Arctic regions.

Rising Sea Levels No Cause For Apocalyptic Climate Claims

by J. Tennebaum, May 12, 2021 in ClimateChangeDispatch


Former US Energy Department chief scientist Steven Koonin says sea levels rise at changing rates and sees ‘no signs’ of a climate apocalypse.

Here we continue our interview with Dr. Steven Koonin, chief scientist in the US Department of Energy during the Barack Obama administration and author of the just-published book, Unsettled: What Climate Science Tells Us, What It Doesn’t, And Why It Matters

….

….


Does ocean acidification alter fish behavior? Fraud allegations create a sea of doubt

by P. Homewood, May 7, 2021 in NotaLotofPeopleKnowThat


When Philip Munday discussed his research on ocean acidification with more than 70 colleagues and students in a December 2020 Zoom meeting, he wasn’t just giving a confident overview of a decade’s worth of science. Munday, a marine ecologist at James Cook University (JCU), Townsville, was speaking to defend his scientific legacy.

But their work has come under attack. In January 2020, a group of seven young scientists, led by fish physiologist Timothy Clark of Deakin University in Geelong, Australia, published a Nature paper reporting that in a massive, 3-year study, they didn’t see these dramatic effects of acidification on fish behavior at all.

German Professor: Climate Model Deviation From Observations “Striking”…”Politically Significant”

by P. Gosselin, May 8, 2021 in NoTricksZone


At Die kalte Sonne, Prof. Fritz Vahrenholt – one of the founders of Germany’s modern environmental movement – presents his monthly summary, which includes a look at global temperature and how the models are doing.

The global mean temperature deviation of satellite-based measurements from the mean of the 1991 – 2020 period was -0.05 degrees Celsius in April 2021. Nevertheless, German courts have ruled that something has got to be done about the warming planet!

Global temperature curve in April 2021

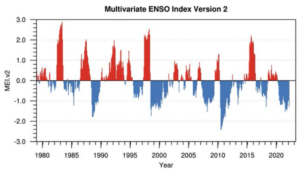
The cool La Niña situation over the recent months is still having an effect. According to the U.S. National Oceanic and Atmospheric Administration (NOAA), there is an 80% probability that La Niña will end between May and July. However, the agency expects a new La Niña to begin again in the fall.

The average temperature increase has been 0.14 degrees Celsius per decade. The model calculations, on which the IPCC’s recommendations are based, come up with a temperature increase that is twice as high for the same period (see chart below, source: R. Spencer 2021).

This striking deviation from the real temperature development is politically significant, because model forecasts are the basis for far-reaching decisions, such as constitutional court rulings.”

EIA: U.S. CO2 Emissions Dropped 11% In 2020; No Change In Rising Atmospheric CO2

by A. Watts, Apr 16, 2021 in ClimateChangeDispatch


Climate change action proponents regularly tell us we have to reduce our carbon dioxide (CO2) emissions to prevent “climate change”, even to the point of curtailing industry, travel, and food consumption.

Fortunately, a real-world test of just those very things happened in 2020 due to the COVID-19 related lockdowns.

In a report released April 12th by the U.S. Energy Information Administration (EIA) the Monthly Energy Review, they report that energy-related CO2 emissions decreased by 11% in the United States in 2020 primarily because of the effects of the COVID-19 pandemic and related restrictions.

Furthermore, U.S. energy-related CO2 emissions fell in every end-use (consumer) sector for the first time since 2012. The EIA notes:

“CO2 emissions associated with energy use fell by 12% in the commercial sector in 2020. Part of this drop in emissions was due to pandemic restrictions.

“Because electricity is a large source of energy for the commercial sector, the declining carbon intensity of electric power also contributed to declining CO2 emissions from commercial activity. Emissions from commercial electricity use fell by 13%. Commercial petroleum and natural gas emissions fell by 13% and 11%, respectively.

“Within the U.S. power sector, emissions from coal declined the most, by almost a fifth, at 19%. Natural gas-related CO2 emissions rose by 3%. Also of note in 2020; fossil fuel generation declined, while power generation from renewables from wind and solar continued to grow.”

COSMIC RAY FLUX AND GLOBAL COOLING: THE IMPLICATIONS ARE UPON US

by Cap Allon, Apr 30, 2021 in Electroverse


GALACTIC Cosmic Rays are a mixture of high-energy photons and sub-atomic particles accelerated toward Earth by supernova explosions and other violent events in the cosmos, while SOLAR Cosmic Rays are effectively the same, only their source is the Sun.

Spaceweather.com and the students of Earth to Sky Calculus have been launching cosmic ray balloons almost weekly since March 2015–before the pandemic threw a spanner in. The team’s published results reveal that atmospheric radiation reached record highs just as solar activity hit a new space age low — the correlation is clear for all to see, with additional proxy data revealing it has been the case for time-immemorial.

During solar minimums –the low point of the 11 year solar cycle– the Sun’s magnetic field weakens and the outward pressure of the solar wind decreases. This allows more cosmic rays (CRs) to penetrate the inner solar system, including our planet’s atmosphere:

Cosmic Rays correlating with Sunspots.

Surprising Results: Global Snowfall Rate Increases 3% Over The Past 40 Years

by P. Gosselin, May 5, 2021 in NoTricksZone


Blogger Zoe Phin was curious about global snowfall trend in our era of “extreme global warming”. The results of a comprehensive analysis provide a surprise. 

To find out what the global snowfall trend has been, the hotshot data analyst diligently downloaded all available monthly NASA images from 1980 to 2020 (inclusive), such as the one shown below, and then converted the pixel colors back to data using the provided scale.

Here over the past 40 years snowfall has indeed grown from 0.6257 to 0.7057 decigrams/m2/s, or +12.77%. This trend, like many, is not global.

It just goes to show that when it comes to the chaotic system of climate, things are never simple and researchers get surprised almost daily.

You can generate your own charts using data archived here.

Climate Change, Energy and the Environment Lectures

by Popular Technology.net Aug 21, 2016


The following lectures from the Prager University Foundation cover climate change, energy and the environment. The Prager University Foundation, a 501(c)(3) non-profit organization has created an online resource of concise five minute lectures on environmental science topics presented by scientific experts and professionals. These offer fresh perspectives supported by fact based reasoning on contentious issues to anyone with an open mind.

A world of new perspectives, five minutes at a time.” – Prager University Foundation

See the videos

IT’S GETTING HARDER AND HARDER TO MAINTAIN THE LIE: GLOBAL TEMPERATURES SINK FURTHER IN APRIL

by Cap Allon, May,  3, 2021, in Electroverse


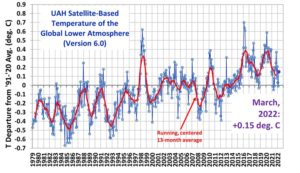
The Version 6.0 global average lower tropospheric temperature (LT) anomaly for April, 2021 has come in at -0.05 deg. C, sinking further below the 30-year baseline down from the March, 2021 value of -0.01 deg. C, and down substantially (approx. 0.65C deg. C) from where we were around a year ago…

…in other words, it is get harder and harder for the politicized ‘catastrophic global heating’ narrative to be maintained. But as Gustave Le Bo writes: “The masses have never thirsted after truth. They turn aside from evidence that is not to their taste, preferring to deify error, if error seduces them. Whoever can supply them with illusions is easily their master; whoever attempts to destroy their illusions is always their victim.”

A continuation of this downward plunge is probable over the coming months (with the odd bump along the way–climate is cyclic after all) as low solar activity and La Nina conditions continues to influence our climate.

According to the 15x NASA/NOAA AMSU satellites that measure every square inch of the lower troposphere (where us humans reside), planet Earth was actually warmer back in 1980:

Solar Cycle 25 may have finally started stirring (see link below), but sunspots (a great barometer for solar activity) look set to closely track the forecasts: i.e., the cycle is due to be another weak one, similar in vein to the cycle just gone (24), which will continue the global cooling trend that is now firmly established.

19th century glacier retreat in the Alps preceded the emergence of industrial black carbon deposition on high-alpine glaciers

by M. Sigl et al., Jan 8, 2018 in TheCryosphere


Starting around AD 1860, many glaciers in the European Alps began to retreat from their maximum mid-19th century terminus positions, thereby visualizing the end of the Little Ice Age in Europe. Radiative forcing by increasing deposition of industrial black carbon to snow has been suggested as the main driver of the abrupt glacier retreats in the Alps. The basis for this hypothesis was model simulations using elemental carbon concentrations at low temporal resolution from two ice cores in the Alps.

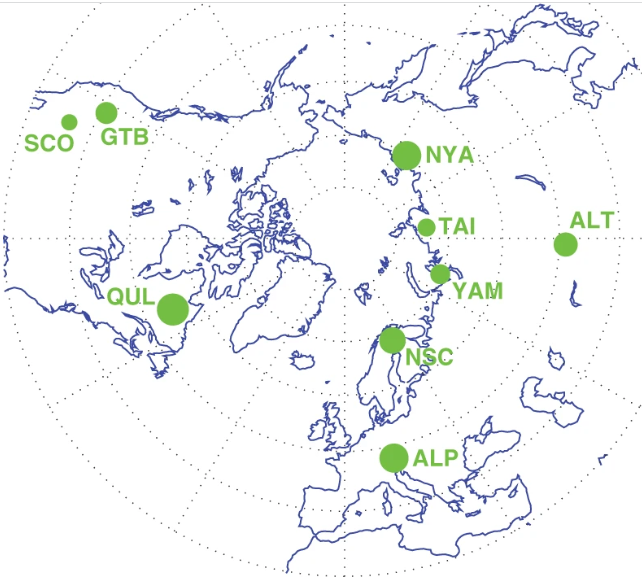
Here we present sub-annually resolved concentration records of refractory black carbon (rBC; using soot photometry) as well as distinctive tracers for mineral dust, biomass burning and industrial pollution from the Colle Gnifetti ice core in the Alps from AD 1741 to 2015. These records allow precise assessment of a potential relation between the timing of observed acceleration of glacier melt in the mid-19th century with an increase of rBC deposition on the glacier caused by the industrialization of Western Europe. Our study reveals that in AD 1875, the time when rBC ice-core concentrations started to significantly increase, the majority of Alpine glaciers had already experienced more than 80 % of their total 19th century length reduction, casting doubt on a leading role for soot in terminating of the Little Ice Age. Attribution of glacial retreat requires expansion of the spatial network and sampling density of high alpine ice cores to balance potential biasing effects arising from transport, deposition, and snow conservation in individual ice-core records.

Medieval weather prediction

by A. Lawrence_Mathers, Apr 1, 2021 PhysicsToday


In August 1861 the London-based newspaper The Times published the world’s first “daily weather forecast.” The term itself was created by the enterprising meteorologist Robert FitzRoy, who wanted to distance his work from astrological “prognostications.” That story has led to a widespread assumption that weather forecasting is an entirely modern phenomenon and that in earlier periods only quackery or folklore-based weather signs were available.

UNPRECEDENTED COLD INVADES EUROPE: “EYELID FREEZING NIGHT BREAKS RECORDS”

by Cap Allon, Apr 29, 2021 in Electroverse


This year’s punishing winter has shown few signs of abating, even as May fast-approaches.

Across the European continent, the majority of nations are suffering their coldest April’s in decades–in around 100 years in Germany and the UK. This climatic reality (aka cooling) is in response to the historically low solar activity we’re been experiencing, as a decrease in output from the Sun weakens Earth’s jet streams and increases their tendency to flow in more of a weak and wavy manor — this “meridional” flow, as it’s known, increases the prevalence of Arctic outbreaks and “blocking” phenomenons.

The year 2021 is also further ‘uncorrelating’ the link between global temperatures and rising CO2 emissions. For decades, the agenda-driving doomsayers have decreed that our planet’s average temp will rise on an endless march upward unless crippling economic and social reforms were immediately implemented (recently renamed “the Great Reset”) — well, does this (chart linked below) look like catastrophic global warming to you?

The Supermoon and SLR

by Kip Hansen, Apr 30, 2021 in WUWT


Dr. Judith Curry sent out a tweet about this article at The Conversation:  “This supermoon has a twist – expect flooding, but a lunar cycle is masking effects of sea level rise“.  The piece is written by Brian McNoldy, a Senior Research Associate, University of Miami and written in conjunction with Covering Climate Now — the climate news propaganda effort headed up by the Columbia Journalism Review and The Guardian.  The Conversation is a member of Covering Climate Now  and a search of their website shows they have published, so far, a total of 86 articles in cooperation with that organization.

McNoldy does a good job explaining what Lunar Nodal Cycle is and how it affects apparent local Relative Sea Level Rise

Bottom Line:

Miami, Florida has high tide flooding because much of Miami Beach (particularly) is built within a foot or two of normal high tides, and some portions are below normal high tides.  So, of course, Miami will experience tidal flooding again at these predicted higher tides.  For Miami’s real Sea Level story, see my earlier essay:  Miami’s Vice.

REVEALED: Al Gore’s real climate catastrophe

by Ian Plimmer & John Ruddick, Apr 29, 2021 in SpectatorAustralia


Next month is the thirtieth anniversary of the most entertaining and damning chapter in Al Gore’s career.

By the mid-nineteenth century, our knowledge of atmospheric chemistry was sufficiently advanced for a few sharp minds to ponder whether an increase in carbon dioxide might increase global temperature.  The speculation remained entirely theoretical until 1957 when an international collaboration of top geophysicists — including the Soviets — used buoys, weather balloons and so forth to collect data.  The undertaking was led by Dr Roger Revelle then based at California’s Scripps Institute of Oceanography.  Today’s global warming debate is hyper-partisan but all agree Revelle’s standing is impeccable.

Before this research, many assumed the ocean was absorbing most of the increase in carbon dioxide caused by industrialisation.  Revelle’s data, however, indicated only half was. So what was happening to the other half?  Would the planet soon overheat?

Oceanic Warming? Well, sorta.

by W. Eschenbach, May 1, 2021 in WUWT


After my last post about the surface warming of the ocean, entitled “How Global Warming Isn’t“, I got to thinking about the warming of the upper part of the ocean. So I got the data for the ocean heat content (OHC) of the top 700 metres of the ocean from the marvelous site, KNMI. If you look under “Monthly Observations” you’ll find a host of most fascinating datasets. Under “Heat Content” on that page, you’ll find the National Oceanic Data Center (NODC) 0-700 metre depth OHC data. And down at the very bottom of that page is a link that will download a 196 megabyte gridded NetCDF file containing the data that I used. (Big file, click at your own risk.)

And what did I find? Well, I’m a visual kind of guy. I mean, I can do the math, but it only makes sense when it comes up as a picture on the silver screen. So here are my graphics. I’m interested in the changes in the oceanic heat content, so these are two views of those trends.

This is the bottom line. If the world’s creatures, both on land and at sea, were as temperature-sensitive as the alarmists would have us believe, those beings (and we humanoids as well) all would have gone extinct long ago. And near as I can tell, that hasn’t occurred … at least yet.

Gavin’s Falsifiable Science

by W. Eschenbach, Apr 2020 in WUWT


Gavin Schmidt is a computer programmer with the Goddard Institute of Space Sciences (GISS) and a noted climate alarmist. He has a Ph.D. in applied mathematics. He’s put together a twitter threadcontaining what he sees as some important points of the “testable, falsifiable science that supports a human cause of recent trends in global mean temperature”. He says that the slight ongoing rise in temperature is due to the increase in carbon dioxide (CO2) and other so-called “greenhouse gases”. For simplicity, I’ll call this the “CO2 Roolz Temperature” theory of climate. We’ve discussed Dr. Schmidt’s ideas before here on WUWT.

Now, Gavin and I have a bit of history. We first started corresponding by way of a climate mailing list moderated by Timo Hameraanta back around the turn of the century, before Facebook and Twitter.

The interesting part of our interaction was what convinced me that he was a lousy programmer. I asked him about his program, the GISS Global Climate Model. I was interested in how his model made sure that energy was conserved. I asked what happened at the end of each model timestep to verify that energy was neither created nor destroyed.

He said what I knew from my own experience in writing iterative models, that there is always some slight imbalance in energy from the beginning to the end of the timestep. If nothing else, the discrete digital nature of each calculation assures that there with be slight roundoff errors. If these are left uncorrected they can easily accumulate and bring the model down.

He said the way that the GISS model handled that imbalance was to take the excess or the shortage of energy and sprinkle it evenly over the entire planet.

Now, that seemed reasonable for trivial amounts of imbalance coming from digitization. But what if it were larger, and it arose from some problem with their calculations? What then?

So I asked him how large that energy imbalance typically was … and to my astonishment, he said he didn’t know.

Amazed, I asked if he had some computer version of a “Murphy Gauge” on the excess energy. A “Murphy Gauge” (below) is a gauge that allows for Murphy’s Law by letting you set an alarm if the variable goes outside of the expected range … which of course it will, Murphy says so. On the computer, the equivalent would be something in his model that would warn him if the excess or shortage of energy exceeded some set amount.

Obama administration scientist says climate ‘emergency’ is based on fallacy

by Dr S. Koonin, Apr 24, in NewYorkPost


‘The Science,” we’re told, is settled. How many times have you heard it?

Humans have broken the earth’s climate. Temperatures are rising, sea level is surging, ice is disappearing, and heat waves, storms, droughts, floods, and wildfires are an ever-worsening scourge on the world. Greenhouse gas emissions are causing all of this. And unless they’re eliminated promptly by radical changes to society and its energy systems, “The Science” says Earth is doomed. 

Yes, it’s true that the globe is warming, and that humans are exerting a warming influence upon it. But beyond that — to paraphrase the classic movie “The Princess Bride” — “I do not think ‘The Science’ says what you think it says.”

For example, both research literature and government reports state clearly that heat waves in the US are now no more common than they were in 1900, and that the warmest temperatures in the US have not risen in the past fifty years. When I tell people this, most are incredulous. Some gasp. And some get downright hostile.

These are almost certainly not the only climate facts you haven’t heard. Here are three more that might surprise you, drawn from recent published research or assessments of climate science published by the US government and the UN:

  •  Humans have had no detectable impact on hurricanes over the past century.
  • Greenland’s ice sheet isn’t shrinking any more rapidly today than it was 80 years ago.
  • The global area burned by wildfires has declined more than 25 percent since 2003 and 2020 was one of the lowest years on record.

Why haven’t you heard these facts before?

See also : New High Resolution Climate Simulation Projects Antarctic Ice To Remain Stable Rest Of The Century

POLAR CHILL GRIPS NEW ZEALAND + ANTARCTIC SEA ICE EXTENT HOLDING ABOVE 1979-1990 AVERAGE

by Cap Allon, Apr 28, 2021 in Electroverse


Winter is arriving early across New Zealand, particularly in the South Island where well-below average temperatures and even a dusting of out-of-season snow have set in.

A midnight snowstorm delivered a healthy dumping to the Porters Alpine Resort near Castle Hill Tuesday morning, while parts of inland Canterbury and Otago woke to freezing temperatures, down to -3.2C.

The mercury had plunged even further by Wednesday morning, as an Antarctic air mass took charge.

The conditions led to a hard, widespread frost, according to stuff.co.nz, one that stretched from the Canterbury region down to the Lakes District, and beyond.

Lows of -5.1C and -6.4C were registered at Mackenzie Basin and a MetService weather station near Twizel, respectively — also note, Twizel’s low of -6.2C is some 8.8C below the average for the time of year.

Other South Island locales to report freezing temperatures included Lauder, which dropped to -2.7C; Ranfurly with -3.1C; Alexandra with -2.3C; and Mount Cook Village, which registered -1.9C.

A few negative readings were logged in the North Island, too: a weather station near Waiouru dipped down to -0.7C early Wednesday morning.

With regards to the snow, it has for now been restricted to the highest elevations; however, Porters operations manager Blair James believes the recent cold snap –which he says has brought snow and well-below average cold for the past two weeks now– could be an early indicator of a good snowfall season to come.

The below photo was snapped at Mt. Hutt on Wednesday.

The resort, according to @SnowForecast on Twitter, had just received “more pre-season snowfall.”

EIA: U.S. CO2 Emissions Declined 11% in 2020 – No Change in Rising Atmospheric Carbon Dioxide

by Anthony Watts, Apr 10, 2021 in WUWT


Climate change action proponents regularly tell us we have to reduce our carbon dioxide (CO2) emissions to prevent “climate change”, even to the point of curtailing industry, travel, and food consumption. Fortunately, a real-world test of just those very things happened in 2020 due to the COVID-19 related lockdowns.

In a report released April 12th by the U.S. Energy Information Administration (EIA) the Monthly Energy Review, they report that energy-related CO2 emissions decreased by 11% in the United States in 2020 primarily because of the effects of the COVID-19 pandemic and related restrictions.

Furthermore, U.S. energy-related CO2 emissions fell in every end-use (consumer) sector for the first time since 2012. The EIA notes:

“CO2 emissions associated with energy use fell by 12% in the commercial sector in 2020. Part of this drop in emissions was due to pandemic restrictions. Because electricity is a large source of energy for the commercial sector, the declining carbon intensity of electric power also contributed to declining CO2emissions from commercial activity. Emissions from commercial electricity use fell by 13%. Commercial petroleum and natural gas emissions fell by 13% and 11%, respectively.”

“Within the U.S. power sector, emissions from coal declined the most, by almost a fifth, at 19%. Natural gas-related CO2 emissions rose by 3%. Also of note in 2020; fossil fuel generation declined, while power generation from renewables from wind and solar continued to grow.”


As seen in the graph above, CO2 in the atmosphere increased during 2020 during the economy crippling lockdowns at the same rate it has been for decades. There isn’t even a blip.

This lack of any reduction in atmospheric CO2 concentration clearly demonstrates that no matter how much the U.S. reduces CO2 emissions, no one living today will, at any point in life, see a measurable change in climate attributable to the reduction. This is especially true since other countries, such as China, who only give lip-service to the COemissions reduction demanded by the 2015 Paris Climate Accord.

The anatomy of past abrupt warmings recorded in Greenland ice

by C. Rotter, Apr 19, 2021 in WUWT/Nature


New paper at Nature Communications

Abstract

Data availability and temporal resolution make it challenging to unravel the anatomy (duration and temporal phasing) of the Last Glacial abrupt climate changes. Here, we address these limitations by investigating the anatomy of abrupt changes using sub-decadal-scale records from Greenland ice cores. We highlight the absence of a systematic pattern in the anatomy of abrupt changes as recorded in different ice parameters. This diversity in the sequence of changes seen in ice-core data is also observed in climate parameters derived from numerical simulations which exhibit self-sustained abrupt variability arising from internal atmosphere-ice-ocean interactions. Our analysis of two ice cores shows that the diversity of abrupt warming transitions represents variability inherent to the climate system and not archive-specific noise. Our results hint that during these abrupt events, it may not be possible to infer statistically-robust leads and lags between the different components of the climate system because of their tight coupling.

Extremest Weather 2020

by Ralph Alexander, April 2021 in GWPF


Contents

About the author iii Executive summary v 1. Introduction 1 2. Natural disaster analysis 2 3. Heatwave 6 4. Cold extremes 12 5. Drought 14 6. Precipitation and floods 16 7. Hurricanes 19 8. Tornadoes 23 9. Wildfires 26 10. Conclusions 31 Notes 33 Review process 38 About the Global Warming Policy Foundation 38

About the author

Retired physicist Dr. Ralph B. Alexander is the author of Global Warming False Alarm and Science Un- der Attack: The Age of Unreason. With a PhD in physics from the University of Oxford, he is also the author of numerous scientific papers and reports on complex technical issues. His thesis research in the interdisciplinary area of ion-solid interactions reflected his interest in a wide range of scien- tific topics.

Dr Alexander has been a researcher at major laboratories in Europe and Australia, a professor at Wayne State University in Detroit, the co-founder of an entrepreneurial materials company, and a market analyst in environmentally friendly materials for a small consulting firm.

La géologie, une science plus que passionnante … et diverse