Tous les articles par Alain Préat

Full-time professor at the Free University of Brussels, Belgium apreat@gmail.com apreat@ulb.ac.be • Department of Earth Sciences and Environment Res. Grp. - Biogeochemistry & Modeling of the Earth System Sedimentology & Basin Analysis • Alumnus, Collège des Alumni, Académie Royale de Sciences, des Lettres et des Beaux Arts de Belgique (mars 2013). http://www.academieroyale.be/cgi?usr=2a8crwkksq&lg=fr&pag=858&rec=0&frm=0&par=aybabtu&id=4471&flux=8365323 • Prof. Invited, Université de Mons-Hainaut (2010-present-day) • Prof. Coordinator and invited to the Royal Academy of Sciences of Belgium (Belgian College) (2009- present day) • Prof. partim to the DEA (third cycle) led by the University of Lille (9 universities from 1999 to 2004) - Prof. partim at the University of Paris-Sud/Orsay, European-Socrates Agreement (1995-1998) • Prof. partim at the University of Louvain, Convention ULB-UCL (1993-2000) • Since 2015 : Member of Comité éditorial de la Revue Géologie de la France http://geolfrance.brgm.fr • Since 2014 : Regular author of texts for ‘la Revue Science et Pseudosciences’ http://www.pseudo-sciences.org/ • Many field works (several weeks to 2 months) (Meso- and Paleozoic carbonates, Paleo- to Neoproterozoic carbonates) in Europe, USA (Nevada), Papouasia (Holocene), North Africa (Algeria, Morrocco, Tunisia), West Africa (Gabon, DRC, Congo-Brazzaville, South Africa, Angola), Iraq... Recently : field works (3 to 5 weeks) Congo- Brazzaville 2012, 2015, 2016 (carbonate Neoproterozoic). Degree in geological sciences at the Free University of Brussels (ULB) in 1974, I went to Algeria for two years teaching mining geology at the University of Constantine. Back in Belgium I worked for two years as an expert for the EEC (European Commission), first on the prospecting of Pb and Zn in carbonate environments, then the uranium exploration in Belgium. Then Assistant at ULB, Department of Geology I got the degree of Doctor of Sciences (Geology) in 1985. My thesis, devoted to the study of the Devonian carbonate sedimentology of northern France and southern Belgium, comprised a significant portion of field work whose interpretation and synthesis conducted to the establishment of model of carbonate platforms and ramps with reefal constructions. I then worked for Petrofina SA and shared a little more than two years in Angola as Director of the Research Laboratory of this oil company. The lab included 22 people (micropaleontology, sedimentology, petrophysics). My main activity was to interpret facies reservoirs from drillings in the Cretaceous, sometimes in the Tertiary. I carried out many studies for oil companies operating in this country. I returned to the ULB in 1988 as First Assistant and was appointed Professor in 1990. I carried out various missions for mining companies in Belgium and oil companies abroad and continued research, particularly through projects of the Scientific Research National Funds (FNRS). My research still concerns sedimentology, geochemistry and diagenesis of carbonate rocks which leads me to travel many countries in Europe or outside Europe, North Africa, Papua New Guinea and the USA, to conduct field missions. Since the late 90's, I expanded my field of research in addressing the problem of mass extinctions of organisms from the Upper Devonian series across Euramerica (from North America to Poland) and I also specialized in microbiological and geochemical analyses of ancient carbonate series developing a sustained collaboration with biologists of my university. We are at the origin of a paleoecological model based on the presence of iron-bacterial microfossils, which led me to travel many countries in Europe and North Africa. This model accounts for the red pigmentation of many marble and ornamental stones used in the world. This research also has implications on the emergence of Life from the earliest stages of formation of Earth, as well as in the field of exobiology or extraterrestrial life ... More recently I invested in the study from the Precambrian series of Gabon and Congo. These works with colleagues from BRGM (Orléans) are as much about the academic side (consequences of the appearance of oxygen in the Paleoproterozoic and study of Neoproterozoic glaciations) that the potential applications in reservoir rocks and source rocks of oil (in collaboration with oil companies). Finally I recently established a close collaboration with the Royal Institute of Natural Sciences of Belgium to study the susceptibility magnetic signal from various European Paleozoic series. All these works allowed me to gain a thorough understanding of carbonate rocks (petrology, micropaleontology, geobiology, geochemistry, sequence stratigraphy, diagenesis) as well in Precambrian (2.2 Ga and 0.6 Ga), Paleozoic (from Silurian to Carboniferous) and Mesozoic (Jurassic and Cretaceous) rocks. Recently (2010) I have established a collaboration with Iraqi Kurdistan as part of a government program to boost scientific research in this country. My research led me to publish about 180 papers in international and national journals and presented more than 170 conference papers. I am a holder of eight courses at the ULB (5 mandatory and 3 optional), excursions and field stages, I taught at the third cycle in several French universities and led or co-managed a score of 20 Doctoral (PhD) and Post-doctoral theses and has been the promotor of more than 50 Masters theses.

MOSCOW ON TRACK FOR COLDEST AUGUST ON RECORD IN BOOKS DATING BACK 150+ YEARS

by Cap Allon, August 13, 2019 in Electroverse


Eastern Europe has been experiencing a miserable summer so far, with temperatures holding well-below average for the majority of the season. And now, following a cold and wet June and July (in which many new daily low temperature records were set), Moscow is currently on course for it’s coldest August in recorded history.

The first week of August in Moscow was pretty chilly, with an average air temperature of just 13C (55.4F) — some 5C below the norm.

The city’s coldest August on record was way back in 1884, when the average daily air temperature for the month was some 4C below the norm. In fact, that August turned out to be colder than the May.

According to www.hmn.ru, the beginning of August in Moscow has been characterized by unusual weather in terms of not only the cold, but also of abundant rainfall and a lack of sunshine.

After the first 7 days, precipitation is already at average levels for the entire month, while the chronic lack of sunshine is within touching distance of Aug 2001’s record-low 181 hours (avg. sun hours for the month of August are 238 hours).

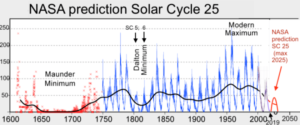
The cold times are returning, clouds are nucleating, all in line with historically low solar activity:


Why A ‘Super’ Grand Solar Minimum Is Upon Us

by Cap Allon, November 19, 2018 in PrincipiaScientificInternational


Professor Valentina Zharkova explains and confirms why a “Super” Grand Solar Minimum is upon us: “If the world was looking for an Epiphany moment, this should be it.”

Professor  Zharkova gave a presentation of her Climate and the Solar Magnetic Field hypothesis at the Global Warming Policy Foundation in October, 2018. Even if you believe the IPCC’s worst case scenario, Zharkova’s analysis blows any ‘warming’ out of the water.

Lee Wheelbarger sums it up: even if the IPCC’s worst case scenarios are seen, that’s only a 1.5 watts per square meter increase. Zharkova’s analysis shows a 8 watts per square meter decrease in TSI to the planet.

The information she unveiled should shake/wake you up. Zharkova was one of the few that correctly predicted solar cycle 24 would be weaker than cycle 23 – only 2 out of 150 models predicted this. Her models have run at a 93% accuracy and her findings suggest a SuperGrand Solar Minimum is on the cards beginning 2020 and running for 350-400 years.

Greenland’s ‘Record Temperature’ denied – the data was wrong

by Anthony Watts, August 12, 2019 in WUWT


From the “But, but, wait! Our algorithms can adjust for that!” department comes this tale of alarmist woe. Greenland’s all-time record temperature wasn’t a record at all, and it never got above freezing there.


First, the wailing from news media:

NYT: https://www.nytimes.com/2019/08/02/climate/european-heatwave-climate-change.html

WAPO: https://www.washingtonpost.com/news/capital-weather-gang/wp/2016/06/10/greenland-witnessed-its-highest-june-temperature-ever-recorded-on-thursday/

Climate Progress: https://thinkprogress.org/greenland-hits-record-75-f-sets-melt-record-as-globe-aims-at-hottest-year-e34e534e533e/

Polar Portal: http://polarportal.dk/en/news/news/record-high-temperature-for-june-in-greenland/


Now from the Danish Meteorological Institute (DMI), via the news website The Local, the cooler reality:

It’s raining plastic: microscopic fibers fall from the sky in Rocky Mountains

by The Guardian, August 13, 2019


Plastic was the furthest thing from Gregory Wetherbee’s mind when he began analyzing rainwater samples collected from the Rocky Mountains. “I guess I expected to see mostly soil and mineral particles,” said the US Geological Survey researcher. Instead, he found multicolored microscopic plastic fibers.

The discovery, published in a recent study (pdf) titled “It is raining plastic”, raises new questions about the amount of plastic waste permeating the air, water, and soil virtually everywhere on Earth.

“I think the most important result that we can share with the American public is that there’s more plastic out there than meets the eye,” said Wetherbee. “It’s in the rain, it’s in the snow. It’s a part of our environment now.”

Rainwater samples collected across Colorado and analyzed under a microscope contained a rainbow of plastic fibers, as well as beads and shards. The findings shocked Wetherbee, who had been collecting the samples in order to study nitrogen pollution.

Rainwater samples collected across Colorado and analyzed under a microscope contained a rainbow of plastic fibers. Photograph: USGS

Ten Causes of Warming: The Layperson’s Checklist

by Jim Steele, August 8, 2019 in WUWT


All temperatures are not created equally. Rising temperatures have many causes. Good science demands we explore alternative hypotheses before reaching any conclusions. Below is a list of common causes of warming trends and heat events that everyone should consider in addition to any possible increased greenhouse effect.

1. Heat trapping surfaces: Asphalt and cement not only heat up much faster than natural habitat during the day, those materials hold the heat longer, increasing temperatures at weather stations situated near buildings and near asphalt. More asphalt, more warming, more record temperatures.

2. Loss of Vegetation: During the summer the temperature of a dry dirt road can be 60°F higher at noon, than ground shaded by trees. That’s why our pets instinctively seek the shade. Plants also bring moisture from below the ground that cools the air by evaporative cooling. Increasing deforestation or lost vegetation due to landscape changes cause regional warming trends.

3. Transport of heat: Natural climate oscillations alter air and ocean circulation patterns that can drive more heat from the tropics towards the poles. Europe’s recent heat wave was largely caused by air heated over the baking Sahara Desert and then driven into Europe. Similarly, the latest research finds variations in Arctic sea ice has been dominated by transport of warm Atlantic water heated in the tropics and transported northward via the Gulf Stream.

4. Less cloud cover: Recent research suggests a trend of less cloud cover resulted in increased solar heating of land and oceans. The added solar energy normally reflected by clouds was 2 times greater than what’s believed to be added by increasing carbon dioxide. Two decades of declining cloud cover was similarly shown to cause Greenland’s rapid ice melt between 1995 and 2012.

5. Less Cooling: Windy conditions cool the oceans. The unusually warm ocean conditions that occurred in the northwestern Pacific Ocean, known as the Blob, were caused by decreased winds that reduced normal cooling.

6-10: ….

….

AccuWeather Founder/CEO: No Evidence Heatwaves More Common From ‘Climate Change’

by Dr. J. N. Myers, Auhsut 8, 2019 in ClimateChangeDispatch


First, and most importantly, we warn people all the time in plain language on our apps and on AccuWeather.com about the dangers of extreme heat, as well as all hazards.

Furthermore, that is the reason we developed and patented the AccuWeather RealFeel® Temperature and our recently expanded AccuWeather RealFeel® Temperature Guide, to help people maximize their health, safety and comfort when outdoors and prepare and protect themselves from weather extremes.

The AccuWeather RealFeel Temperature Guide is the only tool that properly takes into account all atmospheric conditions and translates them into actionable behavior choices for people.

Second, although average temperatures have been higher in recent years, there is no evidence so far that extreme heatwaves are becoming more common because of climate change, especially when you consider how many heatwaves occurred historically compared to recent history.

New York City has not had a daily high temperature above 100 degrees since 2012, and it has had only five such days since 2002.

However, in a previous 18-year span from 1984 through 2001, New York City had nine days at 100 degrees or higher.

STRANGE CORAL SPAWNING IMPROVING GREAT BARRIER REEF’S RESILIENCE

by University of Queensland, August 7, 2019 in GWPF


The discovery was made by University of Queensland and CSIRO researchers investigating whether corals that split their spawning over multiple months are more successful at spreading their offspring across different reefs.

Dr Karlo Hock, from UQ’s School of Biological Sciences, said coral mass spawning events are one of the most spectacular events in the oceans.

“They’re incredibly beautiful,” Dr Hock said.

“On Australia’s Great Barrier Reef, all coral colonies typically spawn only once per year, over several nights after the full moon, as the water warms up in late spring.”

Study co-author Dr Christopher Doropoulos from the CSIRO Oceans & Atmosphere said sometimes however, coral split their spawning over two successive months.

“This helps them synchronise their reproduction to the best environmental conditions and moon phases,” he said.

“While reproductive success during split spawning may be lower than usual because it can lead to reduced fertilisation, we found that the release of eggs in two separate smaller events gives the corals a second and improved chance of finding a new home reef.”

The research team brought together multi-disciplinary skills in modelling, coral biology, ecology, and oceanography, simulating the dispersal of coral larvae during these split spawning events, among the more than 3800 reefs that make up the Great Barrier Reef.

Malfeasant Omissions? German Flagship ARD Broadcasting One-Sided, Drama-Making Sea Level Reporting

by Dr. S. Lüning, August 9, 2019 in NoTricksZone


What follows is another example of the tricks the mainstream media use to produce fake drama and urgency concerning sea level rise and climate change – namely omissions – and how geologist Sebastian Lüning held their feet to the fire.

Dr. Sebastian Lüning wrote a complaint to German ARD public broadcasting concerning its December 2, 2018, one-sided reporting of the Indian island of Ghoramara and the sea level rise it is allegedly experiencing. The €6.9 billion euro publicly funded, 22,612-employee ARD is the German equivalent to the UK’s BBC.

What follows is the exchange between Lüning and the ARD editorial staff:

Anthropocene: “it will be the rocks that have the final say” about this fake word.

by David Middleton, August 7, 2019 in WUWT


The fake geologic epoch known as the “Anthropocene” just won’t die… It’s like a zombie from a bad science fiction movie.

Despite being populated with activists like Naomi Oreskes, it has taken the AWG ten years to vote on what their conclusion will be and to start looking for evidence to support their conclusion… And the vote wasn’t unanimous.

Here’s where the Anthropocene dies…


Figure 4 from Finney & Edwards.  “Workflow for approval and ratification of a Global Standard Stratotype Section and Point (GSSP) proposal. Extensive discussion and evaluation occurs at the level of the working group, subcommission, and International Commission on Stratigraphy (ICS) Bureau. If approved at these successive levels, a proposal is forwarded to the International Union of Geological Sciences (IUGS) for ratification. This process is also followed for other ICS decisions on standardization, such as approval of names of formal units, of revisions to the units, and to revision or replacement of GSSPs.”

Slowest start to Atlantic Hurricane season since 2004

by Anthony Watts, August 7, 2019 in WUWT


Watching the current maps and models, it appears the 2019 Atlantic Hurricane Season is off to a slow start. For people that the depend on disaster porn (climate alarmists, media) that means no weather events to claim as being climate driven.


Graph of tropical storm and hurricane frequency, Atlantic region, monthly, based on data from 1851-2017. Data from NOAA at http://www.aoml.noaa.gov/hrd/tcfaq/E17.html Landsea, Chris (contributor from the NHC). “Total and Average Number of Tropical Cylones by Month (1851-2017)”. aoml.noaa.gov. National Oceanic and Atmospheric Administration, Atlantic Oceanographic and Meteorological Laboratory. Archived from the original on September 1, 2018.  Graph from RCraig.

Evidence that ERA5-based Global Temperatures Have Spurious Warming

by Dr. Roy Spencer, August 6, 2019 in GlobalWarming


“Reading, we have a problem.”

As a followup to my post about whether July 2019 was the warmest July on record (globally-averaged), I’ve been comparing reanalysis datasets since 1979. It appears that the ERA5 reanalysis upon which WMO record temperature pronouncements are made might have a problem, with spurious warmth in recent years.

Here’s a comparison of the global-average surface air temperature variations from three reanalysis datasets: ERA5 (ECMWF), CFSv2 (NOAA/NCEP), and MERRA (NASA/GSFC). Note that only CFSv2 covers the full period, January 1979 to July 2019:

ERA5 has a substantially warmer trend than the other two. By differencing ERA5 with the other datasets we can see that there are some systematic changes that occur in ERA5, especially around 2009-2010, as well as after 1998:

FORGET PARIS: CHINA’S NEW COAL BOOM

by Reuters, August 6, 2019 in GWPF


SHANGHAI/BEIJING (Reuters) – Approvals for new coal mine construction in China have surged in 2019, government documents showed, with Beijing expecting consumption of the commodity to rise in the coming years even as it steps up its fight against smog and greenhouse gas emissions.


Long-term cuts in coal consumption are a key part of China’s energy, environment and climate goals, but the fivefold increase in new mine approvals in the first-half of 2019 suggests China’s targets still provide ample room for shorter-term growth.

China’s energy regulator gave the go-ahead to build 141 million tonnes of new annual coal production capacity from January to June, compared to 25 million tonnes over the whole of last year, Reuters analysis of approval documents showed.

The projects included new mines in the regions of Inner Mongolia, Xinjiang, Shanxi and Shaanxi that are part of a national strategy to consolidate output at dedicated coal production “bases”, as well as expansions of existing collieries, the National Energy Administration (NEA) documents showed. […] Chinese coal output rose 2.6% in the first-half of 2019 to 1.76 billion tonnes.

MORE TO COME?

Industry groups still expect coal-fired power capacity to increase over the next few years, with investments in nuclear and renewables still insufficient to cover rising energy demand.

The research unit of the China State Grid Corporation last month forecast that total coal-fired capacity would peak at 1,230-1,350 gigawatts (GW), which would mean an increase of about 200-300 GW.

A study published earlier this year also suggested China’s targets would allow the construction of another 290 GW of coal-fired capacity in the coming years.

Full story


With Sea-Level Rise, Climate Science Meets Reality

by J. Weatherall, August 6, 2019 in ClimateChangeDispatch


Numerous satellites utilized by Australian agencies and research bodies are able to take a measure of sea level by way of an altimeter. However, according to the CSIRO, it should not be overlooked that the signal to do so requires

# A satellite in an orbit which repeats the same ground track very closely (within about 1 kilometer)

# A radar system to measure the distance from the satellite to the sea surface to high accuracy. TOPEX/Poseidon and Jason-1 use two radar frequencies, Ku band (13.6GHz) and C band (5.3Ghz).

# A tracking system capable of locating the satellite vertically at any time to within a few centimeters. Some of the components of such a system are:

1/ Systems (usually a combination of GPS, satellite laser ranging and the French DORIS system) to locate the satellite

2/ A high-quality gravity model

3/ A model of the drag from solar wind and the atmosphere

4/ Suitable software to combine all of the above

Other corrections to correct the range:

On the satellite:

1/ A water vapor radiometer to measure the amount of water vapor between the satellite and the sea surface (the water vapor slows down the radar pulse, causing the raw measurement to be too long)

2/ Measurement of the range at two frequencies to estimate the “ionospheric correction” — that is, the degree to which the radar pulse is slowed down by free electrons in the ionosphere

3/ The troughs of waves contribute more to the radar reflection than the crests, so we need correction for this. This is estimated from the wind speed and the wave height, both of which can be estimated from the characteristics of the returned radar pulse.

On the ground:

1/ Ocean tide models to convert the raw altimeter measurement to “de-tided”

2/ Estimates (from a model) of the atmospheric pressure. This is used to calculate a correction to the radar range to compensate for the atmosphere slowing down the radar pulse

3/ A correction for the “inverse barometer” effect, where sea level is depressed in areas of high atmospheric pressure, and vice versa.

No one besmirches the accomplishments of the engineering and technology involved.

However, it is a basic truism that the greater the number of separate corrections needing to be applied, the greater the risk of miscalculation.


For Most Of The Last 10,000 Years, Greenland Ice Sheet and Glacier Volume Was Smaller Than Today

by K. Richard, August 5, 2019 in NoTricksZone


A new paper (Axford et al., 2019) reveals NW Greenland’s “outlet glaciers were smaller than today from ~9.4 to 0.2 ka BP” (9,400 to 200 years before 1950), and that “most of the land-based margin reached its maximum Holocene extent in the last millennium and likely the last few hundred years.”

The authors conclude:

“We infer based upon lake sediment organic and biogenic content that in response to declining temperatures, North Ice Cap reached its present-day size ~1850 AD, having been smaller than present through most of the preceding Holocene.”

Furthermore, the authors assert Greenland was 2.5°C to 3°C warmer than modern on average during the Holocene Thermal Maximum, and peak temperatures were 4°C to 7°C warmer.


Image Source: Mikkelson et al., 2018

Fake news: an open letter to the Editor of the Washington Post

by Christopher Monckton of Brenchley, August 5, 2019 in WUWT


 Yet again, the hard-Left Washington Post has libeled Dr Willie Soon, whom many of us know to be one of the most dedicated scientists in single-minded pursuit of the objective truth about global warming. If you agree with the following Letter to the Editor, please write your own letter and send it in to the Washpot.

Sir,

The Post’s inaccurate and malicious personal attack on Dr. Willie Soon

….

INDIA’S NEW COAL BOOM

by GWPF, August 5,2019 in EnergyLiveNews


India expects coal-fired power capacity to grow by 22% in three years.


That’s according to the Chief Engineer at the country’s Federal Power Ministry, Ghanshyam Prasad, who Reuters reported as stating coal capacity is likely to reach 238GW by 2022.

India’s Coal Minister, Pralhad Joshi previously said annual coal demand rose by 9.1% during the year ending March 2019, noting the figure hit 991.35 million tonnes, driven primarily by utilities, which accounted for three-quarters of total demand.

The anticipated growth is likely to affect efforts to cut emissions and could risk worsening already poor air quality.

India’s electricity demand rose by 36% in the seven years up to April 2019, while coal-fired generation capacity during the period rose by three-quarters to 194.44GW.

Pralhad Joshi said despite the growth rate in thermal capacity outpacing electricity consumption in the last few years, more coal-fired plants will still be needed in the future to meet growth.

He added: “If we have to meet demand and address the intermittencies we have with solar and wind, we have no choice but to keep depending on coal-based generation in the near future.”

Why You Shouldn’t Draw Trend Lines on Graphs

by Kip Hansen,  August 6, 2019 in WUWT


What we call a graph is more properly referred to as “a graphical representation of data.”  One very common form of graphical representation is “a diagram showing the relation between variable quantities, typically of two variables, each measured along one of a pair of axes at right angles.”

Here at WUWT we see a lot of graphs —  all sorts of graphs of a lot of different data sets.  Here is a commonly shown graph offered by NOAA taken from a piece at Climate.gov called “Did global warming stop in 1998?” by Rebecca Lindsey published on September 4, 2018.


I am not interested in the details of this graphic representation — the whole thing qualifies as “silliness”.  The vertical scale is in degrees Fahrenheit and the entire range change over 140 years shown is on the scale 2.5 °F or about a degree and a half C.   The interesting thing about the graph is the effort of drawing of “trend lines” on top of the data to convey to the reader something about the data that the author of the graphic representation wants to communicate.  This “something” is an opinion — it is always an opinion — it is not part of the data.

The data is the data.  Turning the data into a graphical representation (all right, I’ll just use “graph” from here on….), making the data into a graph has already  injected opinion and personal judgement into the data through choice of start and end dates, vertical and horizontal scales and, in this case, the shading of a 15-year period at one end.  Sometimes the decisions as to vertical and horizontal scale are made by software — not rational humans —  causing even further confusion and sometimes gross misrepresentation.

Anyone who cannot see the data clearly in the top graph without the aid of the red trend lineshould find another field of study (or see their optometrist).  The bottom graph has been turned into a propaganda statement by the addition of five opinions in the form of mini-trend lines.

La localisation temporelle et géographique des stations de mesure de la température pose des problèmes

by Carl-Stéphane Huot, 30 juillet 2019 in ScienceClimatEnergie


La notion de réchauffement climatique préoccupe bon nombre de gens depuis des années. Cependant, ce réchauffement apparent pourrait être influencé par le déplacement de stations météorologiques vers les zones plus chaudes de la planète, soit plus  près de l’équateur, soit à des altitudes plus basses.  La modélisation du climat est aussi influencée par l’existence de régions sans, ou avec très peu, de stations météorologiques.

Graphique 1 : Température moyenne selon la classe de longitude.

Conclusion

La variation extrêmement élevée du nombre de stations météorologiques servant au calcul de la température mondiale a contribué depuis le début des années 1950 à une partie au moins de l’élévation de  température. La dérive de celles-ci d’une place à l’autre fausse la précision des données que l’on peut en tirer, et contribue à augmenter l’inquiétude de la population. L’emplacement et le nombre de stations à installer posent un certain nombre de problèmes autant scientifiques que techniques et  politiques, et rend, avec d’autres éléments, (par exemple l’effet d’urbanisation, non abordé ici) extrêmement difficile de parler de réchauffement climatique.

Temps far, far below normal across almost the entire territory of European Russia

by Robert, August 4, 2019 in IceAgeNow


We’re talking about record-breaking cold across an area almost half as big as the entire contiguous United States.

2 Aug 2019 – In a number of points in the north-east of the territory, the temperature dropped to record lows. In the capital of the Komi Republic, in Syktyvkar, it dropped to 2.7 degrees, which is 0.3 degrees lower than the previous record held since 1944.

Not only in the northern areas, the temperature also dropped to critical levels. In Voronezh the thermometers showed +7 degrees, leaving behind the previous record of +7.1 degrees in 1971.

Further south, in Saratov, the minimum temperature on the first day of August was 9.6, beating the previous record of 10.4 degrees set in 1948.

The cold also hit Azov. In Tsimlyansk, Rostov Region, on August 1 the temperature fell to 13.3 degrees. The previous record, 13.6, was noted in 1975.

On the first day of August, the average temperature across almost the entire territory of European Russia was 4-6 degrees below normal, and in the Volga region it did not reach the average long-term values ​​of 8 degrees.

Cold weather throughout the territory from the White to the Black Sea will continue for at least another week.

European Russia covers nearly 4,000,000 km2 (1,500,000 sq mi).
Together, the 48 contiguous states and Washington, D.C. occupy a combined area of 8,080,464.3 km2 (3,119,884.69 sq miles).

http://www.hmn.ru/index.php?index=2&nn=62368

The Sun’s Weather Cycle May Start in ‘Tsunamis,’ End with ‘Terminators’

by Passant Rabbie, July 31, 2019 in Space


A tsunami of plasma rushes through the sun before a new sunspot cycle begins.

Astronomers may have finally figured out what causes the sun’s 11-year cycle of activity, and it involves a “tsunami” of magnetic fields.

The sun, like other stars, goes through a cycle marked by a change in magnetic activity, levels of radiation, and the number and size of sunspots. While our sun’s 11-year cycle was discovered more than a century ago, predicting exactly when one cycle ends and a new one begins has been an ongoing challenge.

A pair of related studies have mapped out the sun’s activity over the course of 140 years, looking for clues about the solar cycle that are visible on the surface. By looking at the way bright flashes of ultraviolet light migrate across the sun’s surface, the researchers discovered that the sun’s mysterious 11-year cycle may be marked by a “terminator” event that ends one cycle and a “tsunami” of magnetic fields that initiates a new one. Those bright flickers of ultraviolet light and the sun’s magnetic fields appear to drive the cycle itself, and monitoring those flashes could help scientists predict when a new cycle will begin.

July 2019 Was Not the Warmest on Record

by Roy Spencer, August 2, 2019 in GlobalWarming


July 2019 was probably the 4th warmest of the last 41 years. Global “reanalysis” datasets need to start being used for monitoring of global surface temperatures. [NOTE: It turns out that the WMO, which announced July 2019 as a near-record, relies upon the ERA5 reanalysis which apparently departs substantially from the CFSv2 reanalysis, making my proposed reliance on only reanalysis data for surface temperature monitoring also subject to considerable uncertainty].


See also here

Relation entre l’ activité sismique dans les océans et le réchauffement global (août 2019)

c/o Luc Trullemans,  août 2019 in PublicMétéo


Introduction

Une forte relation à été observée ces dernières années entre de l’activité sismique dans les océans et le récent réchauffement climatique  (CSARGW ,Correlation of Seismic Activity and Recent Global Warming) .

Cette corrélation entre de l’activité sismique océanique et le réchauffement climatique avait déjà été remarquée de 1979 à 2016 (CSARGW16) et vient d’être confirmée jusqu’en 2018.

Dans cette note, on démontre que  l’activité sismique dans les océans ( =>tremblements de terre de magnitude 4-6) provoque des flux géothermiques sous-marins et ont une relation importante avec les fluctuations de la température globale des océans (SST) et de la température globale de l’air (GT).

Ceci avance une nouvelle l’hypothèse selon laquelle l’activité sismique océanique pourrait être  un des paramètres  les plus importants dans la variation de la température globale.


Greenland Ice sheet Meltdown Scare–Except It’s Not True

by P.  Homewood,  August 1, 2019 in NotaLotofPeopleKnowThat


The same heat dome that roasted Europe and broke national temperature records in five countries last week has shifted to Greenland, where it is causing one of the biggest melt events ever observed on the fragile ice sheet.

By some measures, the ice melt is more extreme than during a benchmark record event in July 2012, according to scientists analyzing the latest data. During that event, about 98 percent of the ice sheet experienced some surface melting, speeding up the process of shedding ice into the ocean.

The fate of Greenland’s ice sheet is of critical importance to every coastal resident in the world, since Greenland is already the biggest contributor to modern-day sea level rise. The pace and extent of Greenland ice melt will help determine how high sea levels climb and how quickly….

The Danish Meteorological Institute tweeted that more than half the ice sheet experienced some degree of melting on Tuesday, according to a computer model simulation, which made it the “highest this year by some distance.”

And there is no mention of the fact that the ice sheet grew substantially last year, and also the year before:

The simple fact is that the Greenland ice sheet melts every summer, particularly when the sun shines. That’s what it does. And it grows back again in winter as the snow falls. Indeed, if it did not melt, it would carry on growing year after year.

Inevitably there are some days when the weather is warmer and sunnier than normal, and others when it is colder. To pick an odd day or two is ridiculous and dishonest scaremongering.

See also here and here

MALDIVES TO OPEN FIVE NEW AIRPORTS IN 2019

by Maldives Insider, May 20, 2019


Five new airports will come into operation by the end of the year, Maldives government announced Sunday.

Transport minister Aishath Nahula told local media that construction of airports on the islands of Kulhudhuffushi in Haa Dhaal atoll, Funadhoo in Shaviyani atoll, Maafaru in Noonu atoll, Madivaru in Lhaviyani atoll and Maavarulu in Gaaf Dhaal atoll is nearing completion. Kulhudhuffushi airport will come into operation first, followed by Funadhoo and Maafaru airport in August, she said.

The airport being developed in Kulhudhuffushi, a key population zone in the north, and in Maafaru, a proposed ultra-luxury tourism zone, had earlier welcomed test flights. However, delays in the construction of terminal and other support facilities had pushed back commercial operations.

Six hectares off the southern coast of Kulhudhuffushi and another nine hectares from the island’s wetlands were reclaimed for the airport, which has a runway measuring 1,200 metres in length and 60 metres in width.

Known as the “Heart of the North”, Kulhudhuffushi is the economic capital of the northern Maldives and has a population of over 9,000, making it one of the biggest and most populous islands in the northern part of the country. The island is famous for its mangroves, after which the island itself is named.

Child miners aged four living a hell on Earth so YOU can drive an electric car

by Barbara Jones, August 5, 2017 in MailOnline


  • Sky News investigated the Katanga mines and found Dorsen, 8, and Monica, 4
  • The pair were working in the vast mines of the Democratic Republic of Congo
  • They are two of the 40,000 children working daily in the mines, checking rocks for cobalt


Eight-year-old Dorsen is pictured cowering beneath the raised hand of an overseer who warns him not to spill a rock