Archives de catégorie : climate-debate

New paper: Urbanization has increased minimum temperatures 1.7K in the UK

by Ian L.M. Goddard & S. Bett, Marcy 21, 2019 in WUWT


Abstract

This study aims to estimate the affect of urbanisation on daily maximum and minimum temperatures in the United Kingdom. Urban fractions were calculated for 10 km × 10 km areas surrounding meteorological weather stations. Using robust regression a linear relationship between urban fraction and temperature difference between station measurements and ERA‐Interim reanalysis temperatures was estimated.

For an urban fraction of 1.0, the daily minimum 2‐m temperature was estimated to increase by 1.90 ± 0.88 K while the daily maximum temperature was not significantly affected by urbanisation. This result was then applied to the whole United Kingdom with a maximum T min urban heat island intensity (UHII) of about 1.7K in London and with many UK cities having T min UHIIs above one degree.

This paper finds through the method of observation minus reanalysis that urbanisation has significantly increased the daily minimum 2‐m temperature in the United Kingdom by up to 1.70 K.

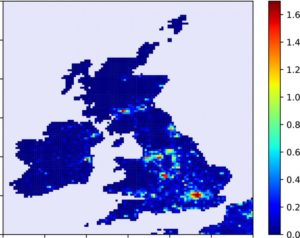
Figure 5 Map showing the change in T min due to the urbanisation at the 10 km × 10 km scale over the United Kingdom and Ireland. The colour bar shows the magnitude of the temperature change in K

Methane warming exaggerated by 400%

by Barry Brill, March 30, 2019 in WUWT


The IPCC’s AR5 estimated the global warming caused by a tonne of livestock methane would be 28 times that of a tonne of carbon dioxide. New research destroys that estimate.

The war on meat has been gathering pace amongst our Western elites. The Economist makes a detailed case for “plant-based food” in the interests of quelling climate change –

The FAO calculates that cattle generate up to two-thirds of the greenhouse gases from livestock, and are the world’s fifth largest source of methane. If cows were a country, the United Herds of Earth would be the planet’s third largest greenhouse-gas emitter.

These calculations are based on figures supplied by the IPCC’s AR5, which contends that the global warming potential (GWP) of methane over 100 years is no less than 28 times the global warming it expects to be caused by an equivalent weight of carbon dioxide. This estimate is up from the GWP of 21 put forward in the IPCC’s previous report.

All this is now challenged by a new and authoritative research paper, Allen et al (2017): “A solution to the misrepresentations of CO2-equivalent emissions of short-lived climate pollutants, under ambitious mitigation”. This paper finds that conventional GWPs misrepresent the impact of short-lived gases (such as methane) on global temperature – and recommends the adoption of a new metric, denoted as GWP*.

Deep-water circulation changes lead North Atlantic climate during deglaciation

by F. Muschitiello et al., March 20, 2019 in Nature


Abstract

Constraining the response time of the climate system to changes in North Atlantic Deep Water (NADW) formation is fundamental to improving climate and Atlantic Meridional Overturning Circulation predictability. Here we report a new synchronization of terrestrial, marine, and ice-core records, which allows the first quantitative determination of the response time of North Atlantic climate to changes in high-latitude NADW formation rate during the last deglaciation. Using a continuous record of deep water ventilation from the Nordic Seas, we identify a 400-year lead of changes in high-latitude NADW formation ahead of abrupt climate changes recorded in Greenland ice cores at the onset and end of the Younger Dryas stadial, which likely occurred in response to gradual changes in temperature- and wind-driven freshwater transport. We suggest that variations in Nordic Seas deep-water circulation are precursors to abrupt climate changes and that future model studies should address this phasing.

Indications Point To Upcoming Solar Cycle 25 Being Among The Weakest In 200 Years

by F. Bosse and F. Vahrenholt, March 29, 2019 in NoTricksZone


The sun was also very sub-normally active in February. Although we are in the middle of the minimum, the sunspot number of 0.8 for the 123rd month into the cycle is very low. On 26 days of the month no spots were visible, only on 2 days was there a little, symmetrically distributed over both solar hemispheres.The only exciting question currently: When will the minimum be finished and will solar cycle 25 begin? Although 6 spots of the new cycle were already visible in February with a significantly higher resolution, estimates are difficult.March again was dominated by some spots of the “old” SC24.  The rule: “weaker cycles often last longer than stronger cycles” could hold.

Figure 2: The strength of the sunspot activity of each cycle in comparison. The numbers in the diagram are obtained by adding up the monthly deviations between the observed values and the mean value (blue in Fig.1) up to the current 123rd cycle month.

Figure 2 shows that five cycles (No. 8, 15, 16, 18, 22) did not have a month 123 at all. Instead the following cycle started. In this respect, the picture is now somewhat distorted towards the end of the cycle.

See also here in GWPF

EU consumption results in high carbon emissions from tropical deforestation, studies show

by Charles the moderator, March 29, 2019 in WUWT


Chalmers University of Technology

A sixth of all emissions resulting from the typical diet of an EU citizen can be directly linked to deforestation of tropical forests. Two new studies, from Chalmers University of Technology, Sweden, shed new light on this impact, by combining satellite imagery of the rainforest, global land use statistics and data of international trade patterns.

“In effect, you could say that the EU imports large amounts of deforestation every year. If the EU really wants to achieve its climate goals, it must set harder environmental demands on those who export food to the EU,” says Martin Persson from Chalmers, one of the researchers behind the studies.

The link between production of certain foods and deforestation has been known before. But what Martin Persson and Chalmers colleague Florence Pendrill have now investigated is the extent to which deforestation in the tropics is linked to food production, and then where those foods are eventually consumed. In the first study, they focused on how the expansion of cropland, pastures, and forestry plantations has taken place at the expense of the rainforest.

196595_web

Emissions sources for deforestation-related carbon dioxide emissions are diverse and vary by region. Emissions embodied in production are shown for each commodity group within each region. A region’s width on the x-axis corresponds to the embodied emissions produced in that region, while the y-axis shows the share of emission attributed to each commodity group within each region, implying that the rectangles within the plot are scaled according to the emissions embodied in each region-commodity combination. The percentages within the rectangles indicate the share of the total embodied emissions; 2.6?gigatonnes of carbon dioxide due to tropical deforestation during the period 2010-2014.
Credit: Florence Pendrill, Chalmers University of Technology


Wildfires Declining In Southern Europe

by P. Homewood, March 28, 2019 in NotaLotofPeopleKnowThat


1. Introduction Fires are an integral component of ecosystem dynamics in European landscapes. However, uncontrolled fires cause large environmental and economic damages, especially in the Mediterranean region. On average, about 65000 fires occur in Europe every year, burning approximately half a million ha of wildland and forest areas; most of the burnt area, over 85%, is in the European Mediterranean region. Trends in number of fires and burnt areas in the Mediterranean region are presented in Fig. 1. Recent analyses of the available data in the European Forest Fire Information System (EFFIS) show that over 95% of the fires in Europe are human-induced. The split of causes shows that most of them are due to misuse of traditional practices of straw burning of shrub-burning to recover areas for cattle feeding. Although European countries have collected information on forest fires since 1970s, the lack of harmonized information at the European level has prevented a holistic approach for forest fire prevention in the Region. The European Forest Fire Information System (EFFIS) has been developed jointly by the European Commission (EC) services (Directorate General Environment and the Joint Research Centre) and the relevant fires services in the countries (forest fires and civil protection services) in response to the needs of European bodies such as the Monitoring and Information Centre of Civil Protection, the European Commission Services and the European Parliament. EFFIS is a comprehensive system covering the full cycle of forest fire management, from forest fire prevention and preparedness to post-fire damage analysis (see Fig. 2). The system is providing information to over 30 countries in the European and Mediterranean regions, and receives detailed information of forest fire events from 22 European countries. It supports forest fire prevention and forest fire fighting in Europe through the provision of timely and reliable information on forest fires.

Again Reality Goes In Opposite Direction Of Climate Models…”Confidence In Models Correspondingly Low”

by P. Gosselin, March 27, 2019 in NoTricksZone


Real vegetation development in southern Africa takes a very different course than claimed by climate models

By Die kalte Sonne
(German translated by P Gosselin)

Climate models provide answers to all conceivable questions about the future. Political decision-makers are grateful for this information because they can make their plans accordingly.

But are the forecasts derived from models correct at all?

A research team led by Timm Hoffman has now compared the model projections with real vegetation development in southern Africa using historical photos. The sobering result: Nature has mostly developed quite differently than assumed by the models. In contrast to the model assumptions, no significant long-term trend in precipitation could be observed. Vegetation belts, which were supposed to shrink, ended up expanding. Confidence in the models is correspondingly low.

Political planning or even CO2 damage calculations based on the simulations are not possible. Here is the abstract of the work published in the journal Anthropocene in March 2019:

Southern Africa vegetation expanding, images show. Source: here.

INFO-SCE: 5% d’augmentation de production d’électricité en Chine : cela fait quoi?

by Science,  Climat et Energie, 27 mars 2019


Selon le dernier rapport de l’IEA, la consommation d’énergie mondiale a augmenté de 2,3% en 2018 ce qui représente la plus forte augmentation des dix dernières années. Le gaz naturel fut le plus consommé et représente 45% de l’augmentation de la consommation totale d’énergie.

Suite à cette augmentation de consommation d’énergie les émissions de CO2 se sont accrues de 1,7% pour atteindre 33,1 Gt en 2018. Près d’un tiers de ces émissions provient des centrales de charbon, surtout celles de la Chine.

Il faut noter que les émissions de CO2 en Chine ont augmenté de 2,5%, ou 230 Mt, pour atteindre 9,5 Gt. Un bond de plus de 5% de la production d’électricité à partir de centrales au charbon a entraîné une augmentation des émissions de 250 Mt, ce qui a plus que compensé l’impact de la baisse de l’utilisation du charbon en dehors du secteur de l’énergie.

Pour comparer…la Belgique émet 115 Mt de CO2.

DONC…l’augmentation des émissions en Chine dues au charbon en 2018 représente plus du double de toutes les émissions de CO2 de la Belgique.

Report : The “New Energy Economy”: An Exercise in Magical Thinking

by Mark P. Mills, March 26, 2019 in ManhattanInstitute


EXECUTIVE SUMMARY

A movement has been growing for decades to replace hydrocarbons, which collectively supply 84% of the world’s energy. It began with the fear that we were running out of oil. That fear has since migrated to the belief that, because of climate change and other environmental concerns, society can no longer tolerate burning oil, natural gas, and coal—all of which have turned out to be abundant.

So far, wind, solar, and batteries—the favored alternatives to hydrocarbons—provide about 2% of the world’s energy and 3% of America’s. Nonetheless, a bold new claim has gained popularity: that we’re on the cusp of a tech-driven energy revolution that not only can, but inevitably will, rapidly replace all hydrocarbons.

This “new energy economy” rests on the belief—a centerpiece of the Green New Deal and other similar proposals both here and in Europe—that the technologies of wind and solar power and battery storage are undergoing the kind of disruption experienced in computing and communications, dramatically lowering costs and increasing efficiency. But this core analogy glosses over profound differences, grounded in physics, between systems that produce energy and those that produce information.

In the world of people, cars, planes, and factories, increases in consumption, speed, or carrying capacity cause hardware to expand, not shrink. The energy needed to move a ton of people, heat a ton of steel or silicon, or grow a ton of food is determined by properties of nature whose boundaries are set by laws of gravity, inertia, friction, mass, and thermodynamics—not clever software.

This paper highlights the physics of energy to illustrate why there is no possibility that the world is undergoing—or can undergo—a near-term transition to a “new energy economy.”

Among the reasons:

Global CO2 Emissions Rose By 1.7% Last Year, As Energy Demand Climbs

by P. Homewood, March 26, 2019 in NotaLotofPeopleKnowThat


Energy demand worldwide grew by 2.3% last year, its fastest pace this decade, an exceptional performance driven by a robust global economy and stronger heating and cooling needs in some regions. Natural gas emerged as the fuel of choice, posting the biggest gains and accounting for 45% of the rise in energy consumption. Gas demand growth was especially strong in the United States and China.

Demand for all fuels increased, with fossil fuels meeting nearly 70% of the growth for the second year running. Solar and wind generation grew at double-digit pace, with solar alone increasing by 31%. Still, that was not fast enough to meet higher electricity demand around the world that also drove up coal use.

As a result, global energy-related CO2 emissions rose by 1.7% to 33 Gigatonnes (Gt) in 2018. Coal use in power generation alone surpassed 10 Gt, accounting for a third of the total increase. Most of that came from a young fleet of coal power plants in developing Asia. The majority of coal-fired generation capacity today is found in Asia, with 12-year-old plants on average, decades short of average lifetimes of around 50 years.


Inconvenient: NASA says a Greenland glacier did an about-face – growing again

by Anthony Watts, March 25, 2019 in WUWT


“…scientists were so shocked to find the change.”

From NASA JPL: Cold Water Currently Slowing Fastest Thinning Greenland Glacier

NASA research shows that Jakobshavn Glacier, which has been Greenland’s fastest-flowing and fastest-thinning glacier for the last 20 years, has made an unexpected about-face. Jakobshavn is now flowing more slowly, thickening, and advancing toward the ocean instead of retreating farther inland. The glacier is still adding to global sea level rise – it continues to lose more ice to the ocean than it gains from snow accumulation – but at a slower rate.

The researchers conclude that the slowdown of this glacier, known in the Greenlandic language as Sermeq Kujalleq, occurred because an ocean current that brings water to the glacier’s ocean face grew much cooler in 2016. Water temperatures in the vicinity of the glacier are now colder than they have been since the mid-1980s.

See also here in NBS

Nature Unbound III: Holocene climate variability (Part A)

by Javier, April 30, 2017 in ClimateEtc.


First in a two part series on Holocene climate variability.

Summary: Holocene climate is characterized by two initial millennia of fast warming followed by four millennia of higher temperatures and humidity, and a progressively accelerating cooling and drying for the past six millennia. These changes are driven by variations in the obliquity of the Earth’s axis. The four millennia of warmer temperatures are called the Holocene Climatic Optimum which was 1-2°C warmer than the Little Ice Age. This climatic optimum was when global glaciers reached their minimum extent. The Mid-Holocene Transition, caused by orbital variations, brought a change in climatic mode, from solar to oceanic dominated forcing. This transition displaced the climatic equator, ended the African Humid Period and increased El Niño activity.


Figure 36. Holocene temperature profile. A. Summer (July-August) Central England temperature reconstruction from multiple proxies and sources by H. H. Lamb.Crosses represent dating and temperature uncertainty. Black dots are centennial averages. Red dot is 1900-1965 average. Source: Lamb, H.H. 1977. Climate: Present, past and future. Volume 2. B. Greenland temperature reconstruction based on an average of uplift corrected δ18O isotopic data from Agassiz and Renland ice cores. This average has been corrected for changes in the δ18O of seawater and calibrated to borehole temperature records. Some historical periods are indicated. Source: B. Vinther et al., 2009.

“Global climate change” does not cause species extinctions

by Paul Berth, March 22, 2019 in ScienceClimatEnergie


Contrary to what the media tries to make you believe, global climate change is not a major cause of species extinction. A recent study published in March 2019 in Frontiers in Ecology and the Environment shows that the major cause of extinction is the introduction of invasive alien species (IAS) into ecosystems. This phenomenon, well known to biologists and confirmed by the IUCN (International Union for the Conservation of Nature), is unfortunately little known to the general public.

Figure 1. Number of recent animal extinctions (IUCN categories “extinct” [EX] and “extinct in the wild” [EW]) for different groups of animals (figures from IUCN Table 3a). The colors provide information on the causes of the extinctions (“Driver”); for example dark purple is used for IAS (“Alien”), extinctions caused by local species (“Native”) are light purple. The category “Neither” includes other causes of extinction or unknown causes (source, Blackburn et al., 2019).


EIA AEO shows U.S. CO2 emissions 1 billion metric tons below 2007 peak in 2050

by Larry Hamlin,  March 23, 2019 in WUWT


The Energy Information Administration (EIA) has released its 2019 Annual Energy Outlook(AEO) report for the U.S. showing that the nations year 2050 CO2 emissions will be just over 1 billion metric tons per year lower than its peak year 2007 CO2 emissions of 6.021 billion metric tons which retains and sustains the CO2 reductions achieved because of market driven increased use of natural gas while reducing coal fuel use.

During this same time period the world’s developing nations are forecast to increase their CO2 emissions by more than 14.5 billion metric tons per year bringing their CO2 emissions levels to a total of about 6 times those of the U.S.

Busted Hockey Sticks: 35 Non-Global Warming Papers Have Been Published In 2019

by Kenneth Richard, March 22, 2019 in NoTricksZone


Could a transition in paleoclimate reconstruction be underway? More and more, scientists aren’t hiding statements or graphical depictions of the lack of modern warming or the much-warmer Holocene past.


A compilation of 35 papers from across the globe indicate that modern climate is not unusual, remarkable or unprecedented, and that large regions of the Earth were as warm or warmer than now when CO2 concentrations were much lower (260 to 350 ppm).

This development continues apace with the trends from the last two years, when 253 non-hockey stick papers were published.

Summit leak reveals EU rift on climate change

by Frédéric Simon, March 21, 2019 in Euractiv


Confidential documents prepared in advance of a two-day EU summit in Brussels have exposed an East-West divide in Europe on climate change, with Germany siding with Poland, Hungary and the Czech Republic in their refusal to commit to climate neutrality by 2050.

The leaked documents, seen by EURACTIV, show the amendments proposed by each country in preparation for the final statement of the leaders summit that opens in Brussels on Thursday (21 March).

And when it comes to climate action, the papers reveal a growing rift between two distinct groups of countries.

On the one hand, France, the Netherlands, Luxembourg, Spain, Portugal, Finland, Sweden and Denmark have all backed a European Commission plan to decarbonise the EU by 2050, linking it specifically to the Paris Agreement objective of keeping global warming below 1.5°C.

A French proposal, for instance, underlines that Europe should strive for climate neutrality “by 2050, in line with the 1.5 degree objective of the Paris Agreement”.

It then calls on EU member states “to prepare a discussion in the European Council in June to define the announcements of the EU at the September Climate Summit in New York”. Both amendments were rejected in the final draft.

On the other hand, Germany, Poland, Hungary and the Czech Republic have refused to specifically link EU climate action with the 1.5°C objective. They also oppose any time-bound commitment to the EU’s climate neutrality objective, deleting any reference to 2050 for reaching that goal.

Inconvenient: Polar Bear Numbers May Have Quadrupled

by Anthony Watts, March 19, 2019 in WUWT


Researcher says attempts to silence her have failed

Polar bear numbers could easily exceed 40,000, up from a low point of 10,000 or fewer in the 1960s.

In The Polar Bear Catastrophe that Never Happened, a book published today by the Global Warming Policy Foundation, Dr Susan Crockford uses the latest data as well as revisiting some of the absurd values used in official estimates, and concludes that polar bears are actually thriving:

NOAA : “among the eight warmest Februarys on record”

by Tony Heller, March 19, 2019 in TheDeplorableClimSciBLog


NOAA says last month was “among the eight warmest Februarys on record” in much of the Earth.

According to NCEI’s Regional Analysis, South America, Europe and Oceania had a February temperature that ranked among the eight warmest Februarys on record.

There is no such word as “Februarys” – plural for February is Februaries. But besides the fact they are illiterate, they are also lying

It looks like the world is burning up, with just a few slightly cool areas. It has an official government seal on it, so it must be accurate, right?

The map below shows where NOAA actually had surface temperatures in February.

The Green New Deal’s Weak Chain Of Logic

by Daniel G. Jones, March 18, 2019 in ClimateChangeDispatch


Reagan observed: “It isn’t so much that liberals are ignorant. It’s just that they know so many things that aren’t so.”

So it is with the Green New Deal. Most liberals regard it as a simple proposition: Global warming is a really big problem, and it’s our fault, so let’s fix it.

But closer analysis reveals that the argument for the Green New Deal rests upon a long chain of interdependent assertions, every one of which must be believed for the problem to be of sufficient peril to warrant their drastic solution.

Here are links in their chain of logic. If you doubt the truth of any single step, you must discard the entire argument.

The Climate Debate Twenty Years Later (recalling Houston’s 1999 conference)

by Robert Bradley Jr., March 7, 2019 in MasterResource


“Better climate knowledge about natural versus anthropogenic forcing seems to a decade away.” That was the major takeaway from a major 1999 climate conference in Houston, Texas as noted by Martin Cassidy of the Houston Geological Society, who  authored a conference summary, “Global Climate Change: Panel Agrees: ‘In 10 Years We Will Know‘.”

In fact, one of the conference participants, Gerald North, climatologist at Texas A&M, repeated this a decade after this conference. In his words:

In another decade of research we will have squared away a lot of our uncertainties about forced climate change. As this approaches we can be thinking about what to do if the warming does indeed appear to be caused by humans and to what extent things are changing as result. (North to Seldon B. Graham, Jr. January 6, 2010)

Now for Cassidy’s 1,000-word writeup. As you read this, ask yourself: what is really that different today, 20 years later, science-wise?

Planet-Sized Experiments – we’ve already done the 2°C test

by Willis Eschenbach, March 17, 2019 inWUWT


People often say that we’re heading into the unknown with regards to CO2 and the planet. They say we can’t know, for example, what a 2°C warming will do because we can’t do the experiment. This is seen as important because for unknown reasons, people have battened on to “2°C” as being the scary temperature rise that we’re told we have to avoid at all costs.

But actually, as it turns out, we have already done the experiment. Below I show the Berkeley Earth average surface temperature record for Europe. Europe is a good location to analyze, because some of the longest continuous temperature records are from Europe. In addition, there are a lot of stations in Europe that have been taking record for a long time. This gives us lots of good data.

So without further ado, here’s the record of the average European temperature.

An Analysis of the Recent Climate Change Hysteria

by Tim Ball, March 16, 2019 in WUWT


Most people were taken in by the false story of human-caused global warming. We can include all the students participating in the classroom walkout to demand governments stop climate change, organized by 16-year-old Greta Thunberg. Her goal is to keep global temperatures below 2 degrees Celsius above pre-industrial levels. Apparently, she has no idea that the temperature was near or above that level for most of the last 10,000-years in a period known as the Holocene Optimum.

They are taken in by the false claim that a minute amount of human-produced CO2 is effectively controlling the entire atmospheric system since 1950 and causing environmental collapse through global warming. They don’t know that there is an upper limit to the amount that CO2 can increase temperature. They don’t know that the average level of CO2 over the last 250 million years is 1200 ppm. They don’t know that every projection of temperature by the UN Intergovernmental Panel on Climate Change (IPCC) since 1990 was wrong. To paraphrase Winston Churchill, how did so few, fool so many, to such an extent, for so long?

GREENLAND ICE SHEET SIXTH HIGHEST ON RECORD

by GWPF, December 7, 2019


In 2018, Greenland’s total  surface mass budget (SMB) is almost 150bn tonnes above the average for 1981-2010, ranking as sixth highest on record.


The Danish Meteorological Institute (DMI) also performs daily simulations of how much ice or water the Ice Sheet loses or accumulates. Based on these simulations, an overall assessment of how the surface mass balance develops across the entire Ice Sheet is obtained (Fig. 4).

At the end of the 2018 season (31 August 2018), the net surface mass balance was 517 Gt, which means that 517 Gt more snow fell than the quantity of snow and ice that melted and ran out into the sea.

Exagérations climatiques extrêmes

by Jean N., 14 mars 2019 in ScienceClimatEnergie


Il ne se passe pas une journée sans que l’on entende ou lise dans les médias que le climat est “déréglé” et qu’il y a de plus en plus d’évènements climatiques extrêmes. Et de nombreux scientifiques semblent penser la même chose. Par exemple, une pétition publiée fin janvier 2019 et signée par 3400 scientifiques belges, déclare au point 3 : “Le seul réchauffement actuel de 1°C entraîne déjà une augmentation de l’occurrence et de l’intensité des extrêmes climatiques tels que les canicules, les sécheresses ou encore les inondations.” Aucune référence n’est malheureusement donnée par les signataires de la pétition… Ces phénomènes climatiques sont-ils exagérés? Consultons donc le dernier rapport du GIEC, l’AR5 publié en 2013, et particulièrement le chapitre 2 qui traite des évènements climatiques extrêmes (depuis 2013, le GIEC n’a plus rien publié d’aussi complet sur le sujet). Préparez-vous à être surpris!

Figure 1. Extrait de la Table SPM.1 concernant les évènements climatiques extrêmes dans le résumé pour décideurs du rapport AR5 du GIEC. Sur 9 phénomènes climatiques extrêmes seulement 5 sont présentés dans la table par le GIEC. Le texte noir sont des conclusions tirées par l’AR5. Les textes en rouge et en bleu sont des conclusions plus anciennes (AR4 et rapport SREX). A droite, “OK Ch.2” indique que le résumé est correct par rapport au texte; le triangle rouge “attention”, indique que des informations importantes sont manquantes et peuvent induire en erreur.

Greenland’s Glaciers Expanding Again

by P. Homewood, March 11, 2019 in NotaLotofPeopleKnowThat


As I reported last  September, Greenland’s ice sheet mass balance had grown at close to record levels for the second year running.

To clarify again, the mass balance calculation accounts for:

1) Snowfall

2) Ice melt

3) Ablation


In other words, it does not include calving.

http://www.dmi.dk/en/groenland/maalinger/greenland-ice-sheet-surface-mass-budget/#

..