Assuming that the uncertainty in GIA adjustments are ‘in the noise’ of global sea level rise may not be entirely justified. The adjustments to the satellite data that emerged in the discussion between Morner and Nerem do not inspire confidence in the estimate of sea level rise from satellite data, and the low level of stated uncertainty strains credulity.
by P. Homewood, June 22, 2018 in NotaLotofPeopleKnowThat
“Thirty years of data have been collected since Mr. Hansen outlined his scenarios—enough to determine which was closest to reality. And the winner is Scenario C. Global surface temperature has not increased significantly since 2000, discounting the larger-than-usual El Niño of 2015-16. Assessed by Mr. Hansen’s model, surface temperatures are behaving as if we had capped 18 years ago the carbon-dioxide emissions responsible for the enhanced greenhouse effect. But we didn’t. And it isn’t just Mr. Hansen who got it wrong. Models devised by the United Nations Intergovernmental Panel on Climate Change have, on average, predicted about twice as much warming as has been observed since global satellite temperature monitoring began 40 years ago…”
“Several more of Mr. Hansen’s predictions can now be judged by history. Have hurricanes gotten stronger, as Mr. Hansen predicted in a 2016 study? No. Satellite data from 1970 onward shows no evidence of this in relation to global surface temperature. Have storms caused increasing amounts of damage in the U.S.? Data from the National Oceanic and Atmospheric Administration show no such increase in damage, measured as a percentage of gross domestic product. How about stronger tornadoes? The opposite may be true, as NOAA data offers some evidence of a decline. The list of what didn’t happen is long and tedious.”
Sustainable alarm, unending hoax. Commentary at Germany’s ‘Die Welt’: Why has the climate-last-chance alarm been blaring 30 years long now? And why has the planet today “suddenly” just been given yet another 20 years by experts?
Remember how in 2007 Al Gore warned we had only 10 more years to act?
Well, those 10 years have long since expired, and that deadline came and went without the planet changing much. Embarrassed, global warming alarmists quietly pushed the doomsday back once again. And this time it was for real.
This game has been going on for years now.
Today, business journalist Daniel Wetzel here in a commentary at German national daily Die Welt finally is wondering why it’s been “5 to midnight for 30 years now”!
One of the most important numbers in the world goes by the catchy title of Equilibrium Climate Sensitivity, or ECS. It is a measure of how much the climate responds to greenhouse gases. More formally, it is defined as the increase, in degrees Celsius, of average temperatures around the world, after doubling the amount of carbon dioxide in the atmosphere and allowing the atmosphere and the oceans to adjust fully to the change. The reason it’s important is that it is the ultimate justification for governmental policies to fight climate change.
The United Nations Intergovernmental Panel on Climate Change (IPCC) says ECS is likely between 1.5 and 4.5 degrees Celsius, but it can’t be more precise than that. Which is too bad, because an enormous amount of public policy depends on its value. People who study the impacts of global warming have found that if ECS is low — say, less than two — then the impacts of global warming on the economy will be mostly small and, in many places, mildly beneficial.
From ARS Technica, one of the most incoherent things I’ve ever read…
…
The shocking thing is that Howard Lee has a degree in geology. The fact that he makes his living as an “Earth Science writer” and not as a geologist might just be relevant.
Can the Miocene tell our future? I’ll let Bubba’s mom answer that question:
Now it matters to do a better job understanding the ocean,” Resplandy said. “Our main point is that carbon gets re-distributed because it was wrongly allocated. A lot of people had different pieces, but all the pieces weren’t quite fitting together.”
Not a single EU state is meeting its climate targets, a new analysis by CAN Europe finds.
It’s been close to three years since countries worldwide signed the Paris Agreement, which obligates nations pledge to commit themselves to intending (or something like that) to reduce their greenhouse gas emissions in order to “safeguard the planet’s future”.
The language of the Agreement is in fact non-binding, and so one wouldn’t be surprised to learn that some signatories might not be living up to the agreement’s spirit.
Richard Siegmund Lindzen is an American atmospheric physicist known for his work in the dynamics of the atmosphere, atmospheric tides, and ozone photochemistry. He has published more than 200 scientific papers and books. From 1983 until his retirement in 2013, he was Alfred P. Sloan Professor of Meteorology at the Massachusetts Institute of Technology. He was a lead author of Chapter 7, “Physical Climate Processes and Feedbacks,” of the Intergovernmental Panel on Climate Change’s Third Assessment Report on climate change. He has criticized the scientific consensus about climate change and what he has called “climate alarmism.”
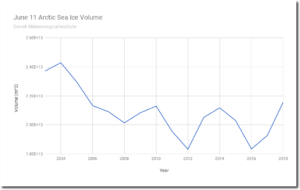
According to a new paper published in the Journal of Geophysical Research, the observed mean thickness of the sea ice in the region north of (Arctic) Svalbard was substantially thinner (0.94 m) in 1955 than it has been in recent years (~1.6 m, 2015/2017).
by Paul Berth, 16 juin 2018 in ScienceClimatEnergie
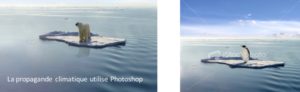
Les ours polaires (Ursus maritimus) sont souvent utilisés dans le débat concernant le réchauffement climatique qui serait provoqué par l’homme. Selon les écologistes et les partisans du GIEC ils sont en grand danger. Mais n’est-ce pas aller un peu vite?
A new paper about to be in press, comes at the end of a flurry of papers and reports published this week that claims Antarctica was losing ice mass. Zwally says ice growth is anywhere from 50 gigatons to 200 gigatons a year. NASA glaciologist Jay Zwally says his new study will show, once again, the eastern Antarctic ice sheet is gaining enough ice to offset losses in the west.
The new paper has zero mentions of the word. But other scientists have published plenty of papers describing how the West Antarctic zone is being warmed from below by 1200 degrees of magma. According to scientist Dustin Schroeder and co, it is as if the Thwaites Glacier in West Antarctic is sitting on a “stovetop burner”.[1]His words. Thwaites Glacier,, smack in the middle of the warming is being melted from below by geothermal heat. Then there is the large blob of superheated rock 60 miles below West Antarctica. The researchers use the phrase “like a blow-torch”…. Capping it off, only last year 91 new volcanoes were discovered 2km underneath the West Antarctic Rift. That’s new, as in, we didn’t know they were there.
Follow the reasoning, either a trace gas 10 kilometers up is causing some spots of Antarctica to warm and other parts to cool, or hot magma at 1,200C is. What’s more likely?
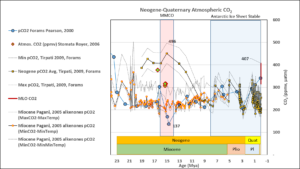
Water, H2O, determines the ‘General Background Temperature’ for the Earth, resulting in Hothouse and Ice House Climate States. During geological periods the movement of continents changes the position of
continents, oceans and seas. Because of the different configurations, a dominant warm or a dominant cold deep-water production configuration ‘sets’ average temperatures for the deep oceans. Changing vertical oceanic circulation changes surface temperatures, especially in the higher latitudes. During a Hot House State, higher temperatures in the high latitudes result in a high water-vapor concentration that prevents a rapid loss of thermal energy by the Earth.
These three processes, plate tectonics (continental drift), vertical oceanic circulation variability and variations in atmospheric water vapor concentration and distribution, caused previous Hot House and Warm House Climate States. A change in the working of those mechanisms resulted in a transition from the previous Hot House Climate State to the very cold ‘Ice House State’ that we live in now. That change was set in motion by the changing configuration of continents, oceans and seas.
We covered this yesterday, but today the official press release came out, so worth covering again. Via Eurekalert
Land-based portion of massive East Antarctic ice sheet retreated little during past eight million years
But increases in atmospheric carbon dioxide levels could affect stability and potential for sea level rise
NATIONAL SCIENCE FOUNDATION
Large parts of the massive East Antarctic Ice Sheet did not retreat significantly during a time when atmospheric carbon dioxide concentrations were similar to today’s levels, according to a team of researchers funded by the National Science Foundation (NSF). The finding could have significant implications for global sea level rise.
There’s periods where it’s busy and quiet and busy and quiet, but no trend,” said Landsea, “There’s no statistical change over a 130-year period. Since 1970, the number of hurricanes globally is flat. I haven’t seen anything that suggests that the hurricane intensity is going to change dramatically. It looks like a pretty tiny change to how strong hurricanes will be. It’s not zero, but it’s in the noise level. It’s very small.”
Some have speculated that the distribution of relative humidity would remain roughly constant as climate changes (Allen and Ingram 2002). Specific humidity can be thought of as “absolute” humidity or the total amount of water vapor in the atmosphere. We will call this amount “TPW” or total precipitable water with units of kg/m2. As temperatures rise, the Clausius-Clapeyron relationship states that the equilibrium vapor pressure above the oceans should increase and thus, if relative humidity stays the same, the total water vapor or specific humidity will increase. The precise relationship between specific humidity and temperature in the real world is unknown but is estimated to be between 0.6 to 18% (10-90%ile range) per degree Celsius from global climate model results (Allen and Ingram 2002) …
The paper is quite technical and focuses specifically on Chinese temperature trends. But, we think that it will still be of interest to many readers here, especially anybody who is interested in any of the following topics:
Urbanization bias
The homogenization of temperature data
The “early 20th century warm period” found in many parts of the Northern Hemisphere, and
Comparing temperature proxies to instrumental records
Lack of information is a major problem in reconstructing and understanding climate and climate mechanisms. H.H.Lamb gave it as his reason for creating the Climatic Research Unit (CRU).
Notice he is talking about “the facts”, which includes data and other measures. Chief among the other measures are accurate chronologies, which is why he discusses dates and dating methods at some length in Volume 2 of his Climate, Present, Past and Future.
Lamb also divided climate studies into three major areas based on time and method. The secular or instrumental period covers at most 100 years. Few stations are longer and almost all are in Western Europe or eastern North America. The historical period includes the recorded works of humans and covers at most 3000 years. The biologic/geologic record covers the remainder of time. The degree of accuracy diminishes both in measures, such as temperature and precision of dates, as you go back in time. One tragedy of the “hockey stick” rarely discussed was that it misused and demeaned the value of one of the few measures that transcends two or three of these divisions.
by Amanda Morris, June 4, 2018 inNorthwesternUniversity
A tiny clue found in ancient sediment has unlocked big secrets about Greenland’s past and future climate.
Just beyond the northwest edge of the vast Greenland Ice Sheet, Northwestern University researchers have discovered lake mud that beat tough odds by surviving the last ice age. The mud, and remains of common flies nestled within it, record two interglacial periods in northwest Greenland. Although researchers have long known these two periods — the early Holocene and Last Interglacial — experienced warming in the Arctic due to changes in the Earth’s orbit, the mix of fly species preserved from these times shows that Greenland was even warmer than previously thought.
In contrast, two new papers cite evidence that the timing of the lagged CO2 response to temperature changes may have ranged between 1300 and 6500 years in some cases. It would appear that a millennial-scale lagged response to temperature undermines the claim that CO2 concentration changes were a driver of climate in the ancient past.
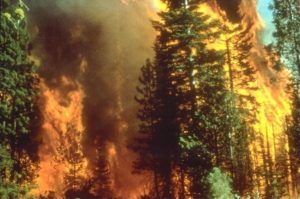
On June 8th, the California Department of Forestry and Fire Protection (Cal Fire) made its first official announcement via press release that 12 big Northern California wildfires in October 2017 were caused by problems associated with electric utility power lines.
The October 2017 Fire Siege involved more than 170 fires and burned at least 245,000 acres in Northern California. About 11,000 firefighters from 17 states and Australia helped battle the blazes. They concluded that 12 Wildfires in Mendocino, Humboldt, Butte, Sonoma, Lake, and Napa Counties were caused by Pacific Gas & Electric (PG&E) “power and distribution lines, conductors and the failure of power poles.”
The words “global warming” and “climate change” were conspicuously absent from the announcement even…
La géologie, une science plus que passionnante … et diverse