by Tony Heller, June 4, 2018 in TheDeplorableClimSciBlog
According to the Danish Meteorological Institute, Arctic sea ice volume is highest for the past eleven years and above the fifteen year mean since the start of DMI records in 2003.
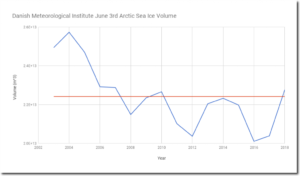

by Tony Heller, June 4, 2018 in TheDeplorableClimSciBlog
According to the Danish Meteorological Institute, Arctic sea ice volume is highest for the past eleven years and above the fifteen year mean since the start of DMI records in 2003.
by K. Richard, June 4, 2018 in NoTricksZone
Dr. Boris M. Smirnov, a prominent atomic physicist, has authored 20 physics textbooks during the last two decades. His latest scientific paper suggests that the traditional “absorption band” model for calculating the effect of atmospheric CO2 during the radiative transfer process is flawed. New calculations reveal that the climate’s sensitivity to a doubling of the CO2 concentration is just 0.4 K, and the human contribution to that value is a negligible 0.02 K.
(…)
by Wallace Manheimer, June 4, 2018 in ClimateChangeDispatch
A claimed nearly unanimous scientific consensus on fear of climate change has caused a push to substantially reduce or even eliminate the use of fossil fuel in favor of solar and wind.
But three crucial questions are: 1) is the scientific community really united? 2) can solar and wind take over any time soon to provide the required vital energy for the maintenance of modern civilization in today’s world of 7 billion people?, and 3) has CO2 caused any harm yet? The answer to all three questions is no.
A major theme of this essay is that many assertions can easily be checked out by a simple Google search.
(…)
by Michael Haverluck, January 28, 2018 in NewsNow
Climate flip-flop
After finally realizing that the claimed rising temperatures never showed up around the globe, the scientific community is being told through its most respected publications that specific forms of pollution that are human-generated are keeping populations from experiencing the toll of other airborne human-made emissions.
“Pollution in the atmosphere is having an unexpected consequence, scientists say – it’s helping to cool the climate, masking some of the global warming that’s occurred so far,” Scientific American reported last week. “That means efforts worldwide to clean up the air may cause an increase in warming, as well as other climate effects, as this pollution disappears.”
(…)
by Dave Keating, May 31, 2018 in PowerUp
Germany’s task force for phasing out coal was meant to launch this week, but yesterday the government quietly announced it is delaying the kick-off. It is the third time the coal exit commission’s launch has been delayed.
The task force has become so controversial – even before it comes into existence – that the government can’t get it started. Since the idea was proposed by German Chancellor Angela Merkel last year, it has been plagued by fighting over who will lead it, what it will do, and how much power it will have.
by Iceagenow, May 24, 2018 in Principia.Sci.International
Killed more than 500,000 people.
Andrew McKillop has a new article posted at The Market Oracle. Here are some excerpts.
This is the global cooling fear
Intense flooding in the low countries of Europe became “darkly repetitive” during the Little Ice Age, writes McKillop. The cooling period lasted 450 years,
…
by P. Gosselin, June 01, 2018 in NoTricksZone
The Global Environment and Marine Department of the Japanese Meteorological Agency recently corrected the long term trend in the annual mean sea ice extent in the Antarctic area: from 0.015 x 10⁶ km2per year to 0.019 x 10⁶ km2 per year on 11 May 2018.
That’s more than a 25% adjustment (15,000 sq. km to 19,000 sq km). So while chunks the size of Manhattans may break off from time to time, about 300 Manhattans of new ice gets added annually.
The report notes that in the Antarctic Ocean: “the annual maximum and annual mean sea ice extents have shown a long-term trend of increase since 1979”.
(…)
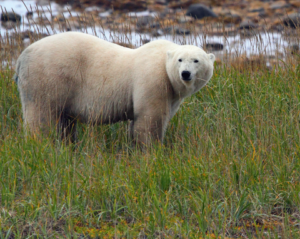
by Dr. Susan Crockford, May 24, 2018 in PolarBearScience
DDuring a meeting of polar bear range states (Canada, Russia, Greenland, Norway, and the USA) in late January 2018 to discuss conservation issues, Canada — home to ~2/3 of the world’s polar bears — included in its presentation an updated population status and trend map approved by the Polar Bear Technical Committee in its presentation. This 2017 map replaces one from 2014 but is not yet available on the Environment Canada website.
by K. Richard, May 31, 2018 in NoTricksZone
Because trees may only grow within narrowly-defined temperature ranges and elevations above sea level, perhaps the most reliable means of assessing the air temperatures of past climates is to collect ancient treeline evidence. In a new paper, Kullman (2018) found tree remnants at mountain sites 600 to 700 meters north of where the modern treeline ends, strongly implying Early Holocene air temperatures in northern Sweden were 3-4°C warmer than recent decades.
(…)
by Oliver Moody, May 29, 2018 in TheNYTimes
Since the 1950s the number of lives and the amount of money lost to floods have declined, despite little change to the frequency of catastrophic floods, according to the first comprehensive study of European historical records.
Academics at Delft University of Technology in the Netherlands found that the number of flood deaths across Europe has been falling by about 5 per cent a year for the past six decades. Financial losses to flooding have declined by 2 per cent a year, according to their paper in Nature Communications.
by Roy W. Spencer, Ph. D., May 25 2018 in GlobalWarming
There is a continuing debate over sea level rise, especially how much will occur in the future. The most annoying part of the news media reporting on the issue is that they imply sea level rise is all the fault of humans.
This is why the acceleration of sea level rise is what is usually debated, because sea level has been rising naturally, for at least 100 years before humans could be blamed. So, the two questions really are (1) Has sea level rise accelerated?, and (2) how much of the acceleration is due to humans?
Yesterday’s spat between Gavin Schmidt and Willis Eschenbach dealt with the question of whether sea level rise has accelerated or not. Gavin says it has. Willis says not, or at least not by a statistically significant amount. (…)
See also TOP 10 Climate Change Alarmist Myths Unearthed : #2 SEA LEVEL RISE
by Paul Homewood, May 30, 2018 in NotaLotofPeopleknowThat
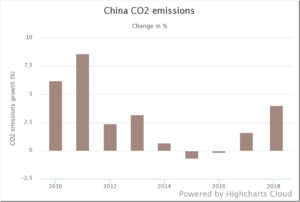
China’s carbon emissions growth has accelerated since the beginning of the year, leading to warnings that the country could be headed for its largest annual increase in climate pollution since 2011.
Led by increased demand for coal, oil and gas, China’s CO2 emissions for the first three months of 2018 were 4% higher than they were for the same period in 2017, according to an Unearthed analysis of new government figures.
Analysts have suggested the country’s carbon emissions could rise this year by 5% — the largest annual increase in seven years, back when the airpocalypse was at its peak (…)
by Nicola Jones, January 11, 2011 in Nature
Corals around Japan are fleeing northwards, according to a new study. One type has been spotted ‘sprinting’ at 14 kilometres a year, thanks to a lift from ocean currents. That means ocean ecosystems could shift rapidly in the face of climate-change impacts such as warming seas, the authors say.
…
by Willie W.H. Soon et al., May 22, 2018 in EarthScienceReviews
Most estimates of Chinese regional Surface Air Temperatures since the late-19th century have identified two relatively warm periods – 1920s–40s and 1990s–present. However, there is considerable debate over how the two periods compare to each other. Some argue the current warm period is much warmer than the earlier warm period. Others argue the earlier warm period was comparable to the present. In this collaborative paper, including authors from both camps, the reasons for this ongoing debate are discussed. Several different estimates of Chinese temperature trends, both new and previously published, are considered. A study of the effects of urbanization bias on Chinese temperature trends was carried out using the new updated version of the Global Historical Climatology Network (GHCN) – version 4 (currently in beta production)
(…)
by University of Sydney, May 28, 2018 in ScienceDaily
Over millennia, the reef has adapted to sudden changes in environment by migrating across the sea floor as the oceans rose and fell.
The study published today in Nature Geoscience, led by University of Sydney’s Associate Professor Jody Webster, is the first of its kind to reconstruct the evolution of the reef over the past 30 millennia in response to major, abrupt environmental change.
The 10-year, multinational effort has shown the reef is more resilient to major environmental changes such as sea-level rise and sea-temperature change than previously thought but also showed a high sensitivity to increased sediment input and poor water quality. (…)
by Anthony Watts, May 28, 2018 in WUWT
This manntastic event looms large. With the irascible Dr. Mann pitted against Moore and Curry, fireworks are almost guaranteed. Titley is a lightweight and he’ll be overshadowed by Mann’s huge ego and need to control the conversation. Their idea to hear a “collegial and balanced” discussion may very well be a pipe dream, especially after what happened the last time when Mann and Curry were testifying before congress.
The event is open to the public.
by Donna Laframboise, May 2018 in BigPictureNews
POTLIGHT: Examining a mass market paperback.
BIG PICTURE: The Population Bomb was first published in May 1968 – 50 years ago this month. Page one of my copy, printed in 1970, describes its author as “a qualified scientist.” The back cover provides further detail: (…)
by Eric Holthaus, May 2018 , in Climatism
SEPTEMBER 2017
Dr. Christy was 100% correct …
A landmark paper by warmist scientists in Nature Geoscience now concedes the world has indeed not warmed as predicted, thanks to a slowdown in the first 15 years of this century. One of its authors, Michael Grubb, professor of international energy and climate change at University College London, admits his past predictions of runaway warming were too alarmist.
“When the facts change, I change my mind. We are in a better place than I thought.”
ANOTHER author, Myles Allen, professor of geosystem science at Oxford, confessed that too many of the mathematical models used by climate scientists to predict future warming “were on the hot side” — meaning they exaggerated.
“We haven’t seen that rapid acceleration in warming after 2000 that we see in the models.”
(…)
by John Harz, May 5, 2018 in SkepticalScience
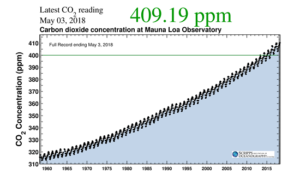
A chronological listing of news articles posted on the Skeptical Science Facebook Page during the past week.
Recent CO2 measurements at Mauna Loa Observatory in Hawaii. (Scripps Institution of Oceanography)
by F. Bosse and F. Vahrenholt in P. Gosselin, May 25, 2018 NoTricksZone
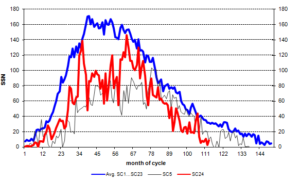
The sun was inactive in April, as we currently find ourselves in the minimum between solar cycle (SC) 24 and the coming solar cycle 25.
The recorded mean sunspot number (SSN) for April was 8.9, which is only 28% of what is usual 113 months into a solar cycle. In April, 16 days were spotless. The following chart shows sunspot activity (…)
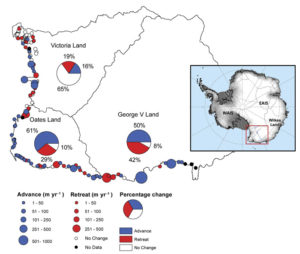
by Lovell, A.M. et al., 2017 in CO2Science, May 24, 2018
In describing their findings, Lovell et al. state that “between 1972 and 2013, 36% of glacier termini in the entire study area advanced and 25% of glacier termini retreated, with the remainder showing no discernible change outside of the measurement error (± 66 m or ± 1.6 m yr-1) and classified as ‘no change'” (see figure below). Although there were some regional differences in glacier termini changes, these regions over the last four decades were more closely linked to non-climatic drivers, such as terminus type and geometry, than any obvious climatic or oceanic forcing.”
See aslo : Terrifying Times For Climate Alarmists
by Duvat et al. 2017, Global&Planetary Change in CO2Science
Writing as background for their study, Duvat et al. (2017) state that “it has commonly been considered that atoll reef islands would disappear under climate change, as a result of sea-level rise and induced accelerating shoreline erosion,” citing the works of Connell (2003), Dickinson (2009) and McAdam (2010). This perception is based on model predictions, which have been hyped all over the globe, especially among politicians and the media, some of whom demand reparations for small island States who they fear will be forced to abandon their islands within decades.
But how much faith should one place in such projections and concerns?
According to Duvat et al., not that much … (…)
by Anthony Watts, May 23, 2018 in WUWT
Have you been keeping an eye on Sol lately? One of the top astronomy stories for 2018 may be what’s not happening, and how inactive our host star has become.
The strange tale of Solar Cycle #24 is ending with an expected whimper: as of May 8th, the Earthward face of the Sun had been spotless for 73 out of 128 days thus far for 2018, or more than 57% of the time. This wasn’t entirely unexpected, as the solar minimum between solar cycle #23 and #24 saw 260 spotless days in 2009 – the most recorded in a single year since 1913.
Cycle #24 got off to a late and sputtering start, and though it produced some whopper sunspots reminiscent of the Sol we knew and loved on 20th century cycles past, it was a chronic under-performer overall. Mid-2018 may see the end of cycle #24 and the start of Cycle #25… or will it?
by Willis Eschenbach, May 22, 2018 in WUWT
There’s been some discussion of the rate of sea level rise lately, so I thought I’d take a look at some underlying data.
I started with a 2016 paper by the modern master of failed serial doomcasting, James Hansen. It has the frightening title of “Ice melt, sea level rise and superstorms: evidence from paleoclimate data, climate modeling, and modern observations that 2°C global warming could be dangerous” … yikes! Be very afraid!
In Figure 29 of that paper, Hansen claims to show that sea level rise has been accelerating, from 0.6 mm/year from 1900 to 1930, to 1.4 mm/year from 1930 to 1992, and 2.6 mm/year from 1993 to 2015.
(…)
by Li M. et al., 2017 in CO2Science/Int.J.Biometeorology
In discussing the characteristics of their three-century temperature proxy, the authors report the existence of two prominent decadal-scale cold periods (1801-1833 and 1961-2003) and two prominent decadal-scale warm periods (1730-1800 and 1928-1960). They also note that “fifteen extreme cold years (< -1.5σ) were identified and most occurred within 1-2 years after major volcanic eruptions,” contrasting with the finding that the two decadal-scale warm periods both occurred during “gaps in volcanic activities.”
Perhaps the most significant observation made by the authors, however, is that “none of the extreme warm years [< 1.5σ] or decades occurred in the most recent 30 years,” which fact runs counter to anthropogenic global warming claims that temperatures of the past few decades have been the warmest of the past thousand years (…)