Archives par mot-clé : Sun

Has the Sun’s true role in global warming been miscalculated?

by CeresTeam, Oct 2023 in CeresScience


A new international study published in the scientific peer-reviewed journal, Research in Astronomy and Astrophysics, by 20 climate researchers from 12 countries suggests that the UN’s Intergovernmental Panel on Climate Change (IPCC) might have substantially underestimated the role of the Sun in global warming.

The article began as a response to a 2022 commentary on an extensive review of the causes of climate change published in 2021. The original review (Connolly and colleagues, 2021) had suggested that the IPCC reports had inadequately accounted for two major scientific concerns when they were evaluating the causes of global warming since the 1850s:

  1. The global temperature estimates used in the IPCC reports are contaminated by urban warming biases.

  2. The estimates of solar activity changes since the 1850s considered by the IPCC substantially downplayed a possible large role for the Sun.

On this basis, the 2021 review had concluded that it was not scientifically valid for the IPCC to rule out the possibility that global warming might be mostly natural.

The findings of that 2021 review were disputed in a 2022 article by two climate researchers (Dr. Mark Richardson and Dr. Rasmus Benestad) for two main reasons:

  1. Richardson and Benestad (2022) argued that the mathematical techniques used by Connolly and colleagues (2021) were inappropriate and that a different set of mathematical techniques should have been used instead.

  2. They also argued that many of the solar activity records considered by Connolly and colleagues (2021) were not up-to-date.

They suggested that these were the reasons why Connolly and colleagues (2021) had come to a different conclusion from the IPCC.

This new 2023 article by the authors of the 2021 review, has addressed both of these concerns and shown even more compelling evidence that the IPCC’s statements on the causes of global warming since 1850 are scientifically premature and may need to be revisited.

The authors showed that the urban component of the IPCC’s global temperature data shows a strong warming bias relative to the 98% of the planet that is unaffected by urbanization. However, they also showed that urbanized data represented most of the weather station records used.


While the IPCC only considered one estimate of solar activity for their most recent (2021) evaluation of the causes of global warming, Connolly and colleagues compiled and updated 27 different estimates that were used by the scientific community.

Several of these different solar activity estimates suggest that most of the warming observed outside urban areas (in rural areas, oceans, and glaciers) could be explained in terms of the Sun. Some estimates suggest that global warming is a mixture of human and natural factors. Other estimates agreed with the IPCC’s findings.

For this reason, the authors concluded that the scientific community is not yet in a position to establish whether the global warming since the 1850s is mostly human-caused, mostly natural or some combination of both.

Professor Valentina Zharkova and the Little Ice Age Which Has Already Started

by V. Zharkova, Apr 11, 2024 in FreedomResearch


Astrophysicist Professor Valentina Zharkova explains that instead of CO2, it is the Sun that drives the climate change and because of its decreasing activity we should be ready for a colder period.

“CO2 is not a bad gas,” says Valentina Zharkova, a professor at the Northumbria University in Newcastle, UK. On the contrary, she points out, every garden centre uses it in its greenhouses to make plants lush and green. “We actually have a CO2 deficit in the world, and it’s three to four times less than the plants would like,” she notes, adding that the proportion of CO2 in the atmosphere has been at much higher levels throughout our planet’s history than it is now.

In fact, over the last 140 million years, the amount of CO2 in the atmosphere has been steadily decreasing and only now slightly starting to rise. It is currently around 420 parts per million (ppm), or 0.042%. 140 million years ago, it was estimated at 2,500 ppm (0.25%), or about six times higher. And it also meant a greener and more biodiverse world. If CO2 were to fall below 150 ppm (0.015%), it would already mean the extinction of vegetation and all other life. We came close to that during the last glacial maximum when it was at 182 ppm (0.018%).

Zharkova says that the fact that CO2 levels in the atmosphere are now increasing is a good thing. “We don’t need to remove CO2 because we would actually need more of it. It’s food for plants to produce oxygen for us. The people who say CO2 is bad are obviously not very well educated at university or wherever they studied. Only uneducated people can come up with such absurd talk that CO2 should be removed from the air,” says Zharkova.

Terrestrial temperature, sea levels and ice area links with solar activity and solar orbital motion

by V. Zharkova & I. Vasilieeva, Nov 2023


Abstract: This paper explores the links between terrestrial temperature, sea levels and ice areas in both hemispheres with solar activity indices expressed through averaged sunspot numbers together with the summary curve of eigen vectors of the solar background magnetic field (SBMF) and with changes of Sun-Earth distances caused by solar inertial motion resulting from the gravitation of large planets in the solar system.

Using the wavelet analysis of the GLB  and HadCRUTS datasets two periods: 21.4  and 36 years in GLB, set   and the period of about 19.6 years  in the HadCRUTS are discovered. The 21.4 year period is associated with variations in solar activity defined by the summary curve of the largest eigen vectors of the SBMF. A dominant 21.4-year period is also reported in the variations of the sea level, which is linked with the period of 21.4 years detected in the GLB temperature and the summary curve of the SBMF variations.  The wavelet analysis  of ice and snow areas shows that  in the Southern hemisphere it does not show any links to solar activity periods while in the Northern hemisphere the ice area  reveals  a period of 10.7 years equal to a usual solar acitviity cycle.

The TSI in March-August of every year  is found  to grow with every year following closely the temperature curve, because the Sun moves  closer to the Earth orbit owing to gravitation of large planets. (solar inertial motion, SIM). While the variations of solar radiation during a whole year have  more steady distribution without  a sharp TSI increase  during the last two centuries. The additional TSI contribution caused by SIM is likely to secure the additional energy input and exchange between the ocean and atmosphere.


Link to pre-print:  https://solargsm.com/wp-content/uploads/2023/11/zharkova_tsi_nc_form_subm-1.pdf


The paper is accepted for publication.

Understanding the role of the sun in climate change

by N. Scafetta, July 6, 2023 in Andy May Blog


Although the sun provides nearly all the energy needed to warm the planet, its contribution to climate change remains widely questioned. Many empirically based studies claim that it has a significant effect on climate, while others (often based on computer global climate simulations) claim that it has a small effect.

The Intergovernmental Panel on Climate Change (IPCC) supports the latter view and estimates that almost 100% of the observed warming of the Earth’s surface from 1850–1900 to 2020 was caused by man-made emissions (AR6 WG1, pages 63, 425, and 962). This is known as the anthropogenic global warming (AGWT) theory.

I addressed this important paradox in a new study published in Geoscience Frontiers. The conundrum appears to arise from two sets of uncertainties: (i) the historical decades and long-term variations in solar activity are unknown; (ii) the sun may affect Earth’s climate through various physical mechanisms many of which are not fully understood and are not incorporated into the global climate models (GCMs).

It is important to notice that the AGWT is based solely on computer global climate model simulations that use total solar irradiance (TSI) records with very low multidecadal and long-term variability. The models also assume that the sun affects the climate system only through radiative forcing, although there is evidence that other solar processes related to solar magnetic activity (solar wind, cosmic rays, interplanetary dust, etc.) also affect the climate.

The total solar irradiance (TSI) records


Solar Activity: Cycle 25 Surpasses Cycle 24

by J. Vinos, Jul 6, 2023 in WUWT


Over the past two decades, solar activity has been characterized by an extended solar minimum spanning two solar cycles, known as the Clilverd Minimum. This phenomenon is currently affecting the climate, but before we can understand its impact, we must address the significant discrepancy between the solar effects observed in paleoclimate proxy records and modern observations. The relationship between solar signals and climate response is complex and not fully understood. However, there is substantial evidence from models and reanalyses that the relationship exists. A recent hypothesis is that the solar signal modulates heat and moisture transport to the Arctic, which explains its relatively small effect during a single solar cycle. However, when an anomaly in solar activity persists over several cycles, as it did during the 70-year modern solar maximum, its effect accumulates and has a large impact on the planet’s energy budget. Understanding this mechanism is critical to understanding the overall impact of solar activity on our climate.

Current Solar Activity

The monthly sunspot number for June 2023 reached 163.4. While this figure may be revised slightly, it’s likely to stand as the highest number seen in over two decades, since September 2002. Solar Cycle 25 is relatively young, only three and a half years old, which means there are ample opportunities over the next three years to surpass this month’s 20-year record. Based on recent data, it seems very likely that Solar Cycle 25 will surpass Solar Cycle 24 in terms of activity.

Figure 1. Daily and monthly sunspot numbers over the past 13 years, as provided by SILSO.

Solar Sensitivity

by W. Eschenbach, Oct 16, 2022 in WUWT


In my previous post, “Global Scatterplots“, I discussed how a gridcell-by-gridcell scatterplot of the entire globe could be used to gain insights into the relationship between two variables. The variables I discussed in that post were the cloud radiative effect (CRE) as a function of the temperature. At the end of that post, I threatened as follows:

I will return to what I’ve learned from other gridcell scatterplots in the next post.

So as foretold in the ancient palimpsest texts … he’s baack!

For this expedition into global scatterplots, Figure 1 shows the surface temperature as a function of the amount of solar power that’s actually entering the climate system. This available solar power is the top-of-atmosphere (TOA) solar, minus the “albedo reflections”, which are the amount of sunlight reflected back to space by the clouds and the surface.

Re-evaluating the role of solar variability on Northern Hemisphere temperature trends since the 19th century

by W. Soon et al., 2015 in EarthScienceReviews


Abstract

Debate over what influence (if any) solar variability has had on surface air temperature trends since the 19th century has been controversial. In this paper, we consider two factors which may have contributed to this controversy:

1.

Several different solar variability datasets exist. While each of these datasets is constructed on plausible grounds, they often imply contradictory estimates for the trends in solar activity since the 19th century.

2.

Although attempts have been made to account for non-climatic biases in previous estimates of surface air temperature trends, recent research by two of the authors has shown that current estimates are likely still affected by non-climatic biases, particularly urbanization bias.

With these points in mind, we first review the debate over solar variability. We summarise the points of general agreement between most groups and the aspects which still remain controversial. We discuss possible future research which may help resolve the controversy of these aspects. Then, in order to account for the problem of urbanization bias, we compile a new estimate of Northern Hemisphere surface air temperature trends since 1881, using records from predominantly rural stations in the monthly Global Historical Climatology Network dataset. Like previous weather station-based estimates, our new estimate suggests that surface air temperatures warmed during the 1880s–1940s and 1980s–2000s. However, this new estimate suggests these two warming periods were separated by a pronounced cooling period during the 1950s–1970s and that the relative warmth of the mid-20th century warm period was comparable to the recent warm period.

We then compare our weather station-based temperature trend estimate to several other independent estimates. This new record is found to be consistent with estimates of Northern Hemisphere Sea Surface Temperature (SST) trends, as well as temperature proxy-based estimates derived from glacier length records and from tree ring widths. However, the multi-model means of the recent Coupled Model Intercomparison Project Phase 5 (CMIP5) climate model hindcasts were unable to adequately reproduce the new estimate — although the modelling of certain volcanic eruptions did seem to be reasonably well reproduced.

Finally, we compare our new composite to one of the solar variability datasets not considered by the CMIP5 climate models, i.e., Scafetta and Willson, 2014’s update to the Hoyt and Schatten, 1993 dataset. A strong correlation is found between these two datasets, implying that solar variability has been the dominant influence on Northern Hemisphere temperature trends since at least 1881. We discuss the significance of this apparent correlation, and its implications for previous studies which have instead suggested that increasing atmospheric carbon dioxide has been the dominant influence.

NEW STUDY: 23 EXPERTS IN THE FIELDS OF SOLAR PHYSICS AND CLIMATE SCIENCE CONTRADICT THE IPCC — THE SCIENCE IS NOT SETTLED

by Cap Allon, Aug 16, 2021 in Electroverse


A diverse expert panel of global scientists finds blaming climate change mostly on greenhouse gas emissions was premature. Their findings contradict the UN IPCC’s conclusion, which the study shows, is grounded in narrow and incomplete data about the Sun’s total solar irradiance (TSI).

A new scientific review article has just been published on the role of the Sun in climate change over the last 150 years.

It finds that the United Nations’ Intergovernmental Panel on Climate Change (IPCC) may have been premature in their conclusion that recent climate change is mostly caused by human greenhouse gas emissions.

The paper by 23 experts in the fields of solar physics and of climate science from 14 different countries is published in the peer-reviewed journal Research in Astronomy and Astrophysics (RAA).

The paper, which is the most comprehensive to date, carries out an analysis of the 16 most prominent published solar output datasets, including those used by the IPCC.

The researchers compared them to 26 different estimates of Northern Hemisphere temperature trends since the 19th century (sorted into five categories), including the datasets used by the IPCC.

They focused on the Northern Hemisphere since the available data for the early 20th century and earlier is much more limited for the Southern Hemisphere, but their results can be generalized for global temperatures.

Dr. Ronan Connolly, lead author of the study, at the Center for Environmental Research and Earth Sciences (CERES):

“The IPCC is mandated to find a consensus on the causes of climate change. I understand the political usefulness of having a consensus view in that it makes things easier for politicians. However, science doesn’t work by consensus. In fact, science thrives best when scientists are allowed to disagree with each other and to investigate the various reasons for disagreement. I fear that by effectively only considering the datasets and studies that support their chosen narrative, the IPCC have seriously hampered scientific progress into genuinely understanding the causes of recent and future climate change. I am particularly disturbed by their inability to satisfactorily explain the rural temperature trends.”

Challenging UN, Study Finds Sun—not CO2—May Be Behind Global Warming

by P. Homewood, Aug 16, 2021 in NotaLotofPeopleKnowThat


The sun and not human emissions of carbon dioxide (CO2) may be the main cause of warmer temperatures in recent decades, according to a new study with findings that sharply contradict the conclusions of the United Nations (UN) Intergovernmental Panel on Climate Change (IPCC).

The peer-reviewed paper, produced by a team of almost two dozen scientists from around the world, concluded that previous studies did not adequately consider the role of solar energy in explaining increased temperatures.

The new study was released just as the UN released its sixth “Assessment Report,” known as AR6, that once again argued in favor of the view that man-kind’s emissions of CO2 were to blame for global warming. The report said human responsibility was “unequivocal.”

But the new study casts serious doubt on the hypothesis.

Calling the blaming of CO2 by the IPCC “premature,” the climate scientists and solar physicists argued in the new paper that the UN IPCC’s conclusions blaming human emissions were based on “narrow and incomplete data about the Sun’s total irradiance.”

Indeed, the global climate body appears to display deliberate and systemic bias in what views, studies, and data are included in its influential reports, multiple authors told The Epoch Times in a series of phone and video interviews.

“Depending on which published data and studies you use, you can show that all of the warming is caused by the sun, but the IPCC uses a different data set to come up with the opposite conclusion,” lead study author Ronan Connolly, Ph.D. told The Epoch Times in a video interview.

“In their insistence on forcing a so-called scientific consensus, the IPCC seems to have decided to consider only those data sets and studies that support their chosen narrative,” he added.

The implications, from a policy perspective, are enormous, especially in this field where trillions of dollars are at stake and a dramatic re-organization of the global economy is being proposed.

Paper Examines Sun Vs. CO2

….

Two Dozen Top Scientists: IPCC “Premature” Blaming CO2 Emissions…Warming Mostly From Natural Cycles

by P. Gosselin, Aug 18, 2021 in NoTricksZone


Most of the energy in the Earth’s atmosphere comes from the Sun. This new study found that the UN’s Intergovernmental Panel on Climate Change (IPCC) only considered a small subset of the published TSI datasets when they assessed the role of the Sun in climate change and that this subset only included “low solar variability” datasets. As a result, the IPCC was premature in ruling out a substantial role for the Sun in recent climate change.

A diverse expert panel of global scientists finds blaming climate change mostly on greenhouse gas emissions was premature. Their findings contradict the UN IPCC’s conclusion, which the study shows, is grounded in narrow and incomplete data about the Sun’s total solar irradiance.

The paper by 23 experts in the fields of solar physics and of climate science from 14 different countries is published in the peer-reviewed journal  (RAA). The paper, which is the most comprehensive to date, carries out an analysis of the 16 most prominent published solar output datasets, including those used by the IPCC.

Scientists come to opposite conclusions recent climate change causes 

The researchers compared them to 26 different estimates of Northern Hemisphere temperature trends since the 19th century (sorted into five categories), including the datasets used by the IPCC. They focused on the Northern Hemisphere since the available data for the early 20th century and earlier is much more limited for the Southern Hemisphere, but their results can be generalized for global temperatures.

“Likelihood Of A Sub-Cooled Summer For Europe In 2021”, Hale Solar Cycle Suggests

by Dr Ludger Laurenz, May 30, 2021, in NoTricksZone


So far, much of Europe has seen a cold and wet 2021. It may be related to solar cycles. 

An essay at Die kalte Sonne by Dr. Ludger Laurenz looks at the relationship between solar activity and weather trends, and believes this summer’s temperature will be 1.5°C lower.

There are many scientific opinions about solar activity’s impact on weather and climate, which differ and contradict each other. For example, a new publication by Leamon et al. provides an important building block for uncovering solar influence. Background here.

Solar influence in historical climate data substantiated

In the Leamon et al publication, the authors looked at the 22-year Hale solar cycles and saw it is possible to detect and substantiate solar influence in historical climate data (from tropical ocean surface temperature to temperature, sunshine, and precipitation data) and to make quantitative statements about the influence of solar activity on weather data.

Norway winter temperature and sun: “high statistical significance”

“Using the alternating years between Hale cycles, a correlation between the 22-year Hale cycle of the Sun and the trend of winter temperature in the polar night of Norway can be demonstrated with high statistical significance,” Dr Laurenz adds.

“Parallel to the temperature trend, the solar influence of the Hale cycles is also evident in the index values of the North Atlantic and Arctic Oscillations,” says Laurenz  in addition. “Evidence of the influence of solar activity in the polar night of Scandinavia demonstrates that differences in solar activity are transmitted to the near-surface temperature via amplification mechanisms such as change in circulation patterns in the North Atlantic and Arctic Oscillations.”

The sun’s role in weather patterns is a great significance, and so CO2 is not the main driver at all.

COSMIC RAY FLUX AND GLOBAL COOLING: THE IMPLICATIONS ARE UPON US

by Cap Allon, Apr 30, 2021 in Electroverse


GALACTIC Cosmic Rays are a mixture of high-energy photons and sub-atomic particles accelerated toward Earth by supernova explosions and other violent events in the cosmos, while SOLAR Cosmic Rays are effectively the same, only their source is the Sun.

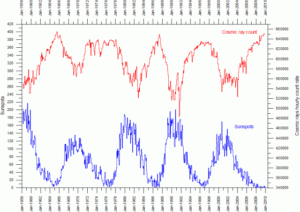
Spaceweather.com and the students of Earth to Sky Calculus have been launching cosmic ray balloons almost weekly since March 2015–before the pandemic threw a spanner in. The team’s published results reveal that atmospheric radiation reached record highs just as solar activity hit a new space age low — the correlation is clear for all to see, with additional proxy data revealing it has been the case for time-immemorial.

During solar minimums –the low point of the 11 year solar cycle– the Sun’s magnetic field weakens and the outward pressure of the solar wind decreases. This allows more cosmic rays (CRs) to penetrate the inner solar system, including our planet’s atmosphere:

Cosmic Rays correlating with Sunspots.

The Sun’s climate role confirmed

by D. Whitehouse, April 6, 2021 in GWPF


“The scientific community has been unclear on the role that solar variability plays in influencing weather and climate events here on Earth. This study shows there’s reason to believe it absolutely does and why the connection may have been missed in the past.”

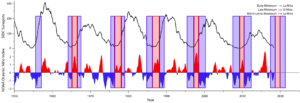
Top: Six-month smoothed monthly sunspot number from SILSO.  Bottom: Oceanic El Niño Index from NOAA. Red and blue boxes mark the El Niño and La Niña periods in the repeating pattern. Source: Climate Etc, September 2019

If you ask most climate scientists, they will tell you that the Sun’s small variability is unimportant when it comes to influencing climate. They may have to change their minds if a new line of research holds up. It seems that solar variability can drive climate variability on Earth on decadal timescales (the decadal climatic variability that Michael Mann recently ‘proved’ doesn’t exist). That’s the conclusion of a new study showing a correlation between the end of solar cycles and a switch from El Nino to La Nina conditions in the Pacific Ocean. It’s a result that could significantly improve the predictability of the largest El Nino and La Nina events, which have several global climate effects.

New study ties solar variability to the onset of decadal La Nina events

by C. Rotter, April 5, 2021 in NATIONAL CENTER FOR ATMOSPHERIC RESEARCH/UNIVERSITY CORPORATION FOR ATMOSPHERIC RESEARCH


A new study shows a correlation between the end of solar cycles and a switch from El Nino to La Nina conditions in the Pacific Ocean, suggesting that solar variability can drive seasonal weather variability on Earth.

If the connection outlined in the journal Earth and Space Science holds up, it could significantly improve the predictability of the largest El Nino and La Nina events, which have a number of seasonal climate effects over land. For example, the southern United States tends to be warmer and drier during a La Nina, while the northern U.S. tends to be colder and wetter.

“Energy from the Sun is the major driver of our entire Earth system and makes life on Earth possible,” said Scott McIntosh, a scientist at the National Center for Atmospheric Research (NCAR) and co-author of the paper. “Even so, the scientific community has been unclear on the role that solar variability plays in influencing weather and climate events here on Earth. This study shows there’s reason to believe it absolutely does and why the connection may have been missed in the past.”

The study was led by Robert Leamon at the University of Maryland-Baltimore County, and it is also co-authored by Daniel Marsh at NCAR. The research was funded by the National Science Foundation, which is NCAR’s sponsor, and the NASA Living With a Star program.

Applying a new solar clock

Japanese Climate Scientist Kyoji Kimoto: “Climate Change Governed By The Sun”, CO2 Lesser Role!

by P. Gosselin, Jan 22, 2021 in NoTricksZone


I’ve compiled a list of six examples how the sun impacts climate across the globe.

1. Climate periods based on a double Hale (44-45 years) cycle of solar activity.

In 1977 Australian geologist Rhodes W. Fairbridge found a 45-year periodicity of beach ridge located at the Hudson Bay. It has been formed with storms in Hudson Bay caused by a wavier jet stream.

I have found a 44-year periodicity of heavy snowfall in Japan caused by the wavier jet stream as follows. The time series coincide quite well with that of Fairbridge (1977).

1833   Tempo famine, Dalton minimum (1795-1830)
1877   Seinan war (44 years later)
1918   Rice riot, Gleissberg minimum (1898-1923) (41 years later)
1963   38 heavy snowfall (45 years later)
2006  Heisei 18 year heavy snowfall, Gleissberg or Dalton minimum (43 years)

The climate history of 20th century can be divided with the following 5 periods based on the double Hale cycle above using aa-index of geomagnetism associated with solar activity. The Pacific Climate Shift occurred at 1977 with solar activity increase & a positive PDO index.

1900-1918: Little Ice Age (LIA)
1919-1962: 1st Modern Warm Period (1st MWP)
1963-1976: Temporal Cold Period  (TCP, New Ice Age Coming, see below)
1977-2005: 2nd Modern Warm Period (2nd MWP)
2006 – present: New Cold Period (NCP)

New sunspot cycle could be one of the strongest on record, new research predicts

by National Center for Atmospheric Research/University Corporation for Atmospheric Research, Dec 7, 2020 in ScienceDaily


In direct contradiction to the official forecast, a team of scientists led by the National Center for Atmospheric Research (NCAR) is predicting that the Sunspot Cycle that started this fall could be one of the strongest since record-keeping began.

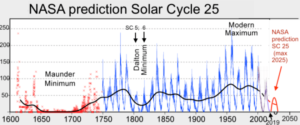
In a new article published in Solar Physics, the research team predicts that Sunspot Cycle 25 will peak with a maximum sunspot number somewhere between approximately 210 and 260, which would put the new cycle in the company of the top few ever observed.

The cycle that just ended, Sunspot Cycle 24, peaked with a sunspot number of 116, and the consensus forecast from a panel of experts convened by the National Aeronautics and Space Administration (NASA) and the National Oceanic and Atmospheric Administration (NOAA) is predicting that Sunspot Cycle 25 will be similarly weak. The panel predicts a peak sunspot number of 115.

New Study Finds A Robust Link Between European Temperatures And Solar Activity Via AMO/NAO Modulation

by K. Richard, Oct 22, 2020 in NoTricksZone


European winter temperature variability is “dominated” by the North Atlantic Oscillation (NAO), which is, in turn, modulated by solar activity.

Even proponents of anthropogenic global warming (AGW) agree natural processes (AMO, NAO, ENSO, solar forcing, volcanism) drive temperature variability. But they insist the rising temperature trend is human-caused.

So if we don’t have a regional upward trend, is the non-warming natural or anthropogenic?

Lüdecke et al., 2020 find temperatures across Europe have been oscillating, not rising in linear fashion, for the last century. The timings of the temperature undulations correspond quite closely to natural ocean cycles (the NAO and AMO). The authors detail a non-linear and indirect solar activity impact on these ocean cycles, and ultimately to the European climate.

11 SCIENTIFIC PREDICTIONS FOR THE UPCOMING GRAND SOLAR MINIMUM

by Cap Allon, Sep 18, 2020 in Electroverse


 There is ever-mounting evidence warning the next epoch will be one of sharp terrestrial cooling due to a relative flat-lining of solar output.

The exact time-frame and depth of this next chill of solar minimum is still anyone’s guess, and the parameters involved (i.e., galactic cosmic rays, geomagnetic activity, solar wind flux etc.) remain poorly understood. However, there are some great minds on the job, and below I’ve collated 11 best-guesses based on published scientific papers from respected researchers in the field. The list begins with eminent Russian astrophysicist K. Abdussamatov–though it is in no particular order.

Solar panels generate mountains of waste

by D. Flanakin, Sep 19, 2020 in WUWT


They also heat the planet, blanket wildlife habitats and cause other ecological damage

The problem of solar panel waste is now becoming evident. As environmental journalist Emily Folk admits in Renewable Energy Magazine, “when talking about renewable energy, the topic of waste does not often appear.” She attributes this to the supposed “pressures of climate change” and alleged “urgency to find alternative energy sources,” saying people may thus be hesitant to discuss “possible negative impacts of renewable energy.”

Ms. Folk admits that sustainability requires proper e-waste management. Yet she laments, “Solar presents a particular problem. There is growing evidence that broken panels release toxic pollutants … [and] increasing concern regarding what happens with these materials when they are no longer viable, especially since they are difficult to recycle.”

This is the likely reason that (except in Washington state), there are no U.S. mandates for solar recycling. A recent article in Grist reports that most used solar panels are shipped to developing countries that have little electricity and weak environmental protections, to be reused or landfilled.

The near-total absence of end-of-life procedures for solar panels is likely a byproduct of the belief (and repeated, unsupported assertion) that renewable energy is “clean” and “green.” Indeed, Mississippi Sierra Club state director Louie Miller recently claimed that unlike fossil fuels and nuclear energy, “Sunshine is a free fuel.” Well, sunshine is certainly free and clean. However, there is a monumental caveat.

Harnessing sunshine (and wind) to serve humanity is not free – or clean, green, renewable or sustainable.

Solar Cycle 25 is here, says NASA

by Oldbrew, Sep 17 , 2020 in  Tallbloke’s Talkshop


Solar Cycle 25 has begun, according to this NASA press release.

During a media event on Tuesday, experts from NASA and the National Oceanic and Atmospheric Administration (NOAA) discussed their analysis and predictions about the new solar cycle – and how the coming upswing in space weather will impact our lives and technology on Earth, as well as astronauts in space.

The Solar Cycle 25 Prediction Panel, an international group of experts co-sponsored by NASA and NOAA, announced that solar minimum occurred in December 2019, marking the start of a new solar cycle.

Because our Sun is so variable, it can take months after the fact to declare this event.

PROFESSOR VALENTINA ZHARKOVA: “WE ENTERED THE ‘MODERN’ GRAND SOLAR MINIMUM ON JUNE 8, 2020”

by Cap Allon, August 20, 2020 in Electroverse


A new editorial paper has landed from professor Valentina Zharkova, entitled: “Modern Grand Solar Minimum will Lead to Terrestrial Cooling“. Published on August 4, 2020, Zharkova’s latest analysis suggests that June 8, 2020 was the date on which we entered the Modern (Eddy) Grand Solar Minimum.

The opening paragraph reads:

“In this editorial I will demonstrate with newly discovered solar activity proxy-magnetic field that the Sun has entered into the modern Grand Solar Minimum (2020–2053) that will lead to a significant reduction of solar magnetic field and activity like during Maunder minimum leading to noticeable reduction of terrestrial temperature.”

Another passage states:

“Currently, the Sun has completed solar cycle 24 – the weakest cycle of the past 100+ years – and in 2020, has started cycle 25. During the periods of low solar activity, such as the modern grand solar minimum, the Sun will often be devoid of sunspots. This is what is observed now at the start of this minimum, because in 2020 the Sun has seen, in total, 115 spotless days (or 78%), meaning 2020 is on track to surpass the space-age record of 281 spotless days (or 77%) observed in 2019. However, the cycle 25 start is still slow in firing active regions and flares, so with every extra day/week/month that passes, the null in solar activity is extended marking a start of grand solar minimum.”

What are the consequences for Earth of this decrease of solar activity?

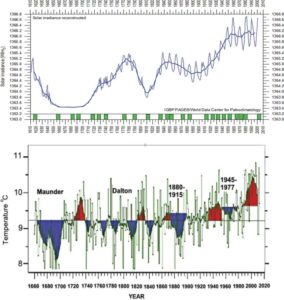
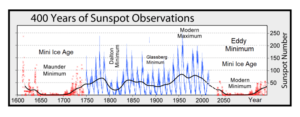
“From 1645 to 1710, the temperatures across much of the Northern Hemisphere of the Earth plunged when the Sun entered a quiet phase now called the Maunder Minimum. This likely occurred because the total solar irradiance was reduced by 0.22%,” shown below (top graph); “that led to a decrease of the average terrestrial temperature measured mainly in the Northern hemisphere in Europe by 1.0–1.5°C,” also below (bottom graph):

..

GRAND SOLAR MINIMUM INCOMING

by Cap Allon, August 27, 2020 in Electroverse


Solar Cycle 25 may be spluttering into life, but all is once-again quiet on the earth-facing solar disc: there are no sunspots — in fact, there haven’t been any for the past 6 days (as of Aug 27, 2020).

Solar activity is the driving force of Earth’s climate. This definition of obvious is only disputed by the misinformed, and by those with a financial or political motive.

High solar activity — as we’ve enjoyed for the past 100-or-so years — has delivered our planet a stable, predictable climate under-which we modern humans have had the opportunity to thrive and successfully advance our technological society.

However, and as with all good things, these predictable days are ending: the Sun’s output is waning to levels not seen for the past 200 years, to a reduction in activity not experienced since the Dalton Minimum(1790-1830). And as with every great and advancing civilization of the past, a time comes when the consequences of a solar shutdown need to be contended. We need to prepare for the wild swings-between-extremes brought about by an increasingly weak & wavy (meridional) jet stream, we need to be aware of a powerful volcanic uptick witnessed during times of low solar activity, as well as cloud-nucleating Cosmic Rays, and, perhaps most crucially, an overall cooling of the planet.

Crops are always the first to go. And our modern delicately-balanced, chemical-dependent, monocropping-ways simply aren’t prepared for a violent shift in the climate — as Robert Felix has long been warning, “I fear that we will be fighting in the streets for food long before we’re covered by ice.”


Le 20ème siècle a été anormalement chaud mais le 21èmesiècle revient à la normale (2/2)

by Jean Van Vliet, 22 août 2020 in ScienceClimatEnergie


Cet article fait suite à la première partie (1/2) publiée par SCE le 14 août 2020.

5. La longueur des cycles solaires

Le passage d’un cycle solaire au cycle suivant est défini en principe par le changement de signe du champ magnétique autour des taches solaires. Le moment de ce passage est difficile à déterminer dans le cas des cycles longs, parce qu’on peut avoir pendant plusieurs années cohabitation, dans le même hémisphère solaire, de taches solaires d’orientations magnétiques différentes. Ainsi, à l’heure d’écriture de cet article (juillet 2020), la fin du cycle solaire 24 se rapproche, mais les premières taches avec l’orientation magnétique du cycle 25 ont fait leur apparition dès 2019; si  le cycle 24 n’était pas terminé avant la fin de cette année, la transition du cycle 24 au cycle 25 serait étalée sur 3 années.

De manière à tirer profit de la richesse des données disponibles sur le site (ici)  la longueur des cycles solaires est déterminée comme suit: pour les cycles allant de 1700 à 1755, seules les moyennes annuelles du nombre de taches solaires sont disponibles et le début de cycle correspond à l’année suivant le minimum de cette moyenne. Pour les cycles allant de 1755 à nos jours, la longueur est déterminée en utilisant les moyennes mensuelles: le début de cycle correspond au mois à partir duquel s’amorce la montée du nombre de taches. Cette méthode diffère de celle utilisée par Friis-Christensen et Lassen [29] et Butler et Johnston [30] qui ont travaillé par interpolation au départ des valeurs mensuelles lissées sur 13 mois.

Comme nous allons le voir, la longueur des cycles solaires varie de 9 ans minimum (cycles 2, 3 et 8) à 14 ans (cycle 4 marquant le début du Minimum de Dalton et la Révolution française). La Figure 5 fournit les longueurs des 29 cycles solaires observés depuis le début du 18ème siècle, chaque valeur étant positionnée au milieu du cycle correspondant.  La figure suggère que la dispersion des cycles solaires va diminuant du 18ème au 20èmesiècle: de manière à préciser cette impression, on calcule dans le tableau suivant, pour chacun des siècles considérés, les longueurs moyennes des cycles solaires (en années) et leurs déviations standard.

Figure 5 : Longueur des 29 cycles solaires observés du 18ème au 21ème siècle.

Le résultat le plus frappant de ce tableau est que les cycles solaires du  20ème siècle sont en moyenne un an plus courts que ceux du 19ème siècle, la tendance s’inversant avec les 2 premiers cycles du 21ème siècle. En appliquant la corrélation de Butler et Johnston [24], ceci rendrait le 20ème siècle plus chaud de 0,5°C en moyenne que le 19ème siècle.

Astrophysicist Asserts The Globe Will Cool ~1°C During 2020-2053 Due To An Oncoming Grand Solar Minimum

by K. Richard, August 27, 2020 in NoTricksZone


During the last Grand Solar Minimum (17th century), global surface temperatures dipped to the coldest of the last 10,000 years – about 1.4°C colder than today. Dr. Zharkova, an astrophysicist, has determined another imminent drop in solar activity will lead to a 1°C cooling in the coming decades.

From 1645 to 1710, the Sun went into a quiet phase referred to as the Maunder Minimum. During this period, the “surface temperature of the Earth was reduced all over the Globe” (Zharkova, 2020). Cold summers and winters ensued, with glaciers extending onto farmland, sea ice expanding beyond the Arctic, and “frost fairs” on frozen rivers in Europe.
                                                                                                                                                       .
The coldest temperatures and most expansive ice extent (glaciers,  permafrost, sea ice) of the last 10,000 years occurred during both this period and the surrounding centuries – often referred to as the Little Ice Age (LIA) (Glazer et al., 2020Geirsdottir et al., 2019).

In a new paper, Dr. Valentina Zharkova asserts that during solar cycles 25-27, the Sun may return to a modern Maunder-like Grand Solar Minimum. This solar quiet phase is expected to substantially reduce the Earth’s solar magnetic field, which will, in turn, lead to an increase in cosmic rays extending into Earth’s atmosphere and thus an increase in high clouds reflecting the Sun’s radiation back to space.

The consequence? A reduction in global temperatures to just 0.4°C above what they were in 1710.

The role of atmospheric CO2 as a temperature-driving mechanism is not mentioned in the paper.

A method has been developed to study extreme space weather events

by SKOLKOVO INSTITUTE OF SCIENCE AND TECHNOLOGY (SKOLTECH), August 15, 2020 in WUWT/Rotter


Scientists at Skolkovo Institute of Science and Technology (Skoltech), together with colleagues from the Karl-Franzens University of Graz & the Kanzelhöhe Observatory (Austria), Jet Propulsion Laboratory of California Institute of Technology (USA), Helioresearch (USA) and Space Research Institute of the Russian Academy of Sciences (Russia) developed a method to study fast Coronal Mass Ejections, powerful ejections of magnetized matter from the outer atmosphere of the Sun. The results can help to better understand and predict the most extreme space weather events and their potential to cause strong geomagnetic storms that directly affect the operation of engineering systems in space and on Earth. The results of the study are published in the Astrophysical Journal.

Coronal Mass Ejections are among the most energetic eruptive phenomena in our solar system and the main source of major space weather events. Huge clouds of plasma and magnetic flux are ejected from the atmosphere of the Sun into the surrounding space with speeds ranging from 100 to 3500 km/s. These gigantic solar plasma clouds and the accompanying powerful shock waves can reach our planet in less than a day, causing severe geomagnetic storms posing hazards to astronauts and technology in space and on Earth.

One of the strongest Space Weather events occurred in 1859 when the induced geomagnetic storm collapsed the whole telegraph system in North America and Europe, the main means of communication for business and personal contacts in those days.